On Tuesday 20 March 2012 I gave this presentation to the Transport Economics Forum in Melbourne using material from this blog and some recently released data in BITRE’s Working Paper 127 on traffic growth in Australia. The presentation challenges some orthodox assumptions about transport trends in Australia and Melbourne.
When I get time, I hope to update existing posts to include the most recent data on (the lack of ) traffic growth.
What are the trends in traffic volumes on major toll roads in Australian cities? How sensitive are motorists to toll prices? How accurate have traffic forecasts been? Are traffic volumes on toll roads growing faster than traffic in general?
This post aims to shed some light on these questions.
I have sourced traffic data from various sources, including Transurban ASX releases, annual reports, Transport for NSW, operator websites and media reports (I cannot guarantee error-free data gathering).
Average daily volumes
Firstly, here is a chart showing the average daily volumes for toll roads where I have been able to obtain data. Note that I have used a log scale on the Y-axis. The label includes the most recent volume figure available. For some roads and time periods only report annual figures are available (shown as dots rather than lines).
The following charts show traffic volume growth since an early reference year, compared to BITRE estimates of total vehicle kms for each city:
Citylink volumes grew faster than general traffic for the first decade, but has been more in line with general traffic since then. You can see there are periods of suppressed demand, which very likely correlate with periods of major roadworks. After each period of roadworks, traffic volumes have rebounded strongly and shown further growth (probably eroding congestion reduction benefits). The underlying rate of growth appears to be declining.
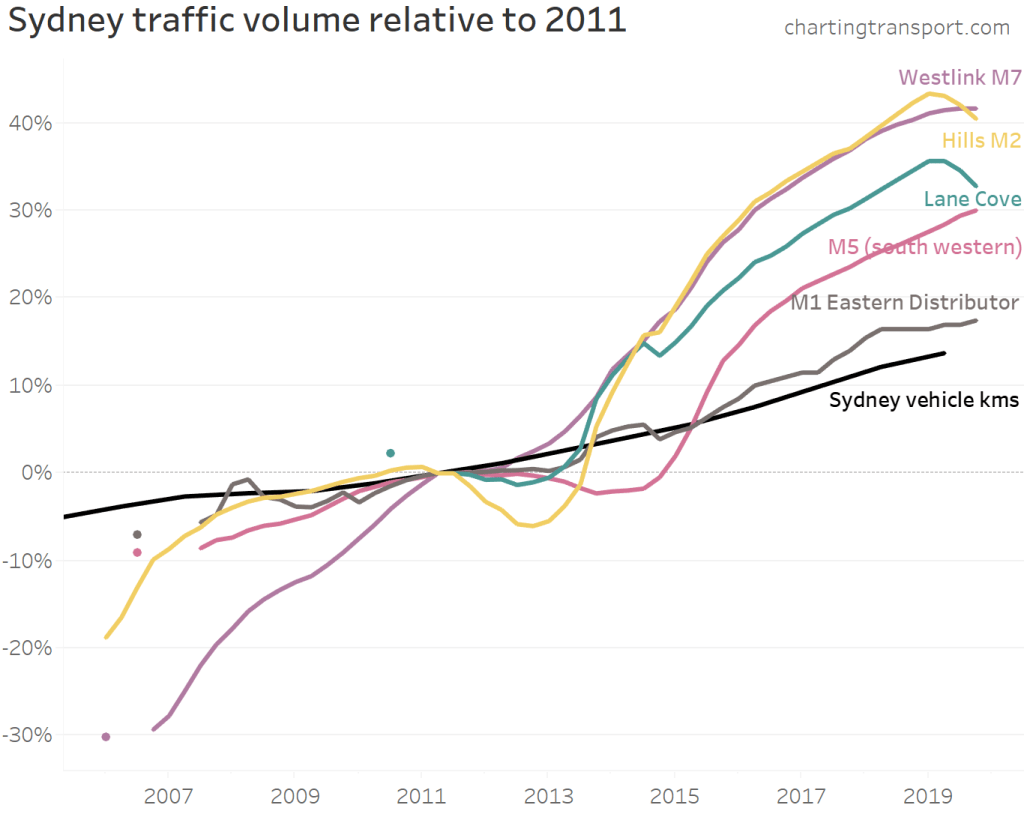
It’s a little more difficult to construct a chart for Sydney as different lengths of history are available for different roads. I’ve anchored the chart at 2011:
Most toll roads have had traffic growing faster than general traffic in Sydney. Westlink M7 and Hills M2 have had the highest growth since 2011, with the M1 Eastern Distributor showing the least growth. You can see declines on the Hills M2 and M5 (presumably during roadworks) followed by significant growth as capacity was made available.
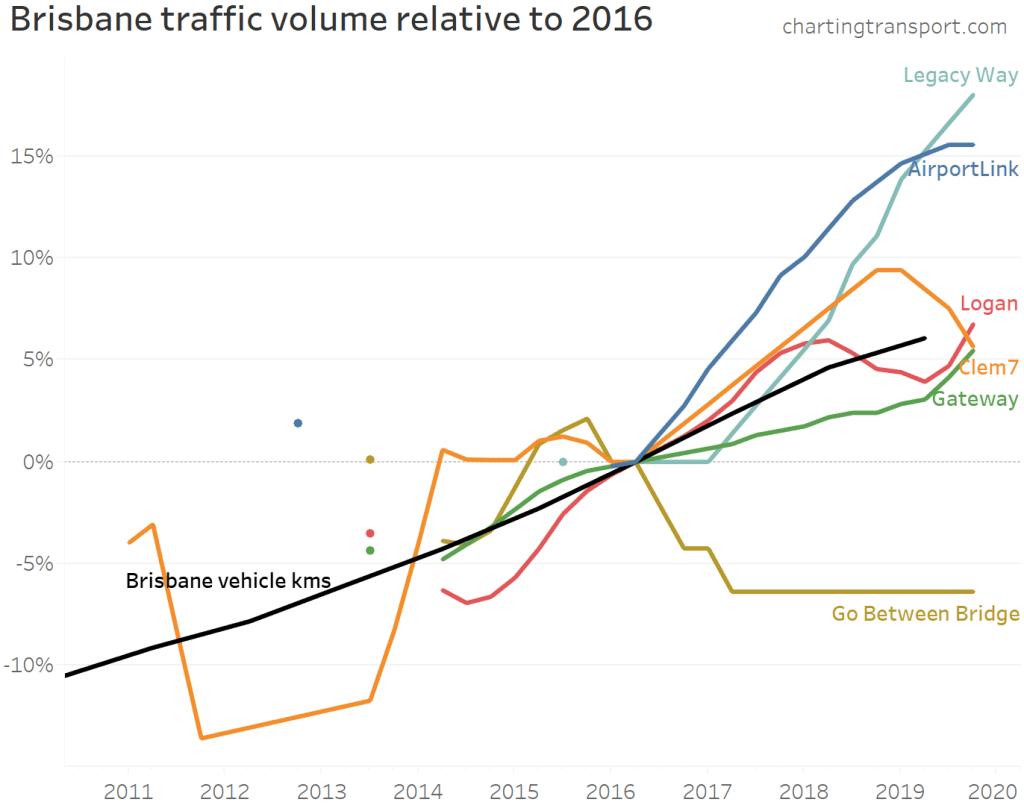
Not all of Brisbane’s toll roads have growth faster than overall traffic. Transurban report that AirportLink and Clem7 volumes have recently been impacted by upgrades on the Gateway motorway.
An important note on growth rate precision: Transurban report daily traffic volumes rounded to the nearest thousand. For roads with relatively small volumes (eg Clem7), the growth rates will be more impacted by rounding errors. For example, the traffic volumes on Clem7 went from 27+26+27+27=107 thousand in 2014/15 to 27+26+26+27=106 thousand in 2015/16, which is notional growth of -0.9%. But actual values for each quarter will be within +/-500, and the rounding errors will add up over the eight quarters making up the calculation. The actual growth could be anywhere between -4.6% and 2.9%, but is more likely to be in the middle of that range.
Unfortunately data isn’t always readily available:
The Brisbane Gateway Bridge and Logan/Gateway Motorway extension data is only available for financial years in annual reports up until 2010. Transurban took over these roads and have reported traffic volumes since 2013 but they do not appear to be comparable measures so I have listed them separately.
In October 2011, Horizon Roads purchased Melbourne’s Eastlink, and they do not seem to be publishing traffic volumes.
I haven’t been able to source Clem7 data for 2012 and the first half of 2013.
Traffic growth on other toll roads
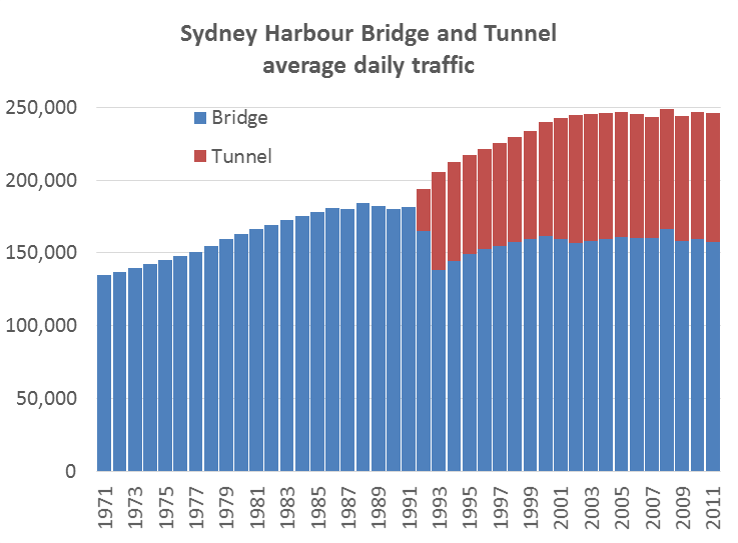
Sydney Harbour Bridge and Tunnel
Calum Hutcheson from Hyder Consulting has generously compiled and shared time-series data with me on traffic volumes going back to 1971 for these two toll roads. He has sourced data from several available sources but has had to estimate some figures where data is missing.
Traffic volumes levelled off on the bridge around 1988 and on the combined bridge and tunnel around 2005. It would appear the tunnel brought additional vehicle capacity good for around 17 years’ growth but that has now been exhausted (although I’m far from an expert in Sydney traffic). Traffic volumes on the tunnel have barely growth since 2010.
In 1992 one southbound lane of the bridge was converted to a bus lane (presumably related to the capacity freed up by the tunnel). The bridge’s vehicular traffic levels have not returned to 1988 levels, but I suspect the number of people moved in (road-based) vehicles has increased significantly (not to mention the train line across the bridge).
Sydney Cross City Tunnel
The Cross City Tunnel was forecast to carry 87,088 vehicles per day in 2006, but in 2019 was still less than half this amount.
I have not been able to source much data pre-2013, but a 2006 NSW Auditor General’s report contains some traffic volume data for 2005 and 2006, reproduced here (from page 32 of the report).
It would appear that motorists are highly sensitive to toll pricing, and the forecast volumes were not achieved even when tolls were removed.
Brisbane’s Clem7 cross-city tunnel
Brisbane’s first new road tunnel, the Clem7, opened in March 2010. During the first three weeks of toll-free operation, there was an average of 59,109 vehicles per day. During the first week of tolling, this fell to 20,602. The forecast was for initial traffic of around 60,000 vehicles per day, rising to 100,000 within 18 months. Owners at the time, Rivercity Motorways, went to the extraordinary step of publishing daily traffic data, as can be seen in the following chart showing traffic volumes since tolling commenced:
You can see an up-tick from the beginning of July 2010, when toll prices were cut. Tolls were raised in November 2010 and again in April 2011 and you can see corresponding drops in traffic volumes. Average daily traffic in calendar 2011 was 10% lower than for the first 12 months of operation (includes one overlapping quarter).
During the 2011 flood crisis tolls were waived for one week, and at the end of that period on Monday 17 January 2011, 40,566 vehicles were recorded, the highest since tolling commenced. This may or may not have also reflected closures to other roads making Clem7 more attractive. (footnote: actual weekend volumes have not been published for April 2010, so I have substituted the average non-workday figures, that have been published).
Traffic volumes on the Clem7 peaked at 30,000 in 2018, less than a third of the forecast for the year 2010.
Brisbane’s Airportlink
This toll road was forecast to attract 135,000 vehicles per day one month into operations, and have 165,000 vehicles per day after the ramp up period. Volumes in 2019 were around 63,000 – less than half the forecast after ramp up.
The traffic volumes declined as tolls were progressively introduced to all traffic. BrisConnections, the owner of the road, went into voluntary administration in February 2013.
The Clem7 and Airportlink roads are the first two major tollways as part of the TransApex plan for adding major road capacity to Brisbane.
The third piece of this puzzle is the Go Between Bridge, now part-owned by Transurban and they report a flat 11,000 vehicles per day as of 2019. The forecast was for 17,500 by 2011 and 21,000 by 2021.
I’m guessing it may be a very long time before these TransApex roads reach capacity.
Eastlink
The following chart shows that Eastlink actual traffic volumes were fairly consistently around 60-65% of original (2004) forecast after tolling began. It suggests the forecasts were good at estimating the ramp-up shape, but not so much the overall traffic volumes.
Note: ConnectEast issued revised forecasts in August 2009, including that (steady state annual) average daily trips in 2011 would be 209,900. That forecast doesn’t appear to have been realised either. Unfortunately data reporting stopped in October 2011 following the sale to Horizon Roads.
See another post on Melbourne traffic volumes. Some interesting recent data on Brisbane traffic volumes is in this report prepared for RiverCity Motorways (who operated the Clem7). It shows many major roads in Brisbane with stable or declining traffic volumes (possibly because they are at capacity, or possibly because of a mode shift to public transport).
New South Wales traffic data is available for selected locations, as well as detailed data for toll roads.
Victorian data for non-tolled roads is available here, but unfortunately does not include time series history.


 Posted by chrisloader