My last post looked at suburban employment areas, but what about the CBD? With the review of the City of Melbourne’s Transport Strategy, I’ve taken on a detailed analysis of transport to and from the CBD.
In this post I’ll look at questions like:
- Do CBD commuters come from the inner or outer suburbs?
- Do wealthy executive types snub public transport?
- How does mode share vary between the sexes and young and old?
- What impact are employer parking and driving subsidies having on mode choice?
I’m mostly focussing on the inner Melbourne CBD – using the ABS definition of “Melbourne – inner” SLA, which is essentially the Hoddle grid. However I’ve included Southbank or Docklands a couple of times, and there are also some comparisons with Sydney, Brisbane and Perth CBDs.
This is a long post, so grab a cuppa and get comfortable.
Where do the commuters come from?
According to the 2006 census, there were 137,853 commuter journeys into the CBD.
The first map shows the number of commuters from each SLA in Melbourne. The shading represents simple density of CBD commuters by area, which is not ideal because outer metro SLAs can be impacted by low average population density. At the same time, not all SLAs have the same population so some will always have large numbers (eg Manningham west). As always, click to zoom in.
The CBD attracted workers from all over Melbourne, but certainly with a high concentration from the inner suburbs.
To get around the density issue, I’ve drawn a map showing the percentage of workers from each SLA who work in the CBD, Southbank or Docklands:
You can see the percentage drops off fairly uniformly by distance. The CBD is not a major destination for most middle and outer suburban areas.
What modes of transport do commuters use? (by area)
Firstly a map showing the public transport mode share from each SLA (green = higher):
Public transport mode share was largely above 70% for much of Melbourne and indeed most surrounding areas.
A few low spots stick out:
- Manningham west and east, serviced only by buses (that have recently been signficantly upgraded)
- Northern parts of Boroondara and 52% and 55%. These wealthy areas are serviced by frequent trams and buses, although with a relatively slow trip in.
- Rowville (Knox south) is at 57%, but bear in mind there were only 800 commuters from Rowville to the CBD (and I expect most of these would be park and ride train commuters). In fact, the catchment of the proposed Rowville rail line passes through three SLAs, with a total CBD commuter population of 4138. Allowing for catchments of other radial public transport lines in the SLAs, the CBD commuter catchment of the proposed Rowville line might be 2000-3000, or about 3 full trains. But of course a line would also be used for trips to other destinations (particularly Monash), and it would probably cause changes in travel patterns over time once built. I might look at this more in a future post. In the meantime you might want to read Alan Davies take, and a 2004 pre-feasibility study (here is a summary presentation).
- Wealthy Brighton is well serviced by the Sandringham line, but only half used public transport to get to the CBD. There is no easy freeway connecting Brighton and the CBD, so why are they driving? I’ll come back to that.
- The inner SLAs in Melbourne, Yarra and Port Phillip are slightly lower, probably due to a high rate of walking and cycling. More on that later too.
You can see a high PT mode share for the relatively small numbers of commuters from Geelong (around 800 in total). $4.3b is being spent on a regional rail link, that will separate regional trains from suburban trains. Regional trains from outside Melbourne seat less than 500 people, but because they run express through much of Melbourne they each consume probably around two all-stopping suburban train paths (which have a capacity of around 1000 each). I haven’t seen any debate about whether encouraging regional commuting by train into central Melbourne is worthwhile, though I’m sure people living in those areas appreciate the trains.
Next a map showing private transport mode share (red = higher):
Private transport mode share was highest for Manningham, northern Boroondara, Wyndham South (including Point Cook), Bayside, Rowville, and the outer northern fringes.
But a high car mode share may not be a huge issue if the number of car commuters is low. The next map shows the number of private transport commuter trips from each SLA, shaded by relative density:
Observations:
- Like we saw in my last post for South Melbourne, there were large numbers of car commuters coming from the inner suburbs, particularly to the south-east. These areas are well connected to the CBD by public transport, and also quite wealthy. Is wealth a driver of higher car mode share? Read on.
- Manningham west had a large number of car commuters (with a reasonable density). This area is entirely reliant on bus services, which have been upgraded considerably since 2006, with strong patronage growth resulting. In 2006, the last bus from the CBD on the Eastern Freeway – Doncaster Road route (307) was around 6:45pm. It’s now around midnight (on route 907 that replaced 307).
- There were also a large number from Wyndham north-east (Werribee – Hoppers Crossing area) which is not shaded dark on the map due to low average population density. In 2006, peak train services on the Werribee line were often 20 minutes apart, and bus services only ran every 40 minutes. The train frequency has since increased to 6/hour but the (feeder) bus frequencies are still 40 minutes in peak periods.
- Moonee Valley (Moonee Ponds-Essendon area) was a large contributor of cars, despite frequent trains and trams to the CBD. Not sure why that is, although Essendon is a relatively wealthy area.
Here is a another map of private transport commuters, except it is shaded by numbers rather than density. Manningham west stands out, but bear in mind it is one of the largest SLAs in Melbourne by population. You can see the outer western SLAs show up on this map also.
And for a flip side, here is where the public transport passengers were coming from (shaded by density):
There are large concentrations coming from the inner suburbs, but also the middle eastern suburbs which are well connected by trains. The Manningham west area had over 2000 public transport commuters to the CBD, many of which would have been on buses only.
Again, to get around the low population density problem, I’ve also drawn a similar map shaded by total numbers:
We saw low PT and car mode shares for the inner city. I haven’t drawn a map of walking mode share for the CBD but you can see public and private transport mode shares are low in the inner city, with walking likely to fill the gap. A map of walking mode share to any work destination is in another post.
The cycling figures are quite interesting. Next map shows the bicycle mode share to the CBD (any trip involving bicycle) (green=higher):
The figures are for Yarra north, Brunswick and Northcote are surprisingly high at 8-10%. Remember that the census is taken in winter (August). As I recall it wasn’t a rainy day. Bicycle mode share is also lower for commuters from the City of Melbourne itself. SLAs in grey lacked sufficient data.
Here are the total number of CBD bicycle commuters per SLA (shading by numbers, not density):
According to the data, people also rode from as far out as Frankston, Croydon, Ringwood and Sunbury! Census data is like that (as I recall, someone in Banyule claimed to have gone to work by ferry).
What modes did people use overall?
Here is a chart showing the overall mode split for all CBD workers:
Trains accounted for almost half of all CBD arrivals.
While buses accounted for only 2% of all CBD commuters, they were the only mode used by 32% in Manningham west, 11% in Kew, 9% in Camberwell north, 7% in Maribyrnong, and 5% in Altona.
Next chart shows mode split in a more simplified form:
Public Transport dominates, but still over a quarter came by car – including over 32,000 car drivers.
Public transport took 67% of motorised commuter trips into the CBD.
Active transport is at 8%, which probably represents those who live within walking distance of the CBD.
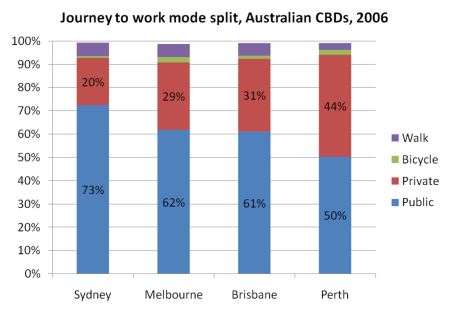
So how does Melbourne compare to other large Australian cities? The following chart compares Sydney, Brisbane, Perth and Melbourne CBDs. I’ve used the SLA that represents the inner core of business activity in each city to try to make in a reasonably fair comparison. Unfortunately Adelaide does not have a true inner CBD SLA to compare against (the central SLA includes all of North Adelaide, including lower density residential areas).
Sydney has the highest public transport mode share, with Melbourne and Brisbane very close (to my surprise). Perth is very much a car CBD, although mode shares are likely to have changed following the opening of the Mandurah rail line since 2006. The 2011 figures will be very interesting.
Perth walking more share was 3.0%, lower than 5.3-5.8% in the other cities – probably because of a lack of inner city residents.
And for the record, cycling was highest in Melbourne at 2.3%, followed by Perth at 2.0%, Brisbane at 1.5%, and Sydney at 0.8%.
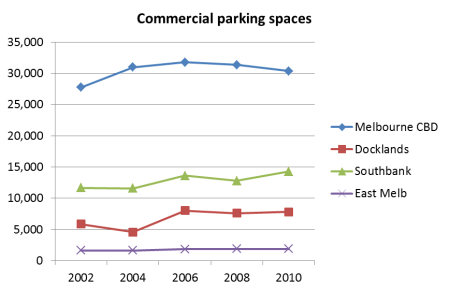
The number of car driver journeys to work in the Melbourne CBD actually decreased from 34,289 in 2001 to 30,570 in 2006, a mode share drop from 27% to 23% (ref). This happened despite a 20% increase in the number of parking spaces in the CBD between 2000 and 2006 (ref):
I’ve included Southbank and Docklands in this chart for interest – Southbank parking supply actually went down between 2006 and 2008.
[parking stats updated June 2012 with 2010 CLUE data:]
Looking at commercial parking spaces only:
The number of commercial parking spaces has actually declined in the CBD and there has been very little growth in Docklands (despite an increase in employment).
Here is the ratio of employees to commercial parking spaces:
While the ratios are flat in three of the areas, Docklands has seen strong growth in employment without equivalent growth in commercial car parking.
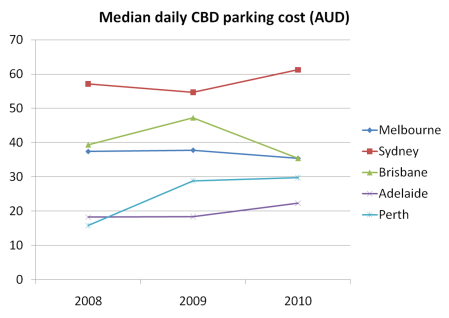
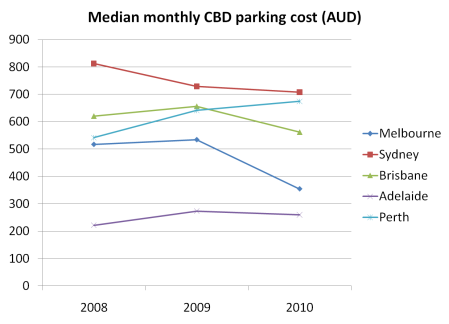
Colliers International have recently begun surveying CBD parking costs. Here are the results for Australia (adjusted to AUD using 1 July exchange rates):
I don’t pretend to be an expert in CBD parking markets, but the differences between daily and monthly rates suggest some complexity. In Melbourne at least, it is quite common to find “early bird” parking for $13-17 (and “early bird” usually means parking your car before 10am).
I’m perhaps more inclined to go on the monthly rates, as they are probably more competitive. Melbourne prices collapsed in 2010, at the same time that public transport patronage growth stalled. Prices also went down in all other cities except Perth (which had the strongest public transport growth of the major cities in 2009-10).
So is CBD parking price a driver of public transport patronage? Probably too early to tell because of a lack of much time series on parking cost data (including 2006 data), but worth looking at in future.
What modes are different commuters using?
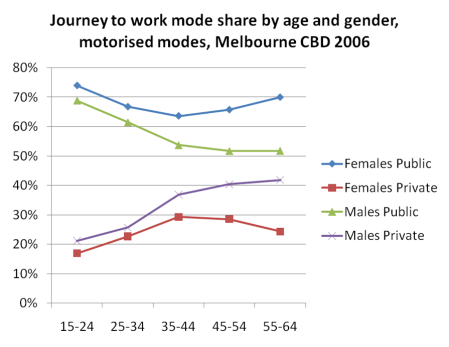
Firstly, mode share of motorised journeys by age and gender:
As you might expect, public transport mode share is higher amongst younger people and females. But for females it is also high for older women, with a curious dip at 35-44 years (typical kids at primary school years?). For men, private transport mode share was higher for older men. I’ve not shown 65-74 because the total number of such commuters was very small.
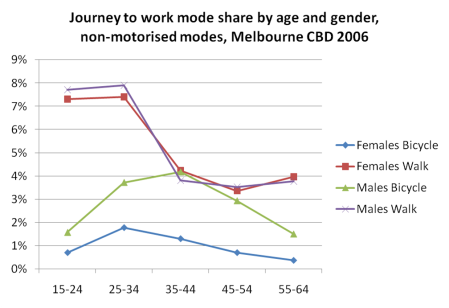
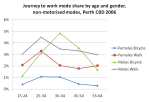
I’ve put non-motorised modes on a separate chart as they are much lower shares:
Walking was much higher for younger people. Is this because of lower car ownership, less willingness/ability to pay for transport, higher residential proximity to the CBD, and/or higher health and fitness focus? Unfortunately I don’t have the datasets to answer those questions.
Cycling mode share peaked with men aged 35-44, with men much more likely to cycle than women.
For reference, here is a demographic breakdown of CBD workers – it peaks at 25-34, with women slightly younger on average:
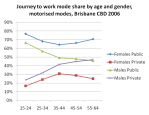
And here are the same charts for Brisbane:
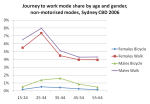
Sydney:
and Perth:
You can see:
- cycling mode share peaked for men aged 35-44 in all cities
- walking tended to peak for people aged 25-34
- public transport mode share dipped for women aged 35-44 in all cities
- In Perth, men aged over 35 had a higher private transport mode share than public transport, the only city where this occurred.
So, do executives (presumably many from wealthy inner city suburbs) shy away from using public transport?
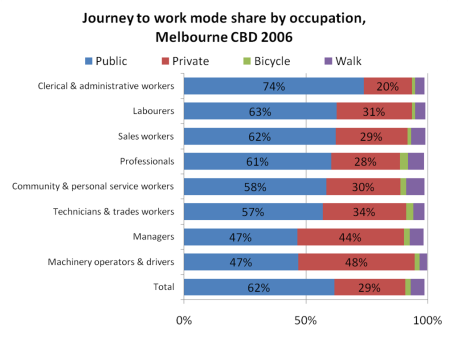
Indeed they do. They represented 16% of Melbourne CBD workers, but 24% of car commuters (9538 car trips in total). Maybe because many of them get company cars/parking as parts of their packages? More on that coming up.
Lower paid clerical and administrative workers were most likely to use public transport (and probably least able to afford driving and parking costs).
Note that Machinery operators & drivers also had a higher private transport mode share – I expect many are professional drivers coming in their work car (there were only around 1000 in this occupational category).
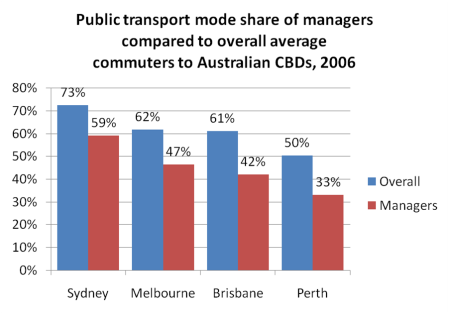
Back to managers – the next chart shows they are also more likely to snub public transport in Sydney, Brisbane and Perth:
What about other trip purposes?
The following charts show data from the VISTA 2007 household travel survey, that includes all trip types and all of Melbourne.VISTA is a survey, not a census, so there is a margin or error involved, and unfortunately the sample sizes are not large (provided in charts as “n=”). The total VISTA 2007 dataset has 2955 surveyed trips into the Melbourne CBD (across all days of the week), of which 1973 were motorised.
First chart shows mode split for trip legs into and out of the CBD, by time of day on weekdays:
Weekday AM peak is 7-9am, and PM peak is 3-6pm, anything else is classed as off-peak. Unfortunately there are only 190 trips in/out of the CBD on weekends in the sample, which has too large a margin of error to be too meaningful (7%).
Active transport (walking and cycling) and public transport were clearly dominant. When looking only at motorised trips, Public transport took 74% of inbound AM peak and outbound PM peak trips, and 67%/62% of off-peak in/out bound trips.
Recall above that motorised journeys to work in 2006 were 67% by public transport, suggesting people travelling for reasons other than work in peak periods were slightly more likely to use public transport.
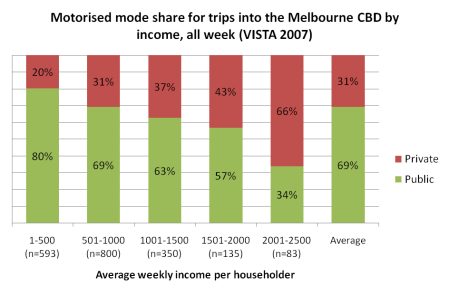
What about wealth? I’ve used average household income per occupant, to remove the impacts of household size, and grouped this by $500 amounts. Note: the sample sizes are quite small for larger income groups.
Sure enough, there appears to be a trend that people from higher income households were more likely to use private transport for travel into the CBD.
What about age?
While the sample sizes are relatively small, there certainly appears to have been a higher propensity to use private transport for travel to the CBD by middle-aged people.
There may be a trend back to public transport for older people, but the margin of error is around 10% for the last two age groups so this is not certain. However it would fit with Seniors being able to access cheaper public transport fares.
In terms of gender, 73% of females who used motorised transport came by public transport, compared to 67% of males – a similar difference to commuters.
Who’s paying for the private transport?
While for many people driving to the CBD for work everyday is something of a non-option, there are still tens of thousands who do. Is employer sponsored driving and parking costs influencing their mode choice?
VISTA lets us take a look at that also, although there is only a sample of 183 AM peak private transport trips (margin of error around 7%).
According to the data, around 29% of cars driven into the CBD in the AM peak had their running costs paid by a company, and 36% had parking paid for by employers. Remarkably, 34% reported no parking costs for off-street parking (these trips mostly for work purposes) – which doesn’t sound right for the CBD in the AM peak! I’m not aware of any publicly available free off-street parking spaces. Perhaps the respondents overlooked the fact that someone else was at least paying for the land on which they parked? If that is the case, then it would appear that less than a third of cars driven into the CBD in the AM peak were not employer subsidised in parking or running costs.
Employer subsidies appear to be an incentive to drive to the CBD. By contrast, only around 2% of general Melbourne AM peak car drivers had employee paid parking, and only around 13% had car running costs paid by an employer (VISTA 2007).
One of the most effective ways to reduce car mode share for journeys to work in the Melbourne CBD would appear to be reducing employer subsidies for parking and driving costs. Schemes such as parking cash out help employees see how much their parking and driving costs are being subsidised. If they have the option of receiving that money directly as salary they might make different choices (depending on tax treatment of course!).
That said, with current capacity issues on Melbourne’s trains and trams, trying to shift more CBD commuter trips from car to public transport in the short-term might not be a government priority just at the moment.
And lastly, for the record, 6 and 8 cylinder cars parked in the CBD did not appear to be over-represented. Cars of well-known luxury brands were over-represented (15% v 6% metro average).
I think that’s enough now! 🙂
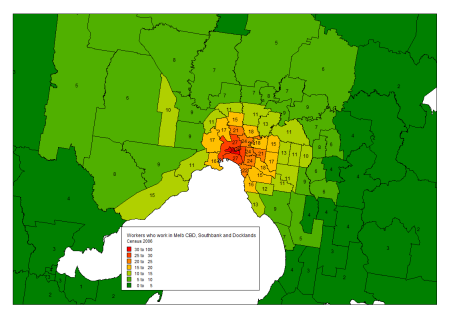
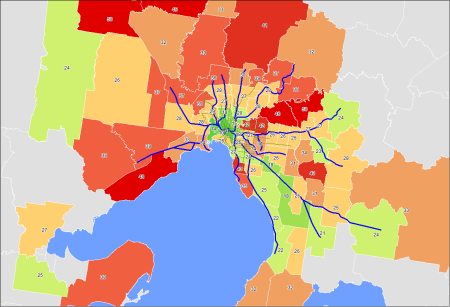
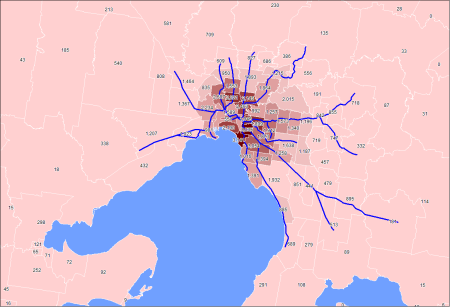
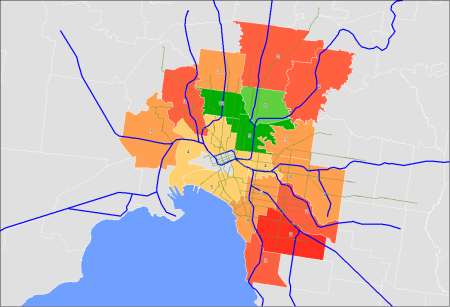
Active transport is at 8%, which probably represents those who live within walking distance of the CBD. In order to take out the walking component, I’ve also taken a sample that excludes an “inner ring” around the CBD, as shown in the following map:
If you take out the inner ring, the mode split is 69% PT, 28% car, 1.9% cycling and 1.4% walking longer distances.


















I hadn’t heard of Parking Cash Out schemes before. Interesting!
Thanks!
LikeLike
Chris, I’m not sure why you doubt people rode from Frankston et al. There are several hundred cyclists in Melbourne who regularly (3-4 times per week) do a 30-80km 6am training ride before work. A 40km commute in lieu of training is common for those riders (if not statistically). The most annoying census figure is the car-train one. A lot of car-train trips are in the train-only column (which should really be walking-train-?) which makes assessments of park-and-ride difficult.
Oh well. This is good work here.
A potential area of analysis, if you have time. If for any employment destination you were to define an area as “walkable” (100% within 2km declining to 0% at 7km), what is the percentage of walkable trips taken to each employment zone. That is, is it possible to identify areas of poor walkability (or distinct boundaries) in Melbourne? Can you extend that to walkability in proximity (500m-2km) to railway stations for CBD workers?
LikeLike
Don’t disagree with you on the bikes and park and riders.
With regards to your suggestion, the problem is the resolution of data. That analysis would require origins down to the Census Collection Distrct level (pretty much the smallest unit of around 400 households), with the employment destination being a collection of Destination Zones. When you get to such resolution you get a lot of 0s and 3s (as data is never reported as 1 or 2), and you wouldn’t be able to get meaningful mode split data. I suspect few employees of industrial areas would live within walking distance of work anyway, thanks to planning schemes that separate industrial and residential areas.
I have looked at walking (for transport) rates for each SLA using the VISTA (household travel survey) data. Short of creating another post, here is a map showing average minutes of walking/cycling for transport based on VISTA 2007 data.
LikeLike
Just a question:- what program do you use to create these maps?
Thanks
LikeLike
Brisurban,
I use MapInfo (a commercial product), but any half-decent GIS package would do the job.
LikeLike
Chris, great article. Wish I could produce maps that attractive with Mapinfo.
Can I ask for a supplementary map please which shows the absolute number of CBD commuters from each SLA? This would convey he link between the CBD and other parts of the metro area.
LikeLike
Hello, I’m not sure whether you are still monitering this article, but I would like to just ask what the green shading on the “What modes of transport do commuters use? (by area)” map is measuring exactly. Is this a measurement of use or of investment?
LikeLike
It is public transport mode share of journeys to work the the CBD.
LikeLike