[Last updated April 2016 with revised June 2015 population estimates. First posted April 2010]
How much is Melbourne sprawling, and how much is urban consolidation happening?
This post sheds some light by looking at ABS population data and dwelling approval data.
Note that this analysis uses local government areas (LGAs) within the Melbourne Statistical Division (although with all of the Shire of Yarra Ranges), rather than the new Greater Melbourne Statistical Area. ABS now publish annual population estimates at an SA2 level (essentially suburb level). I’ve had a look at this data and the trends are very similar to the results for LGAs, so I am continuing with LGAs for now in this post.
Population growth
The first chart shows net annual population growth by regions of Melbourne. “outer-growth” refers to the designated growth LGAs on the fringe of Melbourne, namely Wyndham, Melton, Hume, Whittlesea, Casey and Cardinia (see the end of this post for definitions of regions and note that the areas have different sizes and starting populations).
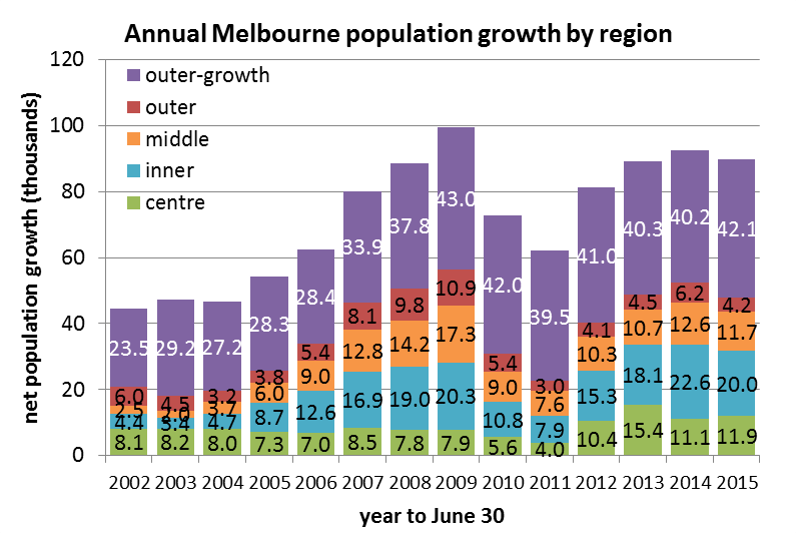
As you can see, Melbourne’s population growth accelerated in the years up to 2008-09, slowed down dramatically for a couple of years but has since bounced back to strong growth. The big slump in growth in 2010 and 2011 was largely a reduction in urban consolidation in established areas, while the outer-growth areas continued strongly.
There were an estimated net 89,856 new residents in 2014/15, an average of 1728 per week (annual growth rate of 2.1%).
The following chart shows how the growth was spread across Melbourne:
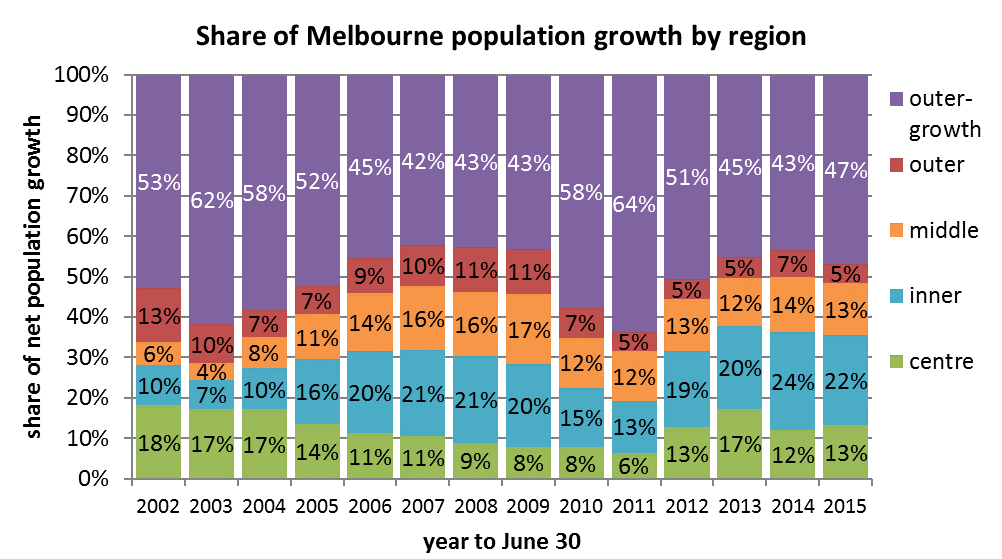
In 2009-10 there was a significant shift in the balance of growth towards the outer suburban designated growth areas as population growth in established areas slowed dramatically. However we appear to have reverted to the previous pattern, and now 47% of population growth is in the outer growth areas.
The following chart compares the estimated actual share of population growth in the outer-growth areas with the 2008, 2012 and 2014 Victorian Government’s “Victoria In Future” population projections (which DTPLI stresses are not targets or predictions).
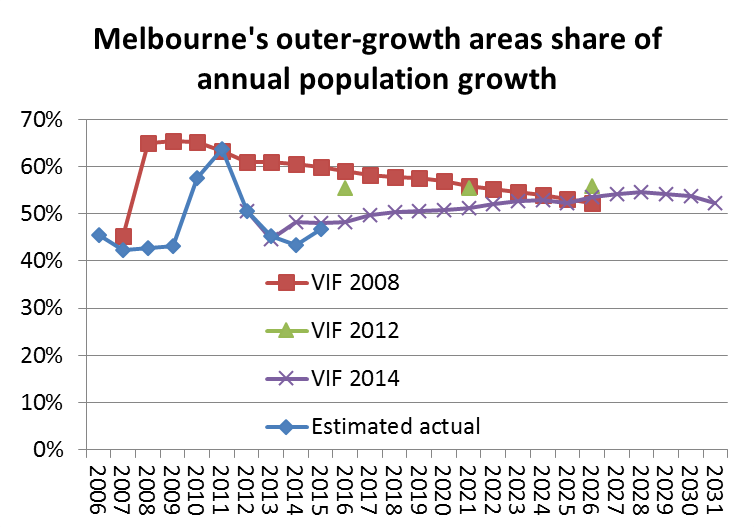
Apart from 2010-11, the share of population growth in the outer suburbs has been significantly below all projections, mostly because established area population growth has been much higher than projected. The 2008 projection was for the share of population growth in the outer-growth areas to decline slowly over time, the VIF 2012 projection was for the share to be steady around 55% for the next 15 years, while the new VIF 2014 forecast is for an increasing share in the outer growth areas, peaking in 2028. The 2015 estimated actual is closer to the VIF 2014 projection.
Note:
- these figures don’t include Mitchell which is now partly within the Melbourne Urban Growth Boundary.
- not all greenfields sites are in “outer growth” LGAs – smaller greenfields developments occur in established LGAs (eg Keysborough in Greater Dandenong).
If you’d like a more detailed idea about where changes in density is occurring see my posts showing changes in Melbourne density over time and a comparison of 2006 and 2011 at meshblock level.
Population growth compared to projections
The following chart shows the variations between the VIF 2008, 2012, and 2014, and estimated actual population for Melbourne:
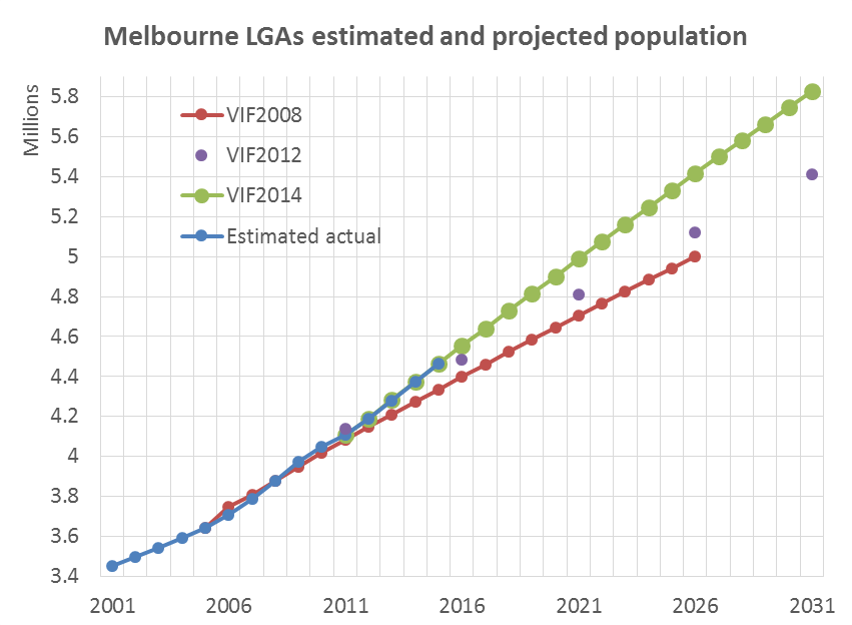
The 2015 estimated result is remarkably close to the VIF 2014 projection – out by only 1085 people or 0.024%!
The next charts shows the VIF2008 projected population growth 2007 to 2015, compared to the estimated actuals:
Actual population growth in the inner and middle suburbs was more than double the 2008 projections, growth in the centre and outer regions was above projections, whilst population growth in outer-growth areas was slightly less than projected. That’s a lot of urban infill that was not accurately foreseen in the 2008 projections (the VIF 2004 projections foresaw even less of the urban consolidation in established areas).
The VIF2014 projections for 2014-15 are much closer to the estimated actuals:
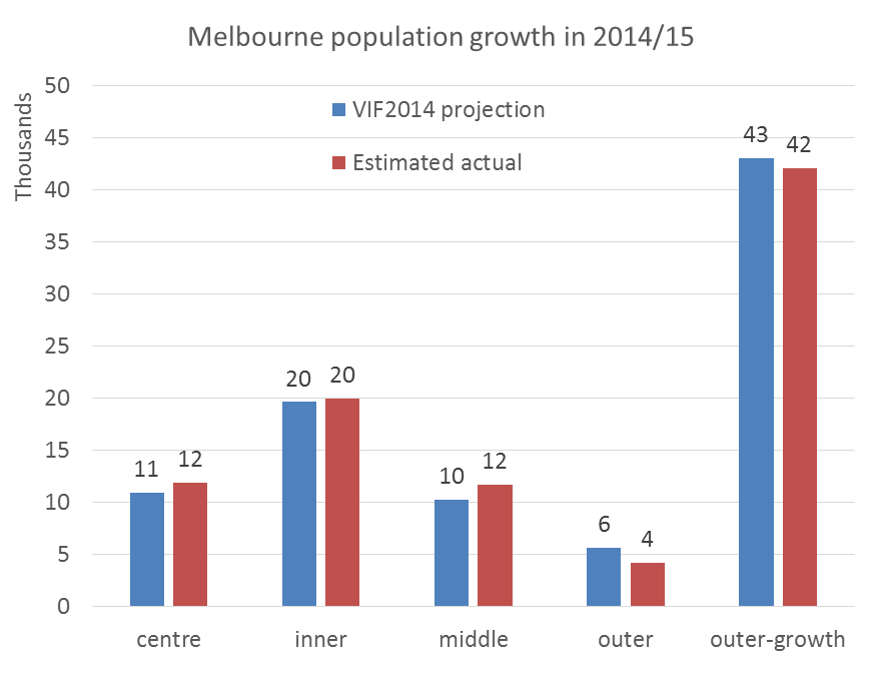
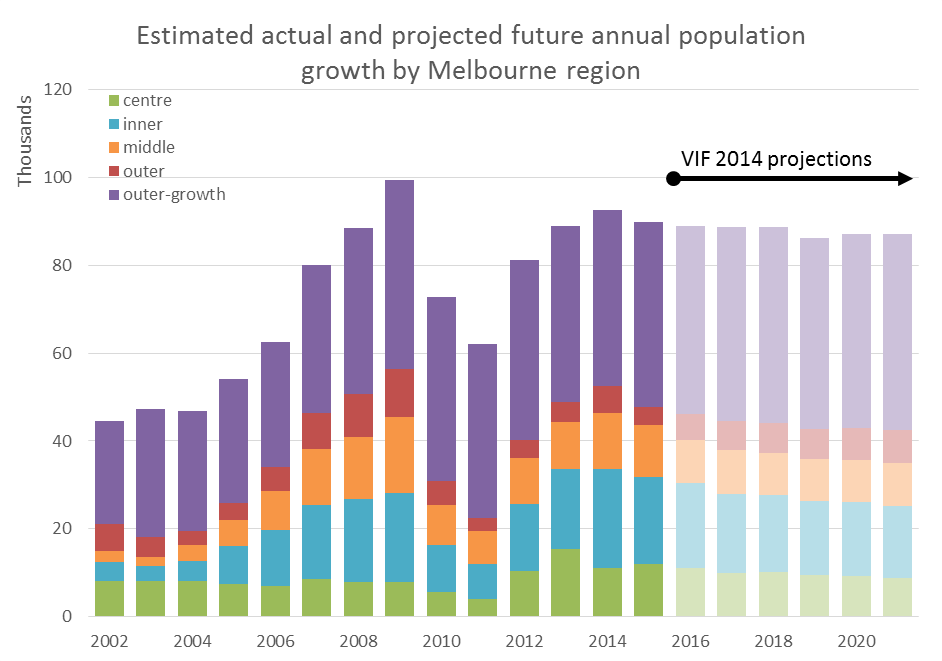
The next chart shows estimated actual annual population growth by region to 2014, along with VIF2014 projections for upcoming years:
Growth in dwellings
Two readily available dwelling-based datasets are dwelling approvals (data available to a fine geography level) and dwelling completions (unfortunately these area estimates available at state level only). There will always be a time lag between approval and completion, and many approved dwellings don’t end up getting built. The ratio of dwelling completions to dwelling approvals in Victoria for the last 15 years is 92%. Comparing the two datasets for whole of Victoria, I found a 12 month offset provides the strongest correlation between approvals and completions:
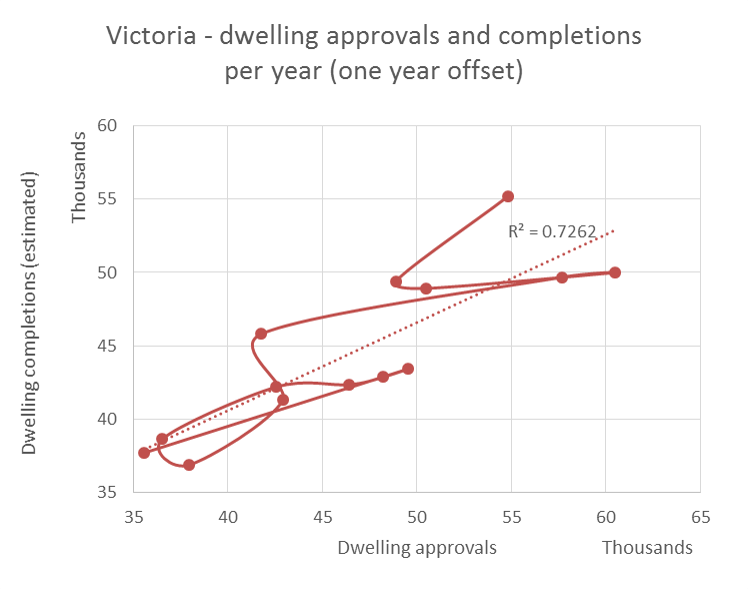
Further complicating the analysis, the RBA has estimated that around 15% of dwelling approvals replace demolished dwellings, and around 8% are second homes or holiday homes.
There isn’t a strong correlation between Melbourne dwelling approvals and Melbourne population growth either, but for the purposes of this post I’ll look at dwelling building approvals because that is the only data I can get in any geographic detail.
The following chart shows a recent acceleration in dwelling approvals across Melbourne, with 55,303 new dwellings approved in 2014/15, more than double the 2007 figure.
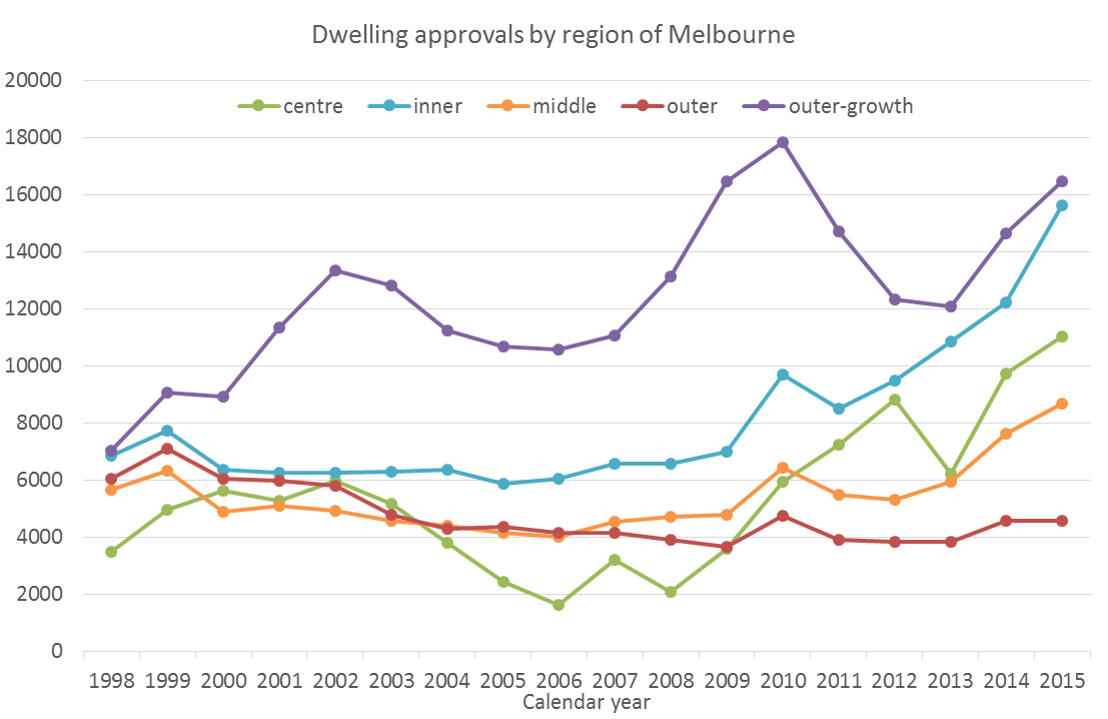
Of particular interest are the recent surges in approvals in central, inner and middle Melbourne. The number of dwelling approvals in “inner” Melbourne almost match the outer growth areas in number. If these dwellings actually get built and occupied, then perhaps we will see a surge in population growth in established areas.
Comparing dwelling and population growth
The following chart shows the ratio of population growth to dwelling approvals, which provides indicators of average household size. In 2008-09, there was one new dwelling approved for every 3.2 new residents, but this dropped to around one new dwelling for every 1.7-1.8 new residents in 2009-10 and 2010-11, thanks to a surge of dwelling approvals combined with slower population growth. From 2012 to 2014 population growth picked up relative to dwelling approvals, but the surge in dwelling approvals in 2015 has sent it down to 1.6.
The chart also shows the VIF 2008 projection of average household size (of occupied dwellings), the forecast ratio of population growth to dwelling growth, and the average household size based on census data for 2006 and 2011. The forecast was for slowly declining average household size (following a recent trend). The census-derived average household size in 2011 was 2.445 persons, essentially unchanged since 2006.
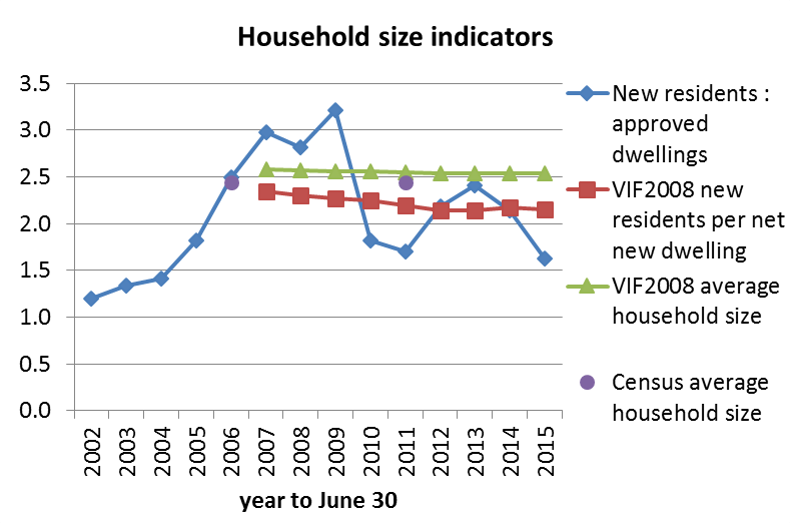
Curiously, the ratio of new residents to dwelling approvals was only 1.5 in the early parts of the decade, much lower than average household sizes. Does this reflect small dwelling sizes approved in those years, or maybe a large number of dwelling demolitions?
Measuring progress against the Melbourne 2030 urban consolidation target
Melbourne doesn’t have population targets for different regions, but there was a target for dwellings growth in the (now defunct) Melbourne 2030 strategy. It stated the aim to:
reduce the overall proportion of new dwellings in greenfield sites from the current figure of 38 per cent to 22 per cent by 2030
The greenfield sites in Melbourne 2030 were mostly (but not entirely) located in the designated growth areas. As “greenfields” dwelling approval data isn’t readily available, I have used dwelling approvals in the designated outer growth LGAs as a proxy (the stated figure of 38% appears to match the data for these LGAs)
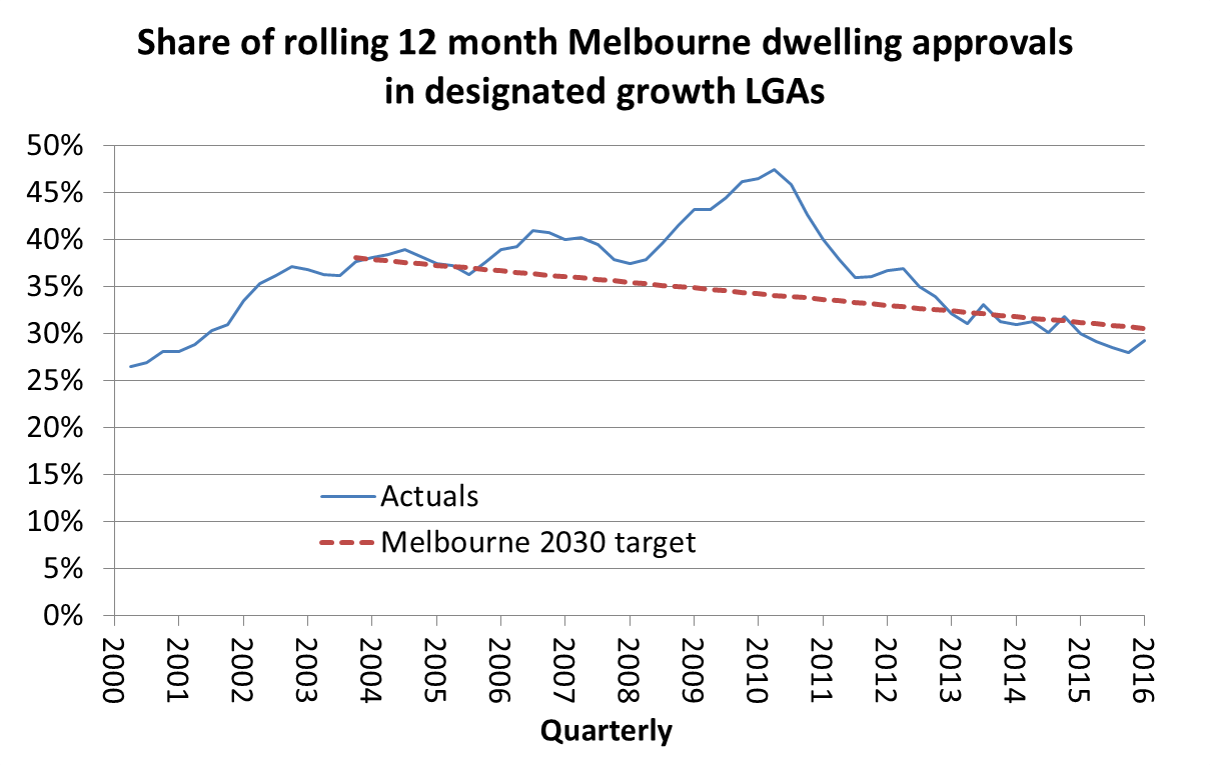
The dashed red line is a straight line interpolation of the Melbourne 2030 target for greenfields dwelling share. The outer growth LGA’s share of dwelling approvals had been higher than the target until the end of 2012, but has fluctuated a fair bit.
The 2012 Victoria in Future projections had around 48% of net new dwellings in Melbourne occurring in the outer-growth areas between 2011 and 2026, far higher than the old Melbourne 2030 target of 22%.
Now the 2014 Victoria in Future projections (released with the final version of Plan Melbourne) have around 45% of dwelling growth occurring in the outer growth areas between 2011 and 2031. The Plan Melbourne share of dwelling growth in the outer growth areas to the year 2051 is 39%, which suggests more urban consolidation between 2031 and 2051.
In reality, we seem to be tracking much closer to the original Melbourne 2030 target.
(Note: The outer-growth LGAs’ share early in the 2000s was much lower. This may reflect urban growth that was still occurring in areas I have classified as “outer” as opposed to “outer-growth” before the Melbourne 2030 plan was released in 2002.)
Appendix: Definitions of regions
I have allocated local government areas to regions as follows:
Centre = Melbourne, Yarra, Port Phillip
Inner = Hobsons Bay, Maribyrnong, Moonee Valley, Moreland, Darebin, Banyule, Boroondara, Stonnington, Glen Eira, Bayside
Middle = Brimbank, Manningham, Whitehorse, Monash, Kingston, Greater Dandenong (all but one in the east)
Outer = Nillumbik, Maroondah, Yarra Ranges, Knox, Frankston, Mornington Peninsular (all in the east and south-east)
Outer growth = Wyndham, Melton, Hume, Whittlesea, Casey, Cardinia

Here is a map of Melbourne with the regions shaded (dotted white area indicates within the 2006 urban growth boundary, sorry the colours don’t match exactly).

Here is a reference map for those unfamiliar with Melbourne LGAs. You’ll need to click to enlarge so you can read the text.


Hi Chris, good analysis as usual.
Those figures for dwelling approvals versus population growth are particularly interesting. Something’s going on here, though I’m sceptical that it really means household sizes are escalating rapidly and defying the trend established over decades. I think we need to consider a couple of alternative explanations:
1. The time lag between dwelling approval and dwelling construction. The change in the relative numbers pre- and post-2005 might partially reflect a surge in planning approvals prior to 2005, for dwellings that were only occupied later. (I seem to recall there was a severe labour shortage in the construction industry around that time.) It’s not unreasonable to expect that speculative property developers might obtain approval for dwellings in a low-growth period, then on-sell or hold the development sites until the market picks up.
2. Prior to 2005 there was actually a lot of underutilised real estate in established parts of Melbourne. Go back to 2004 and you can read stories about high vacancy rates for inner-city apartments, with landlords having to bribe tenants with movie tickets or car parking vouchers. Doubtless those same apartments are all occupied now. Similarly, a lot of middle suburbs established in the postwar era were seeing a population decline prior to 2005, which would have meant quite a few vacant houses. Lastly there’s the possibility that a lot of inner-city terrace houses being used as business premises have been at least partly converted back to residential use in response to rising rents.
Census data shows average household sizes in Melbourne declining steadily from nearly 2.7 in 1991 to just over 2.5 in 2006. So what your data appear to suggest is that dwelling approvals a decade ago were proceeding at a rate faster than actually required to accommodate the population (probably through a combination of speculative development and replacement of housing stock), but that now the two are moving together with population growth the main driver.
LikeLike
Hi Chris,
Great analysis.
I am not very familiar with Melbourne. Could you please explain how do you define established area?
Thank you!
Regards,
Grace
LikeLike
Hi Grace,
Thanks for the feedback.
By established areas, I mean any LGA that is not a designated outer metropolitan growth area (“Outer growth” in the lists of LGA at the end of the post).
I’ll try to update this post with a map showing designations for each LGA soon.
LikeLike
New map showing regions now added.
LikeLike