Following on from my previous post comparing the density of Australian and European cities, there has been some interest in the relative size of Australian and European cities. This post takes a quick look.
To make comparisons, I’ve taken the square kilometre population grid data for Europe and Australia, and summed the population and number of cells within the urban area/centre boundaries (as discussed in last post) that have at least 100 residents (ie 1 person per hectare or more) for each city. I’ve included this (arbitrary) threshold as some urban area boundaries seem to include some non-urban land. It means that I’m approximately measuring the populated areas of cities, and large parks, industrial areas, airports, etc may therefore be excluded in this analysis.
Here’s a chart of population versus populated area (click to enlarge):
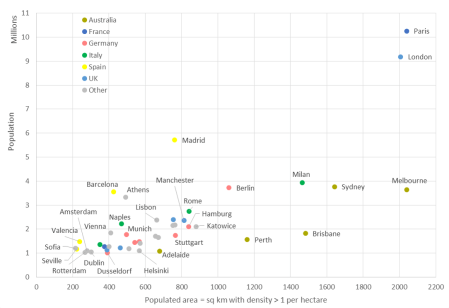
So Melbourne is about the same size as London and Paris but has less than half the population. Brisbane is a similar size to Milan, with half the population. Perth is larger than Berlin, but has around half the population. Adelaide has a similar population to Seville and Sofia, which are about a third the size. Sydney has a similar population as Barcelona but is almost four times larger.
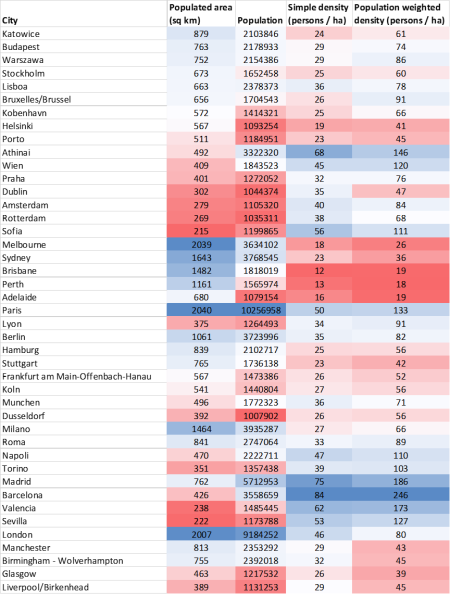
Because I couldn’t label all the cities in the chart above, here is a data table (smaller values in red, larger values in blue):
I’m hoping to add Canadian and US cities to my analysis soon.


We have also experinced social change; ie, Melbourne’s middle ring of suburbs had a population density of 60 in the 1960s, with our outter suburbs having a density of 20 today. At the same time we have gone from 4 cars for every 10 persons, to 7 (and close to eight in outter suburbs). Space for cars (roads, parking, and those bits left over from the former that you can’t do anything with, take 40% of or urban space and over 50% in outter suburbs. With these numbers we can see where traffic congestion emerges. Moreover, we actually consumer more land than we add as we expand – we see this is traffic congestion. It is geometrically impossible to build sufficient roads to reduce congestion. Demand or supply controls are the only option.
LikeLike
The use of boundaries is always going to be problematic because they don’t usually allow for the idea of catchments e.g. the size of cities defined by their labour sheds. In the absence of more detailed data, an alternative approach would be to map all the cells within a plausible commuting radius of the CBD.
LikeLike
Alan, there are definitions for European and Australian cities that define them by their labour market catchments: Greater Capital City Statistical Areas in Australia and Functional Urban Areas in Europe. They both include a lot of non-urban land, but comparisons are possible.
LikeLike
Thanks. They would be a useful basis for comparing cities. Weighting would de-emphasise the non-urban land.
LikeLike
As always, this is once again a very intersting comparison. There is one part of the math that I have been doing in my head and I wonder what number you have used for Perth and Berlin. In your data it looks like Perth and berlin are similar in size, but why does it always take forever to get anywhere in Perth? In Berlin, it took me 15-20 minutes for the 6 km to cycle from Uni to get home and I would go through about a 1/5th of the city including a lot of shops dozens of bus lines, three different train lines and about 12 stops along the way. Here in the inner-outer suburbs of Perth, it also takes me 15 minutes, but I do not pass a single shop, unless i make a detour and the one bus only goes once an hour outside the rush hour.
I grew up in Berlin and it would probably take about 45 to 50 minutes to cross the sity from east to west and a bit less from north to south for a fit cyclist. When I look at Perth, I am thinking of about 60+ minutes just to get from the coast to the hills. And when travelling along the freeway does Mandurah count as the Perth suburban area, since a lot of people travel from there to Perth for work on daily basis, or were does Perth oficially end these days?
I am aware that Berlin historically could never grew like other cities, but the difference for me is still very noticeable.
LikeLike
If you draw a circle encompassing the urbanised area of Berlin, it has a diameter of 66km. Urban Berlin a fairly round-ish blob, if I can call it that. If you do the same with Perth, the circle’s diameter is 118km (and yes, the ‘urban centre’ stretches as far as Mandurah). Perth is extremely elongated north-south along the coast.
LikeLike
I find this useful, (and appreciate your work overall) especially your rational concept of the populated area (rather than the incorrect LGA boundaries that many people erroneously use). I assume this means purely industrial areas with no residents are excluded?
Also, I’m curious as to why you use a population of 3.6 million for Melbourne, and 3.76m for Sydney, when the ABS (3218.0) for the Greater Capital City Statistical Areas has them at 4.44 million for Melbourne and 4.84 million for Sydney, as of June 2014 (If you exclude the Central Coast from Sydney’s metro area it would be around 4.51m) – Is it a different measure of the metro populations that you are using?
(I can understand how if you exclude non-contiguous population, you could take a few hundred k out of each metro population, but I’m not sure how that would remove 800k from each)
LikeLike
Yes, grid cells with no residents (and their area) are excluded from these calculations. The populations are lower because I’m using the Urban Centre boundaries which are a fair bit smaller than the Greater Capital City boundaries. Many of the satellite urban centres of cities are therefore excluded. I’ve also only included grid cells which have a centroid within the boundary of the urban centre – which means my population figures are around 2-3% lower than the official populations of these urban centres. It’s not perfect, but it gives you a feel.
LikeLike
thanks for your answer.
LikeLike
This is great. I’m wondering if you can do the population weighted density for the centers of Paris (proper), London (central), New York (Manhattan) and maybe even Barcelona? It’ll be interesting to compare them.
Looking forward to you adding US and Canadian metro areas. I wonder which metro areas you have selected for the analysis. I would presume you will focus less on the sprawling cities.
I’m looking at some American cities right now, the NYC and Hudson County vs LA comparison looks quite interesting when you compare the entire metro area (LA doesn’t seem to have the very low density areas NY metro does). The density maps should give a clearer picture here.
LikeLike
Would be great to see some superimposed cities if it is possible.
LikeLike
NICE !
howewer you should use urban areas or functional urban areas in Europe by eurostat (these are real urban areas)
and some cities in europe dont provide data about check in for example in Poland there is housing boom however cities population are stagnating because you dont have to check in the city . Thats how acutally 40% of Warsaw lives . AND actually there are like 11 urban areas in europe exceeding 5 milion (2 in russia) and 4 urban areas excluding Instanbul exceeding 10 milions.
LikeLike