You might want to read a more recent post on this topic published in 2019.
This post charts some key Australian transport trends based on the latest available official data estimates as at January 2017 (including the Bureau of Infrastructure, Transport, and Regional Economics 2016 Yearbook).
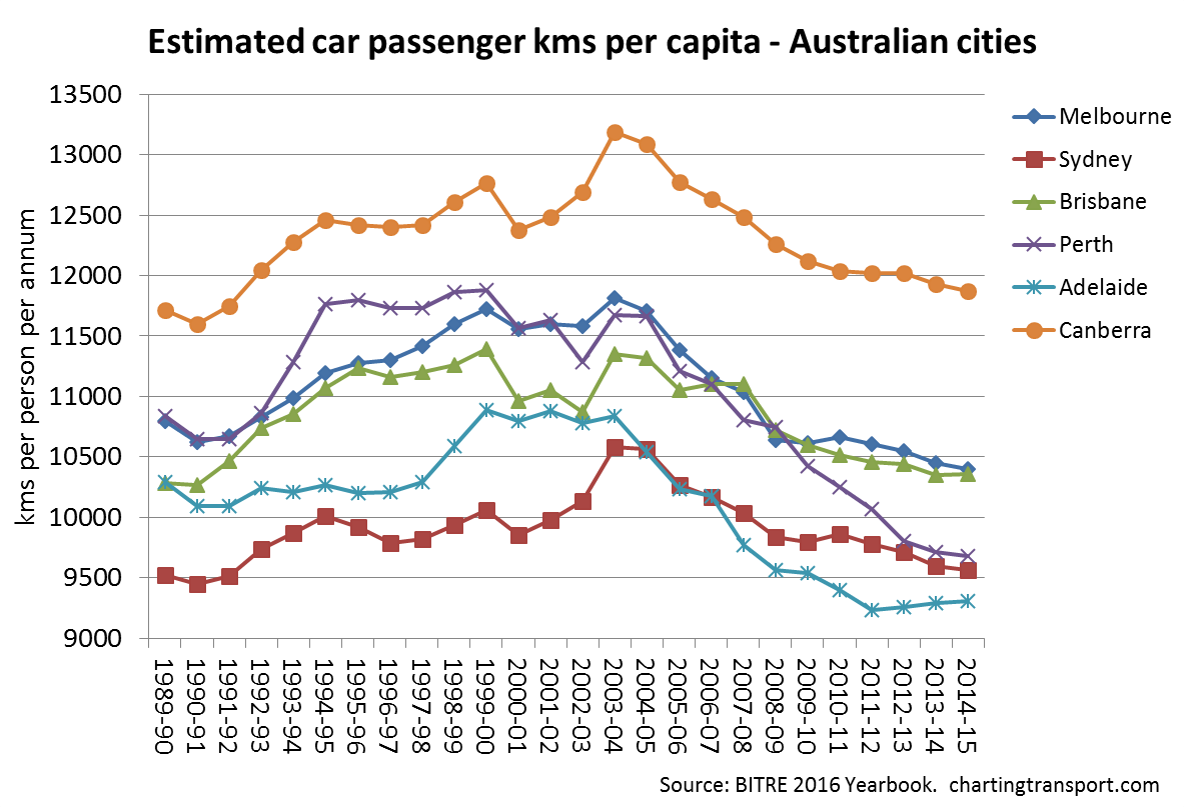
Car use per capita has continued to decline in most Australian cities (the exceptions being Adelaide and Brisbane, but still well down on the peak of 2004):
Mass transit’s share of motorised passenger kms was very slightly in decline in most cities in 2014-15 (the exceptions being Sydney and Adelaide)
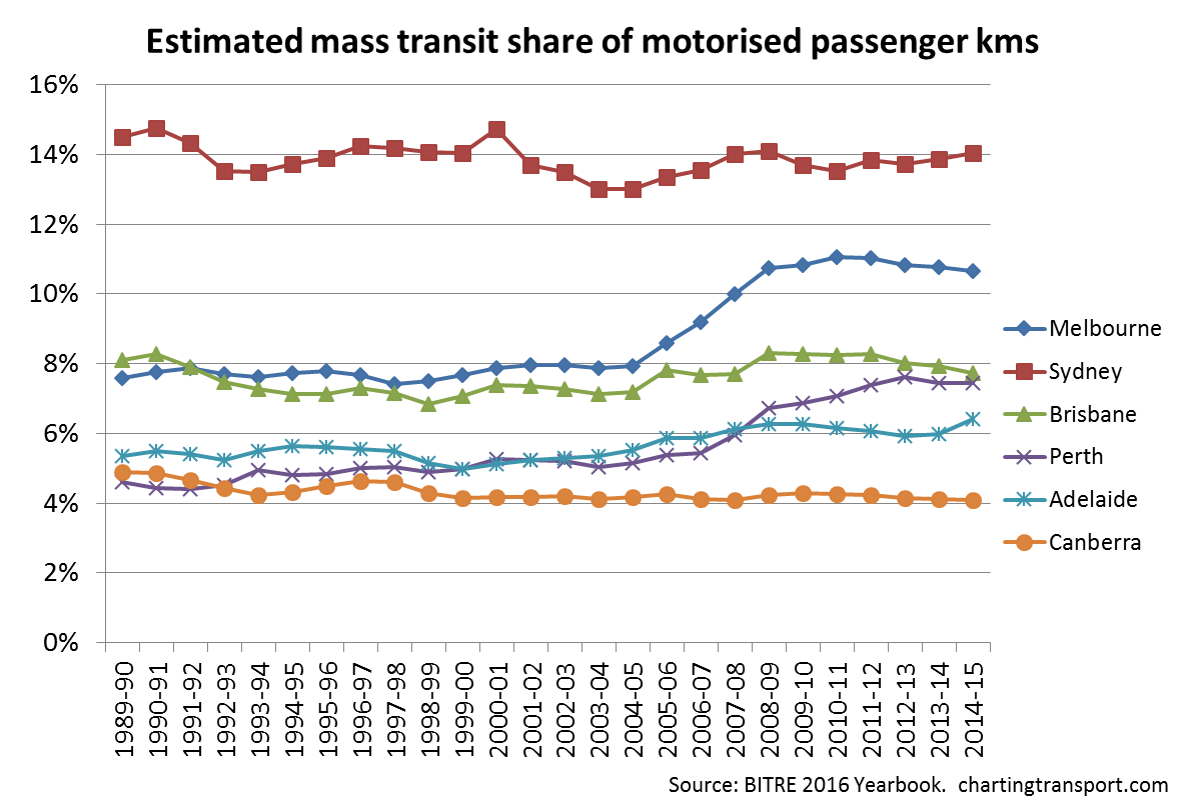
(note: “mass transit” includes trains, trams, ferries, and both public and private buses)
At the same time, estimated total vehicle kilometres in Australian cities has been increasing:

However, mass transit use has outpaced growth in car usage since 2003-04 across the five big cities:
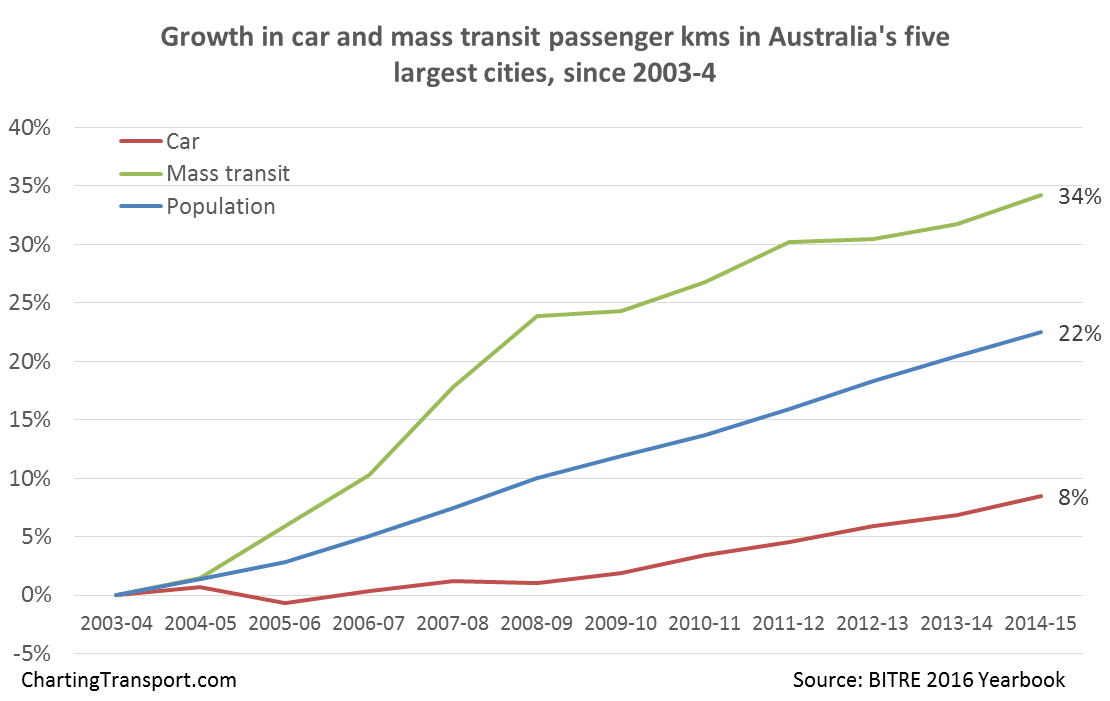
In terms of percentage annual growth, car use growth only exceeded mass transit in 2009-10, and 2012-13.
Car ownership has still been slowly increasing (note the Y axis scale):

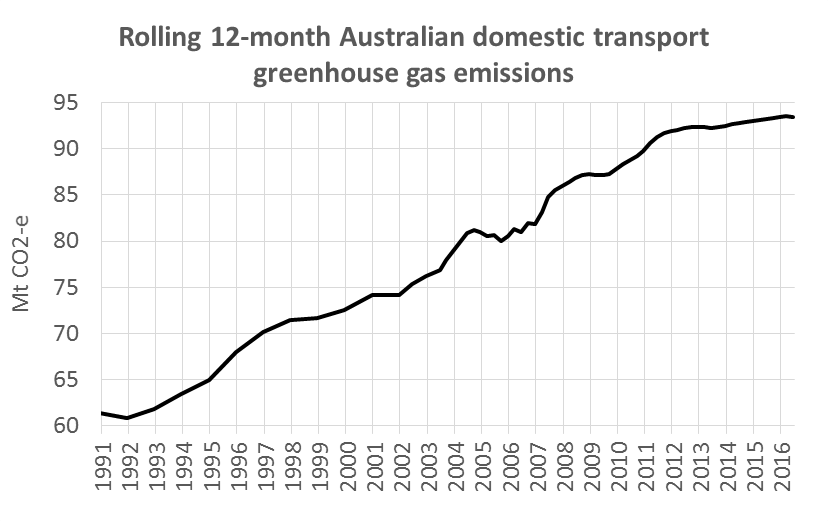
Australia’s domestic transport greenhouse gas emissions actually ever-so-slightly declined in 2015-16:
Here is driver licence ownership by age group for Australia:
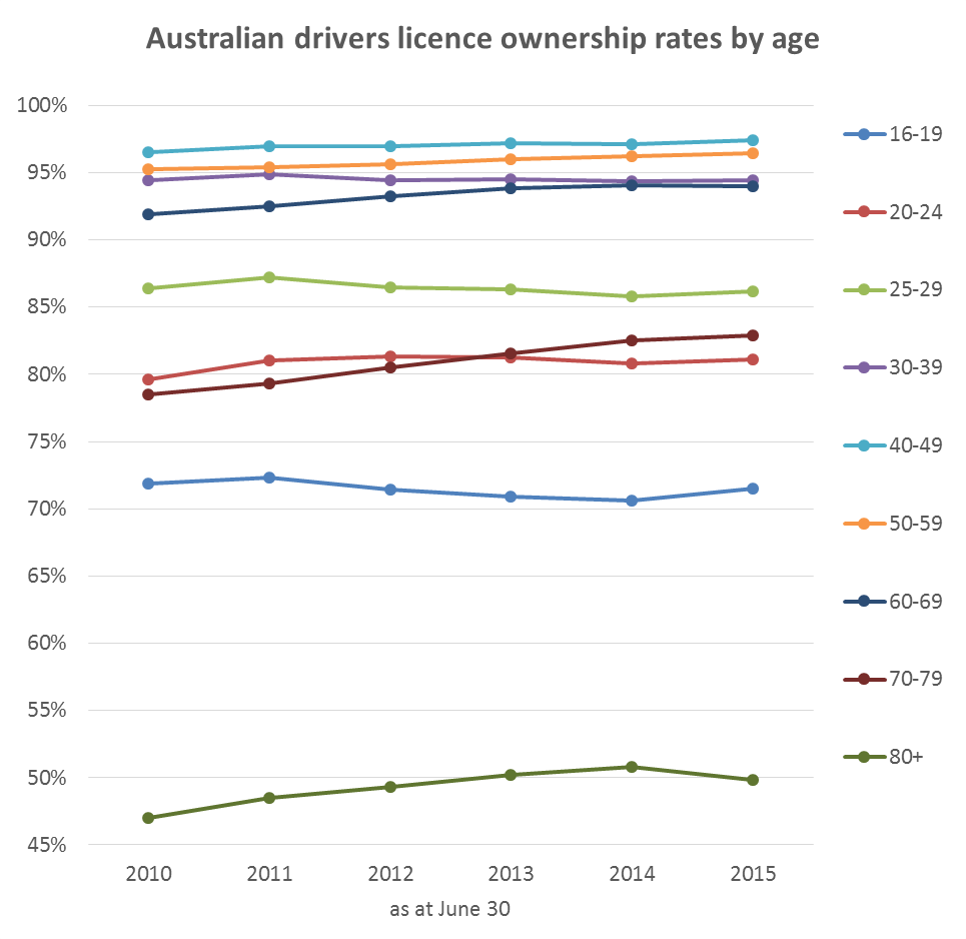
(note: the rate is calculated as the sum of car, motorbike and truck licenses – including learner and probationary licences, divided by population. Some people have more than one driver’s licence so it’s not a perfect measure)
From June 2014 to June 2015, license ownership rates increased in all age groups except 30-39, 60-69 and 80+.
2015 saw a change in the trend on licence ownership rates for teenagers, with a slight increase after four years of decline. However the trends are quite different in each state:
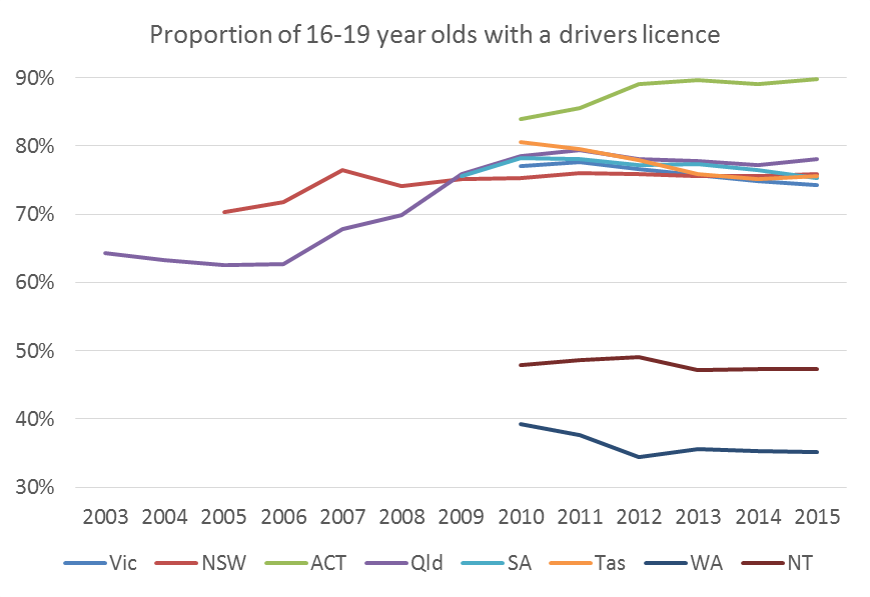
(note: in most states 16 is the age where people are able to obtain a learner’s permit)
I’m really not sure why Western Australia has such a low licence ownership rate compared to the other states (maybe the data doesn’t actually include learner permits).
And finally, here are licence ownership rates for people aged 20-24, showing quite different trends in different states:

I’ll aim to elaborate more on these trends in updates to subject-specific posts when I get time.


Surprised there isn’t more of a decline in 16 – 19 year olds with driver licenses.
LikeLike
My reading of the BITRE 2016 yearbook suggests that total domestic greenhouse gas emissions is 110,785 Mt in Table 9.9. This includes emissions from power from electric trains / trams, which is excluded in Table 9.4.
LikeLike
Hi,
Can you help me understand how GHG emissions are converted from Gigagrams to Mt?
In the “National Inventory by Economic Sector” the total emission for Transport sector is 26000 CO2e gigagrams whilst on the chart here it’s almost 92 Mt Co2e?
LikeLike
Hi Jason, if you use the main inventory you get 92 Mt for total transport emissions. You’ve looked at economic sector emissions. Not all transport emissions come from the transport sector of the economy. 1 Mt is 1000 gigagrams.
LikeLike
With km per capita falling (in part due to improvements in mass transit), but cars per capita continuing to trend upwards (call it a wealth effect) this implies km per car is falling. What might be the implications of this be if this continues?
LikeLike
If you want the numbers:
Couldn’t find any stats for certain years (2008,2009,2011,2014,2015) for KM travelled by cars on the ABS website. Based on observation, it looks like KM per car is falling as well.
LikeLike
Did you use data from the ABS Survey of Motor Vehicle Use? They aren’t ideal for time series analysis as they tend to bounce around a lot. Here’s some estimates based on BITRE estimates of passenger vehicle kms v motor vehicle census. I’ve added the “real” cost of motor vehicles (ie relative to CPI). Good chance that cheaper cars mean we own more, but use each one less (on average). Don’t get thrown by the different Y axis scales.

LikeLike
Yes I used ABS data. Primarily because BITRE does not have data on passenger car use by state
LikeLike
“I’m really not sure why Western Australia has such a low licence ownership rate compared to the other states…”
Perhaps it’s because of the higher proportion of indigenous teenagers in WA (and NT).
LikeLike
Hi Chris,
1 giga-gram = 1*10^9 grams = 1000 tonnes is it not?
The inventory reads 92,000 giga-grams so shouldn’t it read 92,000,000 tonnes?
LikeLike
Mt = million tonnes! For some reason, I kept thinking i read it as metric tonne. oops
LikeLike
Where are you getting the passenger car ownership by state statistics from? BITRE only has registered vehicles (which includes other modes) by state only
LikeLike
More detailed data is available from the ABS Motor Vehicle Census.
LikeLike
Why does NGGI not have data from 2014 onwards?
LikeLike
I am very shocked at how low the average km’s driven in Sydney is. When you consider how big of a geographic area it is (people driving from the southwest to employment centres in the northwest such as Norwest, Macquarie Park & Chatswood). I would have thought the sheer size of Sydney would have made this the obvious top spot but it seems Sydney is doing something right in terms of having jobs closer to where people actually live.
I would actually love to know where the trend downward from 2003 onwards has anything to do with petrol prices?
From an urban planning perspective, Perth is a sprawling nightmare & densifying the city will be very difficult. Sydney is quite literally decades ahead of Perth.
It is quite clear that in Sydney & Melbourne we should be moving to more mass transit as these cities populations skyrocket over the coming decades.
LikeLike