[fully revised 12 July 2020 with data up to 5 July 2020]
There has been talk about about a boom in cycling during the COVID-19 pandemic of 2020 (e.g. refer The Age), but has that happened across all parts the city, across lanes and paths, and on all days of the week?
About the data
In Melbourne there are bicycle counters on various popular bike paths and lanes around the city (mostly inner and middle suburbs), and so I thought it would be worth taking a look at the data. But I should stress that the patterns at these sites may or may not cycling patterns across Melbourne.
Here’s a map of the sites, including my classification of bike path sites into ‘recreational’ and ‘other’ (based on time of day demand profiles):
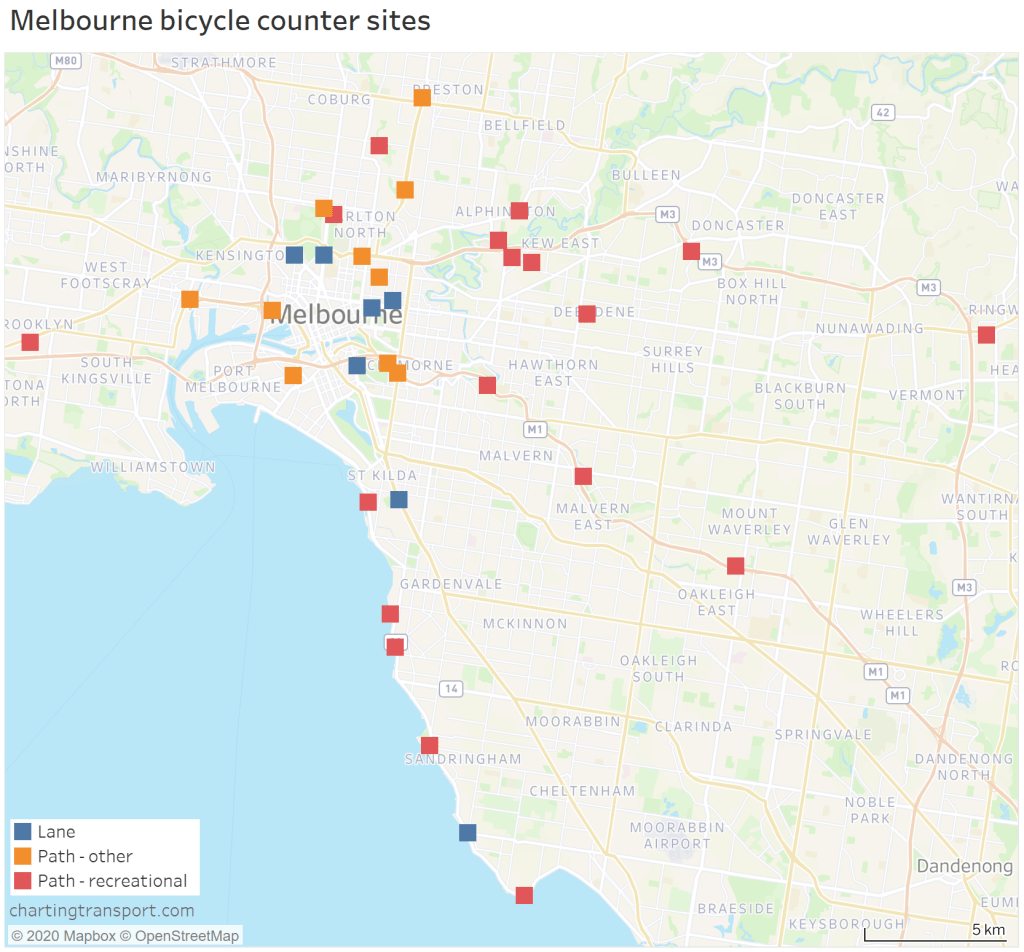
There’s also one bicycle counting site on Phillip Island, which I’m excluding this from this analysis as it is outside Melbourne.
But before plotting the data, it’s important to understand data quality. Since 2015 there have been 35 bicycle counting sites in Melbourne (most of them pairs counting travel in each direction). But for whatever reasons, data is not available at all sites for all days. Here is the daily number of sites reporting from January 2015 to 5 July 2020 (at least with data available as of 9 July 2020).
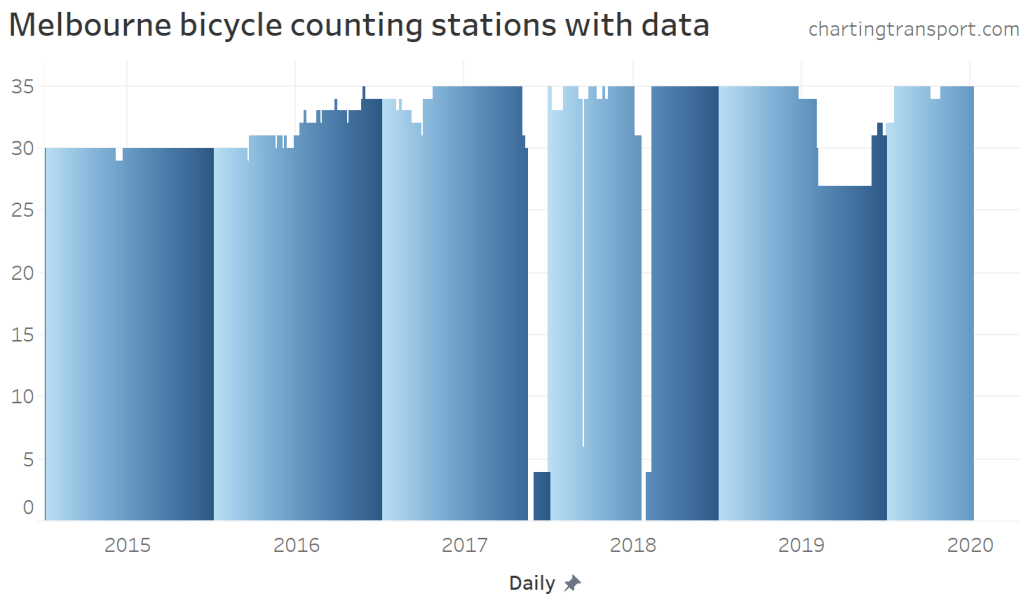
There are notable gaps in the data, including most of the latter part of November 2017, and around mid-2018.
So any year-on-year comparison needs to includes sites that were active in both years. For my first chart I’m going to filter for sites with complete data for 2019 (all) and 2020 (to 5 July). I’ve also filtered out a few sites with unusual data (very low counts for a period of time – possibly due to roadworks).
How do 2020 volumes compare to 2019?
Here is a chart showing average daily counts as a four week rolling average, dis-aggregated by whether the site was a bike lane (5 sites), recreational path (12 sites), or other path (9 sites) and whether the day was a regular weekday, or on a weekend/public holiday.

Weekday bike lane travel has reduced substantially, although in June the percentage reduction was less. This makes sense as most of these sites are on roads leading to the CBD, and most workers who normally work in the CBD have been working from home.
Volumes in bike lanes on weekends in 2020 have been very similar to 2019. This might reflect bike lanes not attracting additional recreational cyclists, or perhaps an increase in recreational cycling is offset by a decline in commuter cycling.
Volumes on recreational paths have been much higher than in 2019, most significantly on weekends. Again this makes sense, as people will be looking to exercise on weekends in place of other options no longer available (eg organised sports, gyms). In late June and early July, volumes did however reduce, perhaps as gyms reopened (22 June) and some sports resumed. This may change again during the second Melbourne lock down that commenced 9 July 2020.
Weekday traffic on paths not classified as recreational was down significantly in 2020. I’ll explore this more shortly.
How have volumes changed at different sites?
Here’s a look at the percentage change at each site on weekdays. I’m comparing weeks 14-19 of years 2020 and 2019 (33 sites have complete data for both periods). Weeks 14-19 mark the first four full weeks of the first full lock down.
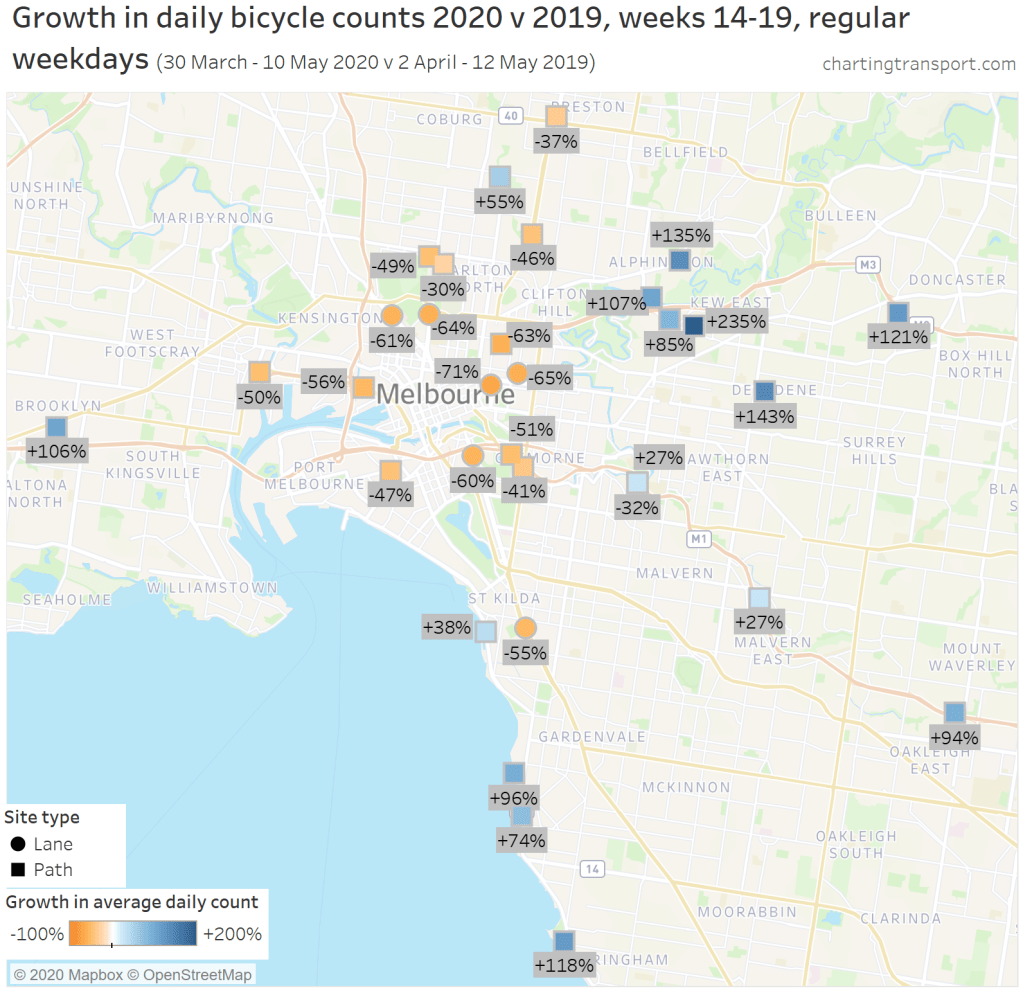
You can see significant reductions near the CBD, and on major commuter routes (lanes and paths). The biggest reduction was 71% on Albert Street in East Melbourne.
The blue squares are mostly recreational paths where there has been massive growth, the highest being the Anniversary trail in Kew at +235%! However I should point out that these growth figures are often off very low 2019 counts. It may be that people working from home (or who have lost their jobs) are now going for recreational rides on weekdays.
You might notice one square with two numbers attached – the +27% is for the Main Yarra Trail (more recreational), and the -32% is for the Gardiners Creek rail (probably more commuter orientated at that point). The two counters are very close together so the symbols overlap.
Here is the same again, but with the changes in average daily counts:
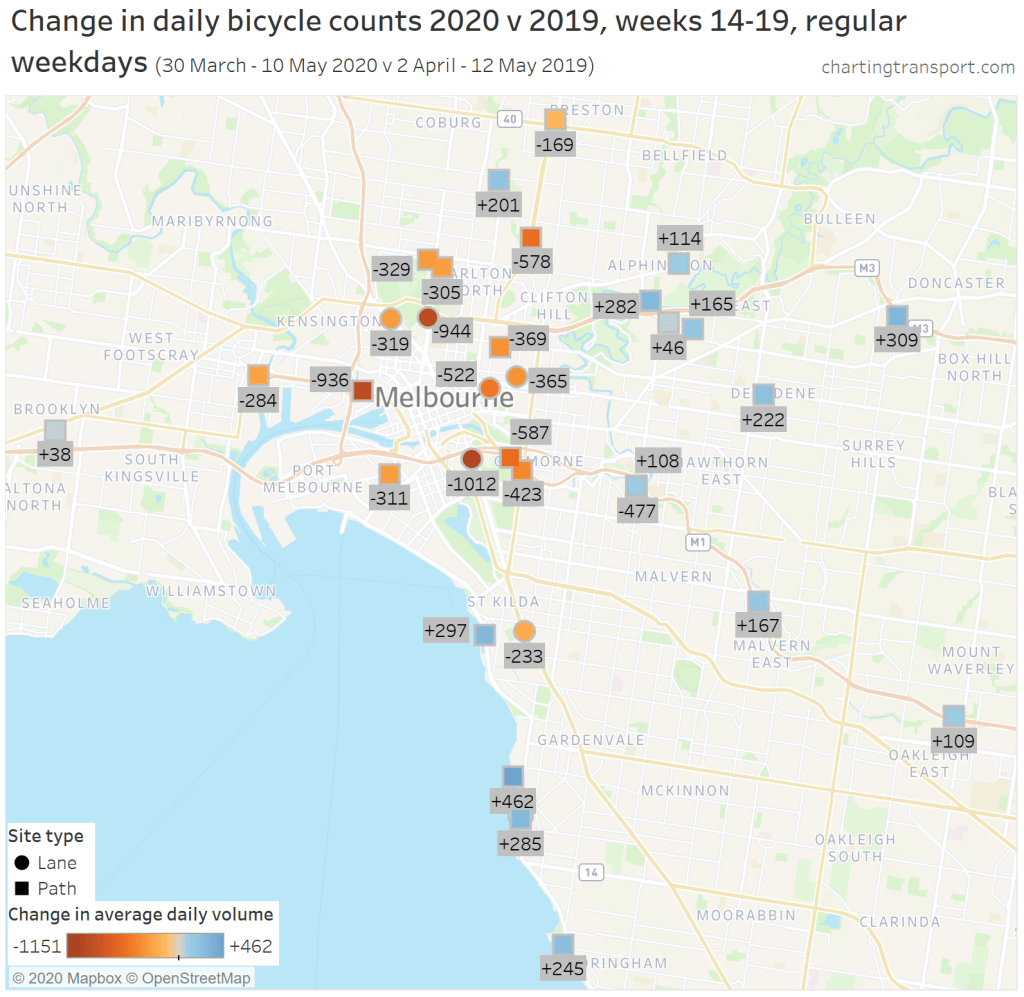
Many of the high growth percentages were not huge increases in actual volumes. The bay-side trail experienced some of the bigger volume increases.
On weekends and public holidays, there were smaller percentage reductions near the city centre, and large increases in the suburbs:
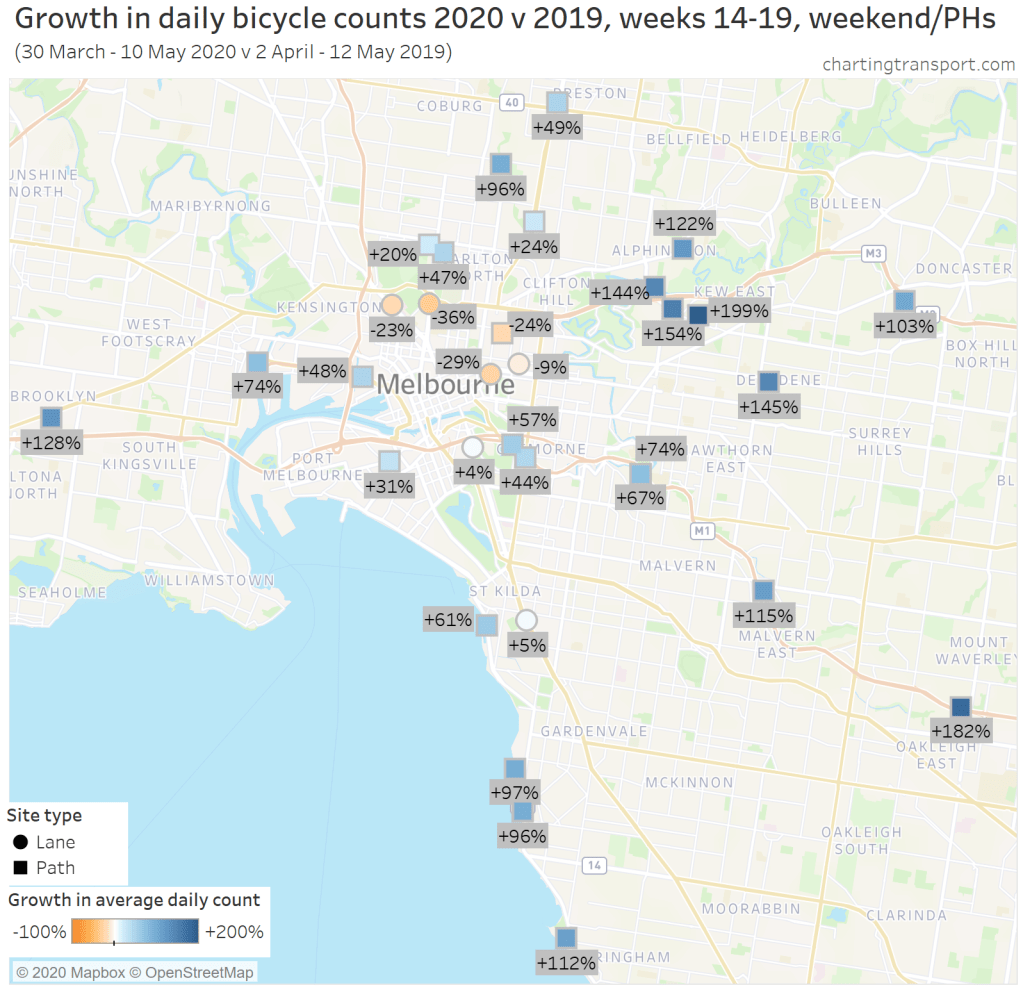
The percentage increases on weekends are not as high because there was a higher base in 2019. The reductions in the central city are smaller, but still significant – this may reflect fewer CBD weekend workers with a downturn in retail activity.
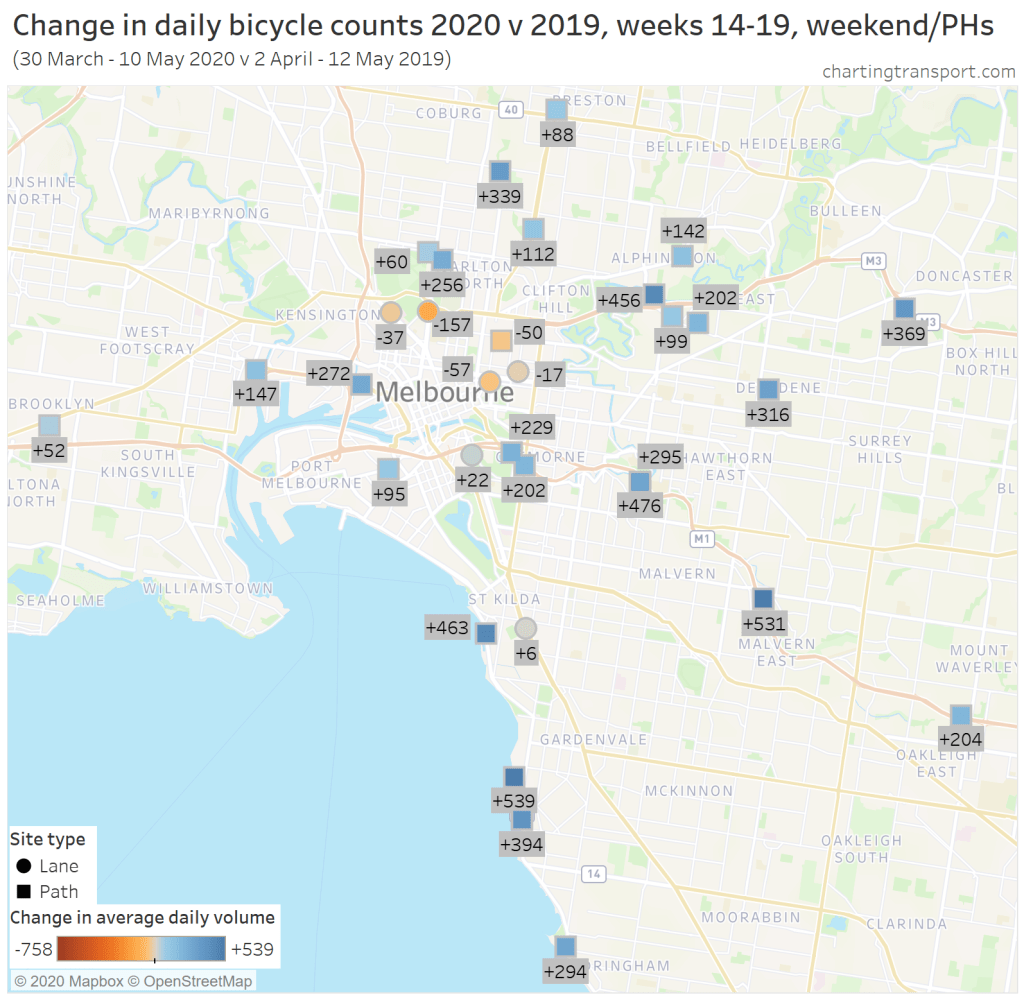
Again, here is a map of the changes in volume on weekends:
How have volumes changed by distance from the CBD?
Here’s another way to view the data – sites by distance from the CBD:
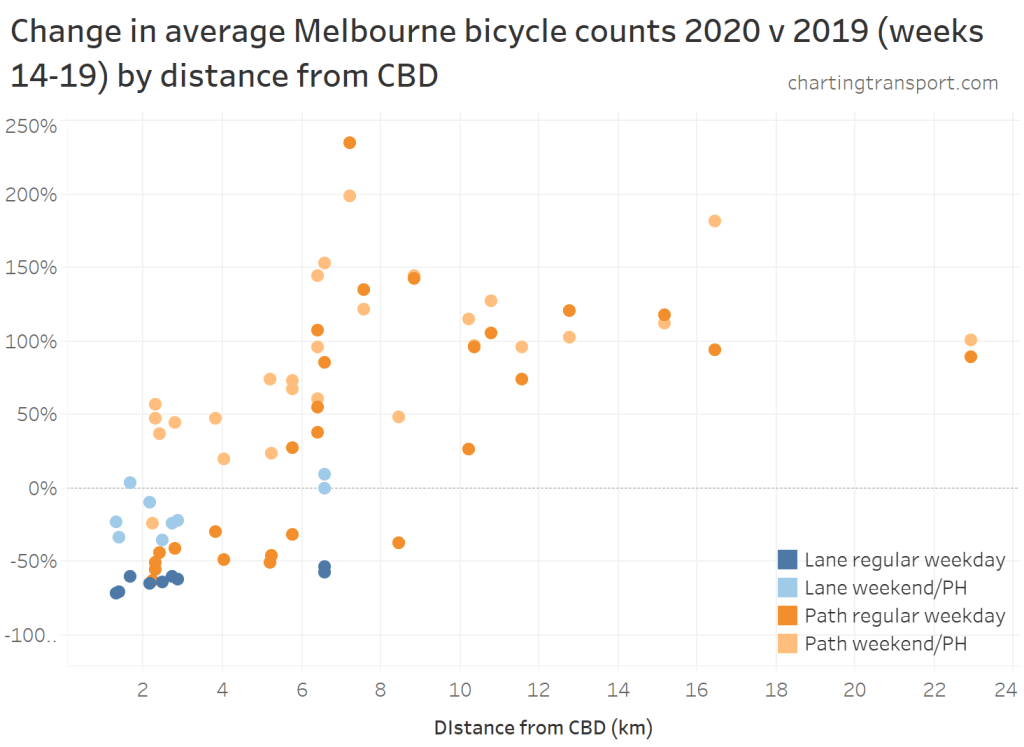
Bike lane volumes are down significantly at most sites, particularly on weekdays. Bike path volumes are down on weekdays at most sites within 6 km of the CBD, but up at sites further out, and up at most sites on weekends.
How have volumes changed by time of day?
I’m curious about the volume changes on paths on weekdays, so I’ve drilled down to hourly figures. Here are the relative volumes per hour for the months April – June:

Bicycle volumes are down in weekday peak periods on all site types, which you might expect as a lot of peak period cycling trips are to/from the central city.
Daytime bicycle volumes are significantly higher on recreational paths, and to a lesser extent on other paths. For the warmer months of April and May there was a recreational peak around 4pm, while in June the profile was more of a single hump across the day.
So the changes in volumes on paths are certainly a mix of reduced peak traffic, and increased off-peak traffic. The middle of the day increase is perhaps people breaking up the day when working from home, or people who are no longer working.
On weekends bike lane volumes are slightly up in the middle of the day, but down in the morning and evening. There’s been a substantial increase in bike path volumes on weekends – suggesting people seeking recreational riding opportunities on the weekend are choosing the much more pleasant bike path environments.
What will happen post COVID-19?
Of course this data only tells us about what’s been happening during the first lock down and the gradual recovery thereafter (until just before the second lock down).
It will be interesting to see if there is an uptick in recreational cycling during the second lock down period, although it is in mid-winter.
Eventually there may well be a boom in cycling (particularly on bike lanes) when more people start returning to work – particularly in the central city – and look for alternatives to (what might be) crowded public transport.
I’ll try to keep an eye on the data over time and update this post periodically.


The counters don’t measure Footpath traffic. They also don’t measure back streets – close to peoples homes. Most people are taking the kids around the block, going for a jog from home or a simple ride on their local streets which became more available as there were far fewer cars on them.
My strava Flybys are noticing the huge bump in the number of people on foot or bike when ever I leave the home for a workout…
LikeLike
Great analysis Chris – any increase is a win for public health for sure! Thanks for sharing your thoughtful work.
LikeLike
Hey Chris,
Great stuff, would love to see May and June follow up to get a better trendline, and see how that Path increase smooths out.
Cheers,
Nick
LikeLike