Since my first post looking at 2011 Melbourne residential density, there’s been a heap of new 2011 census data released. This post includes new maps showing Melbourne’s population density in maximum detail, as well as some more calculations of Melbourne’s urban/residential density for the density nerds.
Melbourne’s residential density in extremely high resolution
2011 population figures are now available for mesh blocks – the smallest ABS geographic unit. This allows a fine-grained look at 2011 residential density, and comparisons with 2006 as we now have a time series.
Here’s a very large animated map (4.7MB, 6825 x 4799 pixels) showing residential density at mesh block level for 2006 and 2011. You’ll need to click on it to download and see the animation (I’d suggest a new tab or window). Use your browser to zoom in and scroll around to areas of interest.
[update 10 July: It has been brought to my attention that some people are unable to view this map because they are restricted to using certain versions of Internet Explorer. If you cannot see the large map above, I have also created a smaller animated map showing only the inner areas of Melbourne]
You can see that new growth areas on the fringe actually have relatively high densities, contrary to conventional wisdom. I also note a relatively high and increasing density in the Springvale/Keysborough/Noble Park area, quite some distance from the CBD. If you look carefully you will also spot infill developments like Waverley Park, Parkville (ex-Commonwealth Games village), Gresswell Hill in Macleod, Docklands, Maidstone, Edgewater estate in Maribyrnong, along St Kilda Road, Waterways, and no doubt many more.
More values for the urban/residential density of Melbourne
Okay, you might want to stop reading here unless you have a deep interest in density calculation methodology.
Along with mesh blocks, the recently released census data provides boundaries for urban centres and localities, which each representing a relatively continuous urban area (including residential and non-residential land). There is an urban centre of “Melbourne” defined, which excludes the satellite urban centres of Pakenham, Melton, Sunbury, Healesville and towns along the Warburton Highway, but includes the major urban regions along the Mornington Peninsula to Portsea and Hastings.
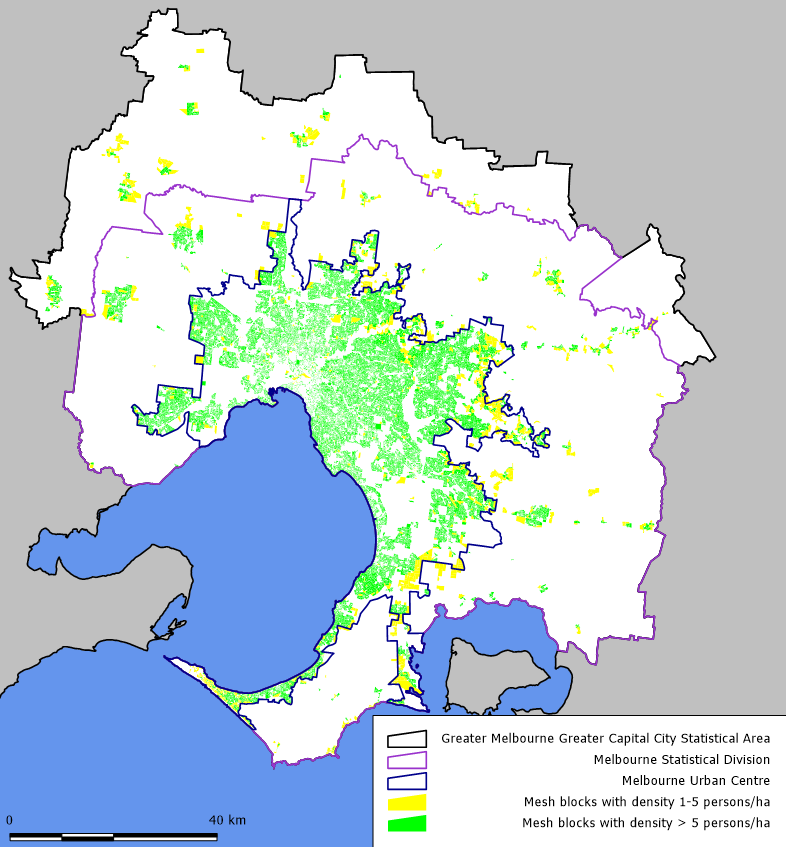
All this new data enables calculation of yet more values of the urban/residential density of Melbourne, adding to my previous list (some of which I have repeated for comparison purposes). The areas covered by each calculation are shown on the map below.
| Geography | Area (km2) |
Population | Average density (pop/ha) |
Areas on map below |
| “Greater Melbourne” Greater Capital City Statistical Area | 9990.5 | 3,999,982 | 4.0 | white + yellow + green |
| SA1s within Greater Melbourne with population density > 1 person/ha | 2211.4 | 3,903,450 | 17.7 | (not shown exactly, slightly less than yellow + green) |
| Mesh blocks within Greater Melbourne, with population density > 1 person/ha | 1713.1 | 3,913,215 | 22.8 | yellow + green |
| Mesh blocks within Greater Melbourne, with population density > 5 person/ha | 1348.5 | 3,824,999 | 28.4 | green |
| Melbourne urban centre | 2543.2 | 3,707,530 | 14.6 | all within blue boundary |
| Mesh blocks within Melbourne urban centre, with population density > 1 person/ha | 1443.8 | 3,696,316 | 25.6 | yellow + green within blue boundary |
| Mesh blocks within Melbourne urban centre, with population density > 5 person/ha | 1238.3 | 3,642,685 | 29.4 | green within blue boundary |
I note that the Melbourne urban centre is approximately a quarter of the area of “Greater Melbourne”.
Here’s a reference map of Melbourne showing the Greater Capital City Statistical Area, Statistical Division and Urban Centre boundaries of “Melbourne”, together with mesh blocks of above 1 and 5 persons/ha.
Finally, for the density nerds who are still reading this post, I have calculated the 2011 population-weighted density of Greater Melbourne using mesh blocks to be 42.8 persons/ha, which is much higher than the population-weighted density using SA1 geography of 31.8 persons/ha. It’s higher because more non-residential land parcels have been excluded from the overall calculation. If I restrict myself to mesh blocks within the Melbourne urban centre, the population-weighted density is only slightly higher at 45.1 persons/ha.
So if you want to compare population-weighted densities of different cities, you’ll need to make sure you are using equivalent geographic units, which I suspect would be very difficult for international comparisons. An attempt at Australian and Canadian city comparisons was made in the comments section of a previous post.
There you go. Next time someone claims to know the urban density of Melbourne, you can now argue with them for hours about whether you agree with their number and how it should be measured.


Omg that’s a new one: density nerds
Nice work
A
Sent from my iPad
LikeLike
Thank you Chris! I’d been meaning to do this exact calculation for years but never got around to marshalling all the CCDs (now mesh blocks).
What it shows is that the number you get for gross urban density over the metro area can be very sensitive to the way you draw the urban boundary. Subtle changes to the ABS methodology for defining Urban Centres over the years have led to a lot of undeveloped rural land being included within the ‘urban’ area, and hence to an underestimation of overall density in the true urbanised areas, where you want to put things like local bus networks.
Thus, if you do a naive calculation of gross density for Melbourne using successive Census figures for the population and land area of the ‘Urban Centre’, this appears to show a slight declining trend since the 1990s. Whereas in fact, infill development has made the established suburbs slightly more dense than before, while fringe development has occurred at slightly higher densities than in the 1970s and 1980s. The apparent decline in the naive figure is due to changes in methodology coupled with the blurring of boundaries between established areas like Frankston and Hastings, not to an actual reduction in overall density – quite the opposite.
That a lot of Melbourne’s outer suburbs actually have population densities similar to parts of the inner area was noted by the late Paul Mees in his PhD thesis and then in A Very Public Solution. And I’d always been impressed myself at how dense the Keysborough region has appeared in successive editions of the Melbourne Social Atlas. The key factor here of course is that household sizes are significantly larger on average in the outer suburbs than in the inner city.
LikeLike
A very interesting map. In places the effects of individual developments can be seen.
I would however suggest that the upper limit for colour distinction of 50 persons per hectare be raised so that the density differences of the more dense areas can be seen. This is particularly the case in the inner city. I think that the Melbourne Urban Centre population weighted density being in the current second highest band is evidence that their should be more bands for the higher density areas.
Areas consisting of mainly of flats, particularly if they are towers, have a higher density than the terraced areas or new outer suburban subdivisions.
It would also be interesting to see the median density based on mesh blocks.
LikeLike