Updated August 2026, with fatalities to July 2026, population to December 2025, vehicle kilometres to 2024-25.
Data sources:
- BITRE Australian Road Deaths database (updated monthly)
- BITRE Australian Infrastructure and Transport Statistics Yearbook (published annually)
- ABS State/territory population (updated quarterly)
Total deaths

NSW, Queensland, and SA appear to be trending up, while Victoria and the NT appear to be trending down.
Deaths by road user type

Technical Note: I’ve not distinguished between drivers and passengers for both vehicles and motorcycles.
Vehicle occupant fatalities were trending down until around 2020, but appear to be rising slowly again.
Motorcyclist fatalities appear to have peaked in 2024 and have come down a fraction since then.
Pedestrian fatalities were trending up until but appear to have flat-lined since 2025.
Cyclist fatalities dropped in the early 1990s (around the same time as the introduction of mandatory helmet laws) and have have been relatively flat since then (apart from a small peak in 2014). However they appear to be trending upwards in 2026.
Deaths per capita
It’s hard to compare total deaths between states with very different populations, so here are road deaths per capita, for rolling eight-quarter periods (I’m now using eight quarters to reduce noise, particularly for smaller states):

There is naturally more noise in this data for the smaller states and territories as the discrete number of deaths in these geographies is small (especially ACT, Tas, and NT).
The sparsely populated Northern Territory has a death rate more than double the rest of Australia – around 21% of which occur on road with a 130 km/h speed limit, and another 23% on roads with a speed limit of 110 km/h (last five years).
By contrast the almost entirely urban ACT has the lowest death rate per capita.
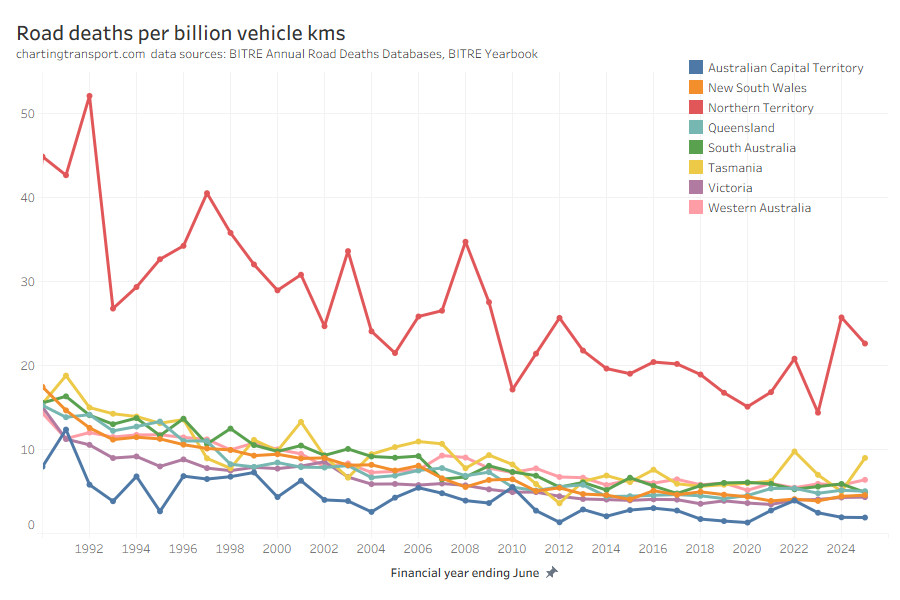
Deaths per vehicle kilometre
It’s possible to distinguish between motorcycles and other vehicles for both deaths and vehicle kilometres travelled, and the following chart shows the ratio of these across time. Note that I’ve had to use a log scale so you can see the trend details for other vehicles.
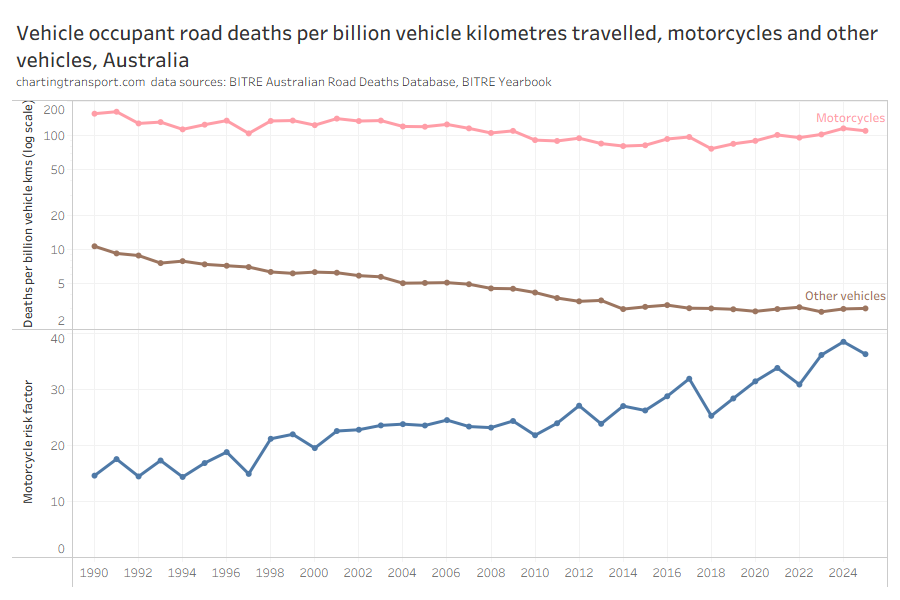
The death rate for motorcycle riders/passengers per motorcycle vehicle kilometre was 36 times higher than other motorised vehicle types in 2024-25 (motorcycle risk factor in the chart above). The death rate for motorcycles was trending down from 1991 to around 2015 but now appears to be trending up.
The better news is that the death rate for other vehicles has dropped from 9.8 in 1989-90 to 3 in 2024-25, although it has been relatively flat since around 2014, and of course we’d all aspire for these figures to be zero.
Deaths per capita by age, sex, and road user type
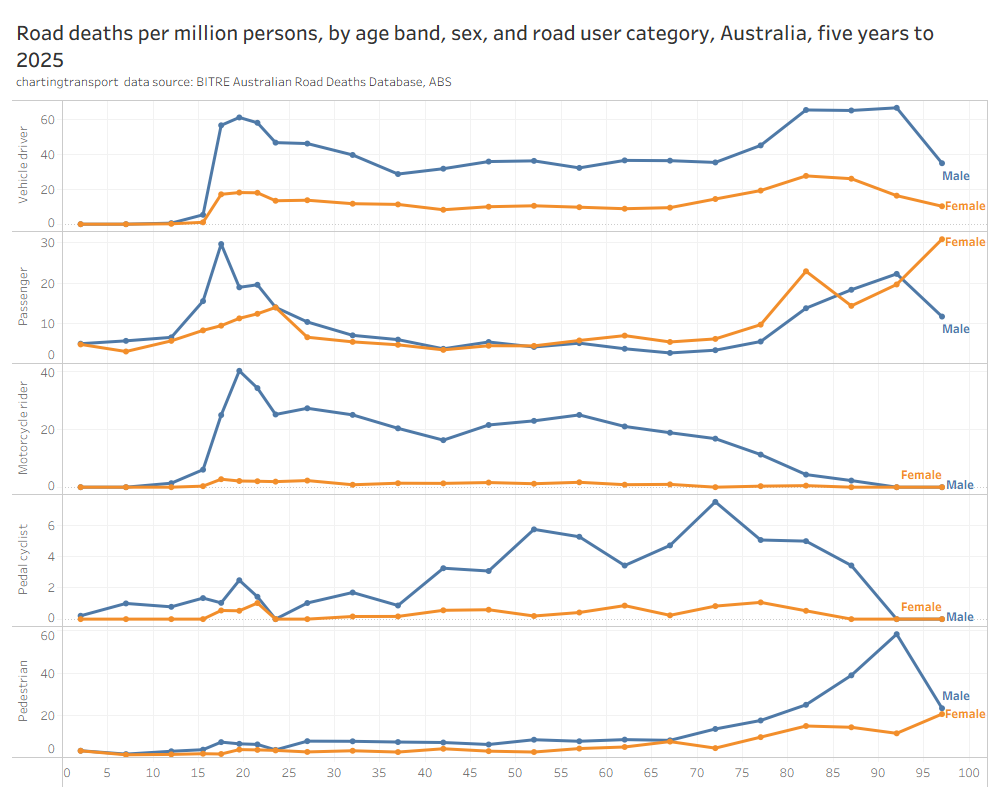
Over the last five years, males have been much more likely to die on the road than females in all road user categories except vehicle passenger. Vehicle driver and passenger deaths per capita have peaked for those around aged around 18 to 23, and then again for ages 80 to 95.
Curiously vehicle passenger deaths are relatively common for those aged 15-16 – perhaps as often they might be travelling with slightly older drivers?
Motorcycle deaths per capita were much higher for males than females (probably reflecting higher participation rates), and peak for 18-19 year olds, but remain high right up until males in their early 70s (again when participation rates probably drop).
Cyclist deaths per capita were highest for males aged 50-90 – but still quite low in the whole scheme of things. The peak deaths per capita figure – males aged 70-74 – involved 25 deaths across Australia over five years.
Pedestrian deaths per capita peaked for males aged 90-94, while older females also have higher deaths per capita, but not nearly as high as males. Are older males taking more risks walking around, walking more, and/or are they more vulnerable in crashes?
How has this varied over time? I need to turn to a matrix heatmap style chart to add the time dimension. This matrix is colour coded to show hot spots WITHIN each road user type over time and across sexes. You will probably need to click/tap to enlarge this table to be able to read it
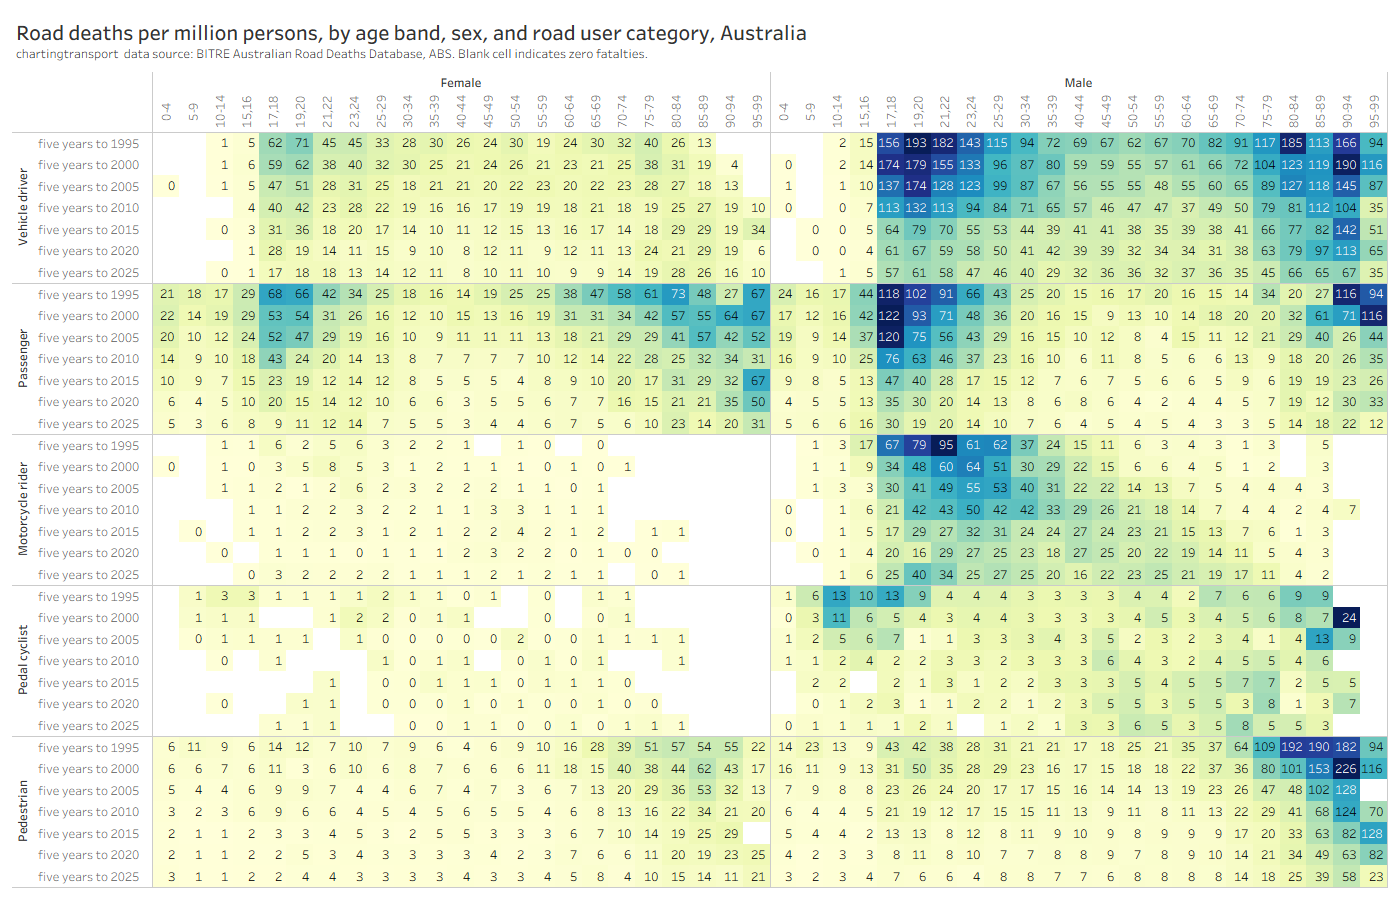
Thankfully there have been significant declines in road deaths per capita across most age groups in both genders, and for most road user types. The biggest falls in deaths per capita have been for:
- Young adult vehicle drivers
- Young adult vehicle passengers (perhaps due to graduated licensing scheme limiting young adult passengers?)
- Teenaged male cyclists (perhaps related to compulsory helmets – but perhaps also declining participation)
- Elderly pedestrians
- Young child vehicle passengers (presumably related to safer child restraints)
However there have been increases in deaths per capita over time for males on motorcycles aged around 35 to 79. Deaths per capita for younger adult males have also started increasing in the last five years, after big declines since the late 1980s.
Are motorcycle deaths up because more people are riding?
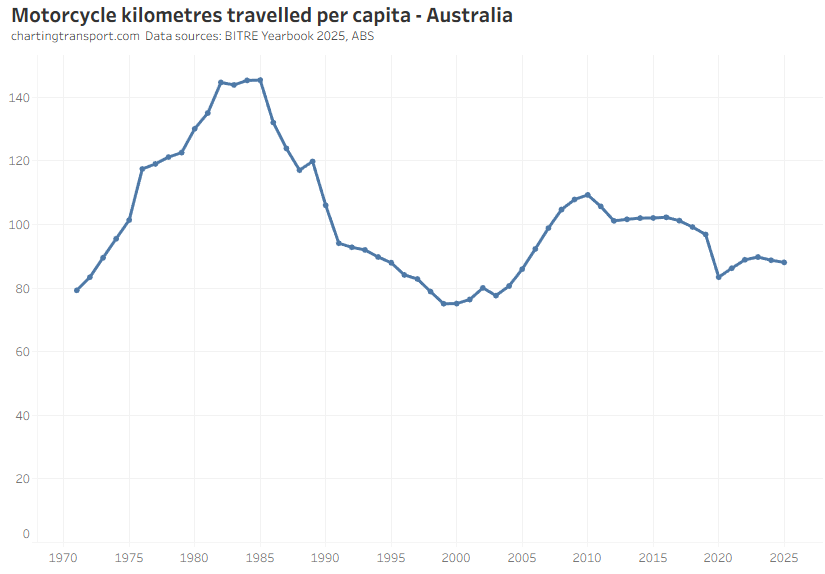
No, estimated motorcycle kilometres travelled per capita had a peak in 2010 and has been mostly in decline since then. It appears motorcycle riding has become more dangerous in recent years.
I’m hoping BITRE might collate and publish data around motorcycle licence holders by age and gender in future yearbooks, so we can compare deaths to the number of licenced riders. As we saw above, deaths per motorcycle kilometre travelled was trending down until around 2018 but has since been trending up.
Lastly, it’s hard not to be curious about five reported deaths of babies (aged 0) driving vehicles, and a three year old girl riding a motorcycle in 1999. Presumably inaccurate recording of age data.
Deaths by speed limit
The following chart shows the distribution of speed limits involved in road deaths over time, by road user category. You might want to click/tap to enlarge this chart.

Some observations:
- Around 50-60% of vehicle occupant deaths occurred in environments with a speed limit of 100+
- A large share of pedestrian deaths occurred on roads with a 50 or 60 km/h speed limit
- Almost half of cyclist deaths occurred in environments with speed limits of 70+ km/h (more so in Victoria)
Deaths by time of week
The following chart summarises deaths by hour of the week from the last twenty years across Australia, split by road user groupings. The cells are coloured relative to the hour of the week with the highest deaths by road user grouping.

Observations:
- Motorcycle deaths have been most common on weekends during the day (presumably largely recreational riding), but also somewhat common on Friday nights.
- Cyclist deaths have been more common in the AM peak and weekend mornings (Sundays an hour later than Saturdays).
- Pedestrian deaths have been most common in the early evening on weekdays, plus late Friday/Saturday nights.
- Vehicle occupant deaths have been more even across the week, but with hot spots in the afternoon (worst on Friday afternoons), as well as Friday/Saturday nights (more so in the hours after midnight early on Saturdays).


