It’s now much easier to find the latest key transport and city trends on Charting Transport. A new “Trends” menu item links to 13+ pages covering a range of key transport and city-related metrics (for Australia and sometimes also New Zealand). The pages cover passenger and freight mode shares, public transport patronage, city density, car and driver’s licence ownership, emissions, road deaths, and more.
I will endeavour to keep these pages updated as new data is released – which is mostly annually, but for sources that update monthly I will probably update the pages a few times a year (depending on the level of interest).
These pages will generally focus on the most useful summary charts, which will make it easier for me to update them relatively quickly. I’ll still be writing deeper once-off analysis on various topics, and I’ve included links from the Trends pages to these related blog posts.
This new approach also helps where I’m joining disparate data sources that update at different times of the year. For example, each December BITRE publish their Infrastructure and Transport Statistics Yearbook with lots of volume data, but I have to wait until March for ABS Regional Population data to extend per-capita metrics. Now I can update the volume charts in December, and the per-capita charts in March.
Often I find the addition of more recent data for a metric is not interesting enough to justify a new a blog post, but I’d still like it to be available to my readers. It doesn’t make sense to sit on this data waiting for an excuse to publish a new post, and now I won’t need to.
But if there are interesting new trends emerging, I will push out new blog posts (probably quite short ones with selected charts only) so my subscribers are alerted. If you are not already subscribed you can do that here:
Indeed, here are some…
Interesting trends from recently updated data
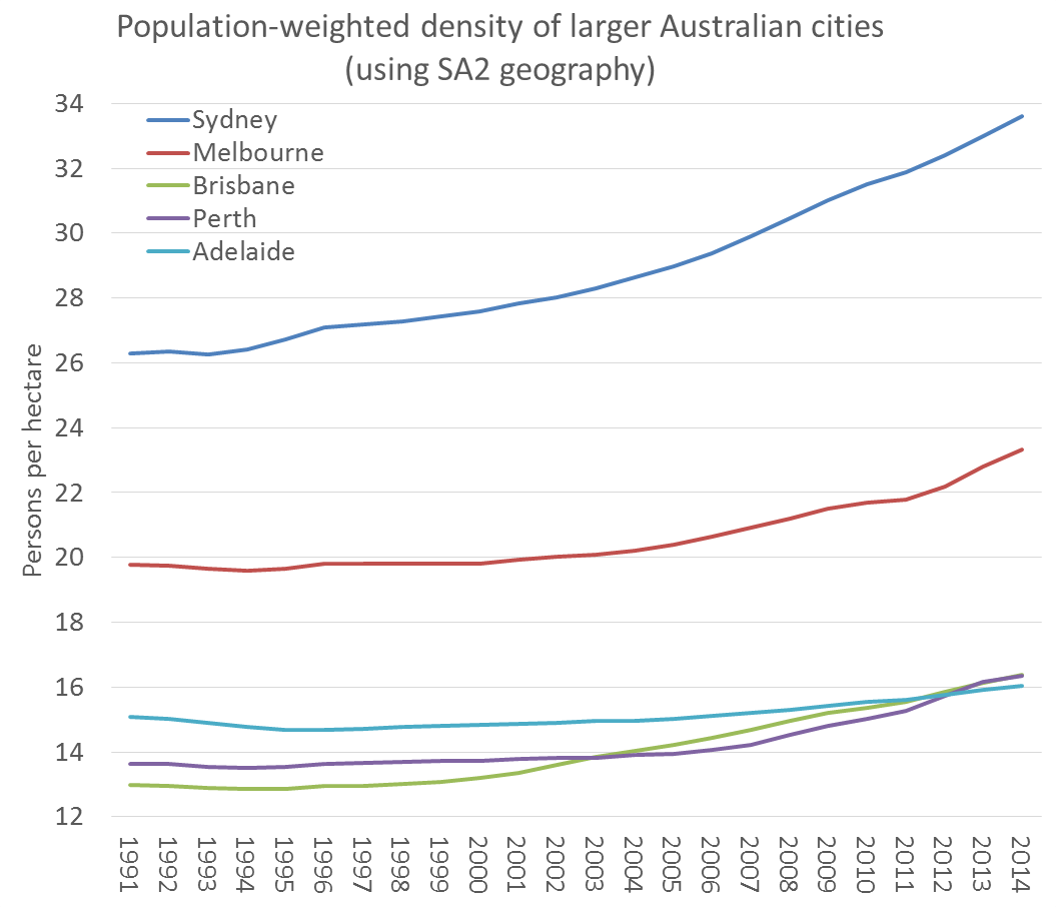
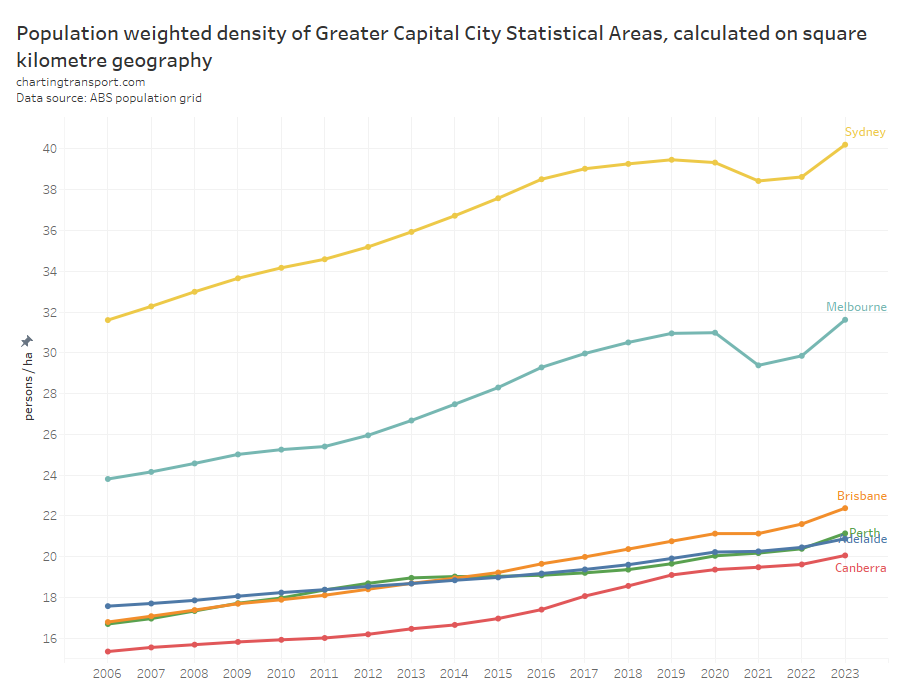
City population density has shot up in Melbourne and Sydney to reach new highs in June 2023. Other Australian cities also saw relatively large increases in population density during 2022-23.
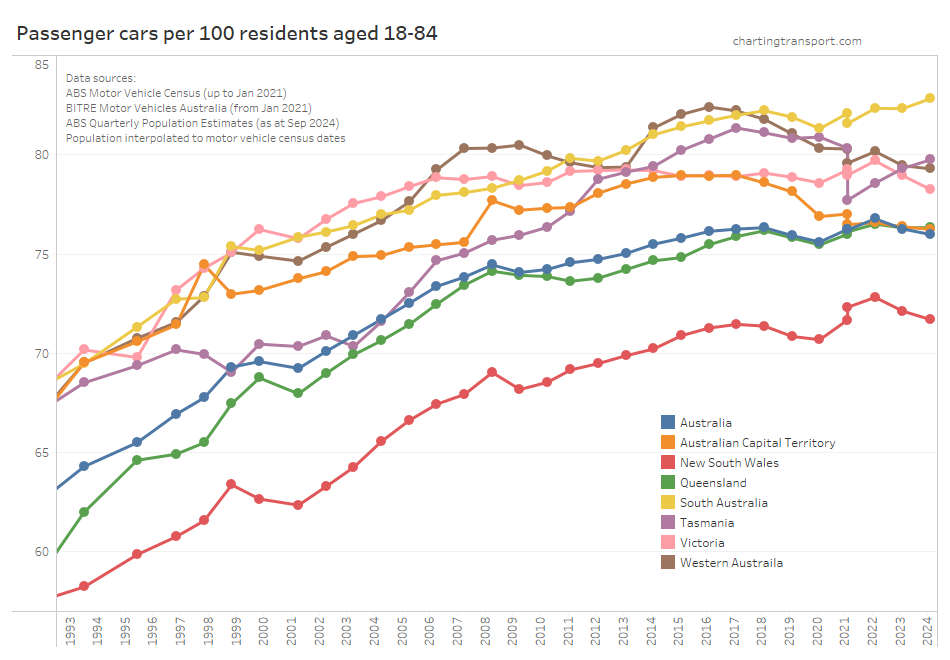
Car ownership rates have dropped slightly in most states and territories (probably with the resumption of immigration):
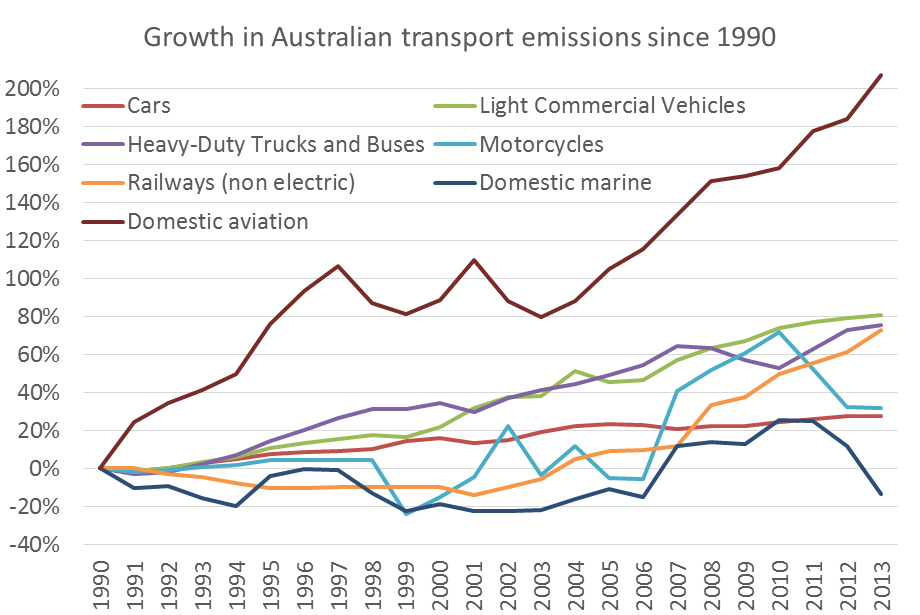
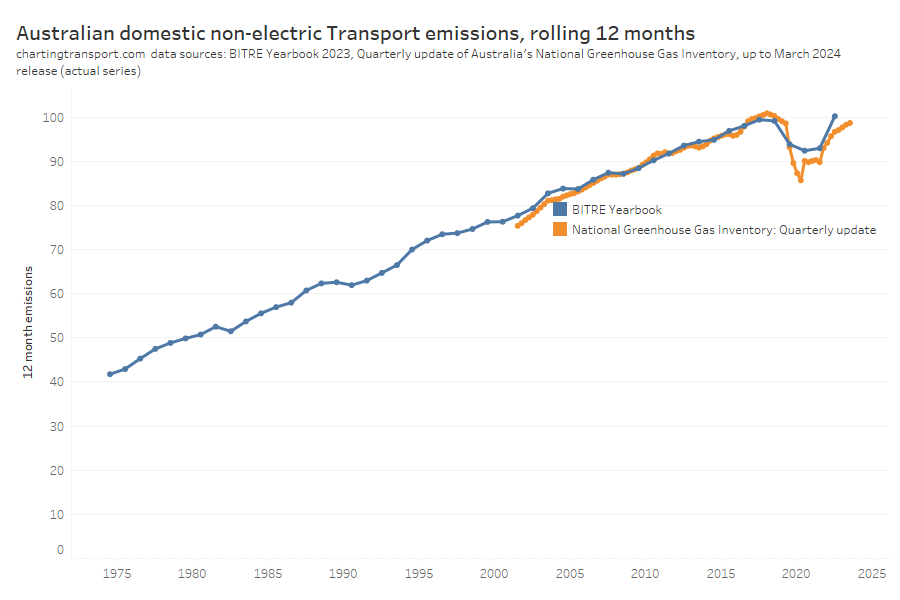
Transport emissions are growing strongly again, and are back near 2019 levels:
I hope you find this new feature useful (I wish I had done this years ago).
Also let me know in the comments if you want to suggest Trends pages for more topics (subject to there being broad interest and relevant open data).
In a recent post I found that journeys to work are generally quite radial relative to city CBDs. But what about travel for other purposes, travel on different days of the week, and travel to different types of places?
This post explores the radialness of general travel around Melbourne using data from Melbourne’s household travel survey (VISTA – the Victorian Integrated Survey of Travel and Activity), which captures all types of personal travel by residents.
In this post (part 1), I will look at measuring radialness, radialness of weekday and weekend trips, radialness of total distance travelled, and how radialness varies by mode, distance from the CBD, different places, ages and sex.
Part 2 of this analysis will look at radialness at different times of day and also visualising radialness on maps.
Measuring radialness for general travel
Unlike the census of population and housing that only captures journeys from home to work, VISTA measures trips in all directions, including to and from survey home locations, so I need a slightly different measure to my previous post (see: How radial are journeys to work in Australian cities?).
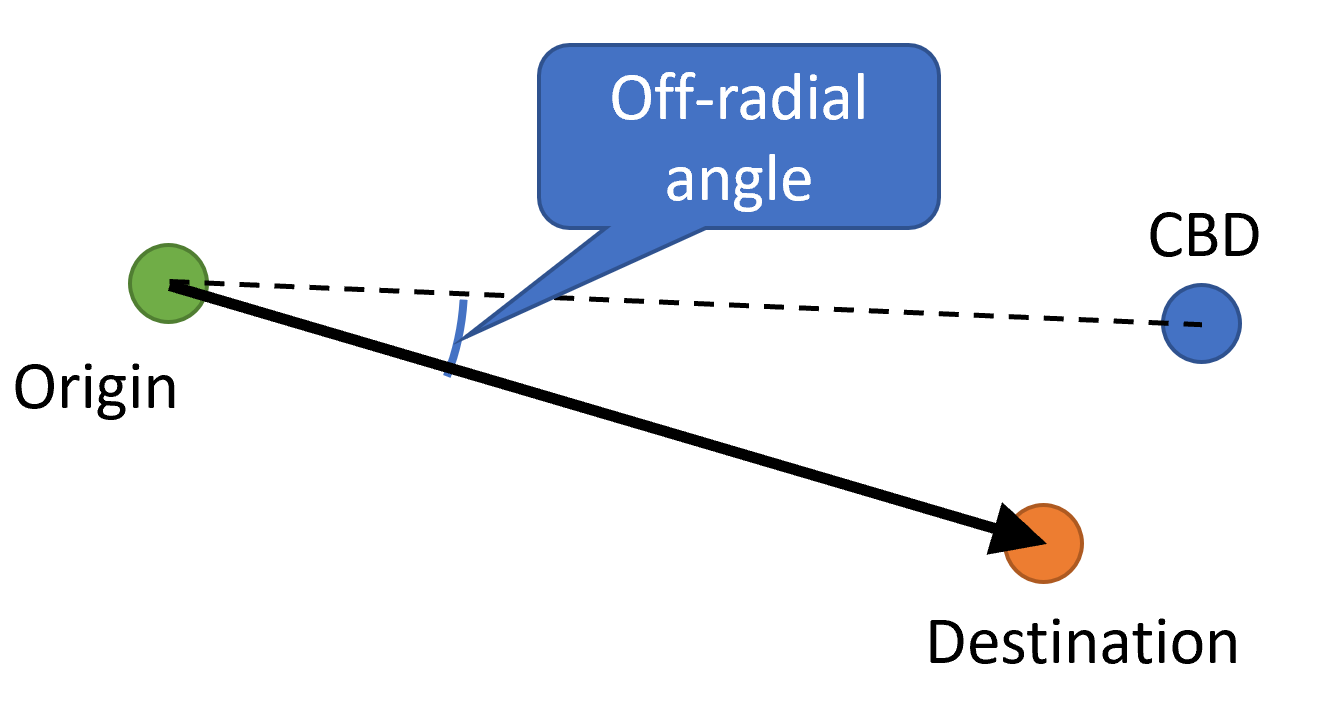
When considering the radialness of a trip, I want to compare the difference between the trip’s alignment and a trip that would head directly towards (or away from) the CBD. I am calling the difference between these alignments the off-radial angle.
So, in the following simple example, the off-radial angle is the difference between the bearing from the origin to destination and the bearing from the origin to the CBD.
The trip is quite radial and the off-radial angle is small. A perfectly radial trip would have an off-radial angle of 0°, while a perfectly orbital trips would have an off-radial angle of 90°.
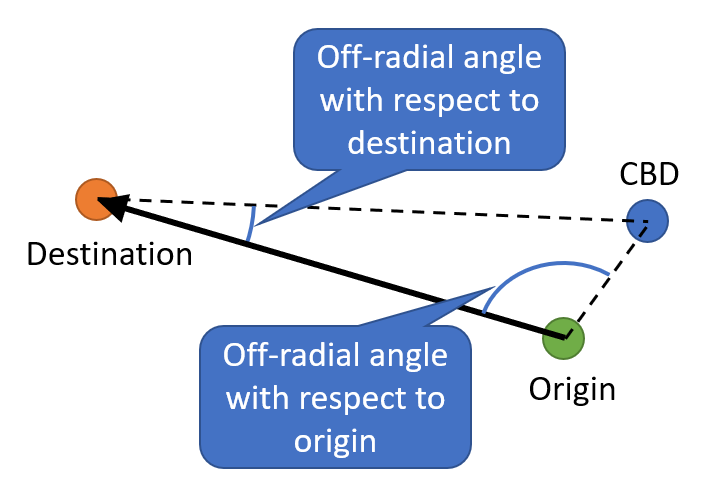
Unfortunately it’s not always that simple. Let’s consider an trip that is the exact opposite of the example above. If I don’t care about whether the trip is towards or away from the CBD, then I want to get the same radialness measure as the first example because it is equally as radial.
To get the same measure as the first example, I need to measure the off-radial angle with respect to the destination rather the origin. If I measure the off-radial angle for the second trip with respect to its origin then I’d get an angle of around 100°, suggesting a very non-radial trip, which isn’t really the case.
So for this post I am always going to measure the off-radial with respect to the trip end that is furthest from the CBD, whether than be the origin or destination. When I don’t care whether the trip is inbound or outbound, the off-radial angle will always be in the range 0° to 90°.
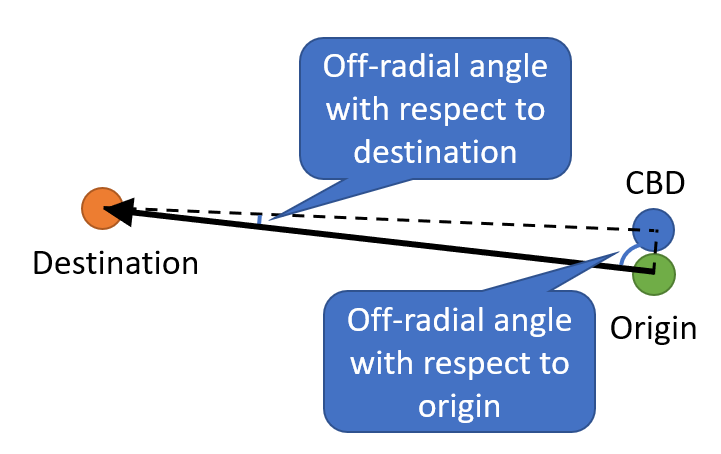
Just in case you need more convincing, consider the following trip:
The origin is so close to the CBD that this is a very radial trip so I want a small angle, but the off-radial angle with respect to the origin is almost 90°.
If you think about a trip originating in the CBD, the off-radial angle with respect to the origin has everything to do with the location within the CBD compared to the GPO (the actual point I am measuring against), when really a trip from anywhere in the CBD to the suburbs is very radial.
This approach does introduce a slight bias towards smaller off-radial angles. Using the trip end that is furthest from the CBD means that even if you had a completely random distribution of trip origins and destinations, there would be more trips with smaller off-radial angles and fewer trips with angles near 90°. In fact, to get close to a 90° angle, the origin and destination would have to be almost exactly the same distance from the CBD, and the trip be not be very long – an unlikely scenario. So for a truly random distribution of trip directions the off-radial angles will be slightly biased towards smaller angles and the average would be less than 45°. I don’t expect this bias would be large, and we will get a feel for this bias shortly.
Another slight complication is that a short trip within the CBD will have a fairly arbitrary off-radial angle which isn’t very meaningful or relevant. So I am not going to bother considering trips that start and finish within (an arbitrary) 1.5 km of the GPO.
I should point out that a “trip” in VISTA is considered a journey between two places of activity for a person. It may have multiple stops along the way for the purposes of changing mode (e.g. bus to train), but for this post I’m looking at the geometry of the end-to-end trip.
Finally, to differentiate this radialness measure from a slightly different radialness measure I will introduce in part 2 of my analysis, I’m calling it the “two-way off-radial angle” (two-way because I don’t care whether the trip is inbound or outbound with respect to the CBD).
How radial is travel on weekdays and weekends?
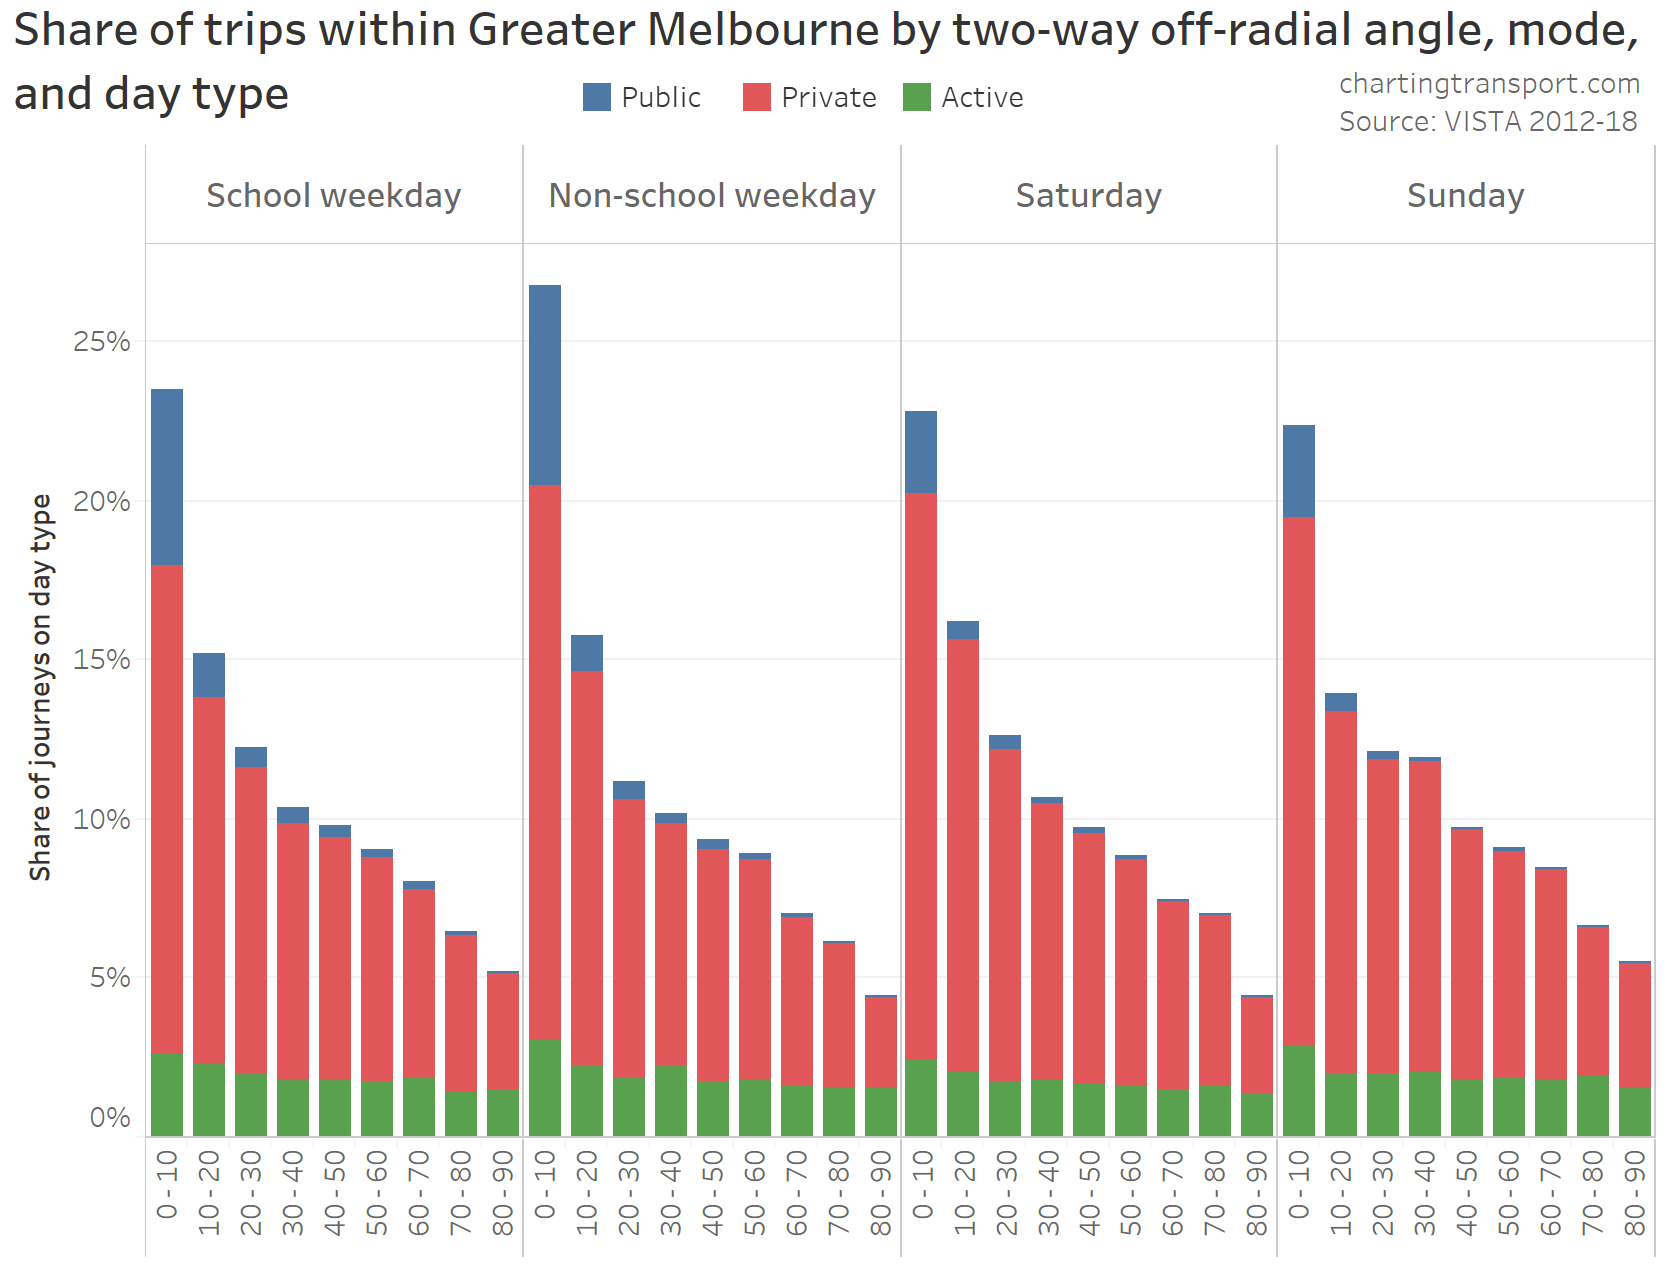
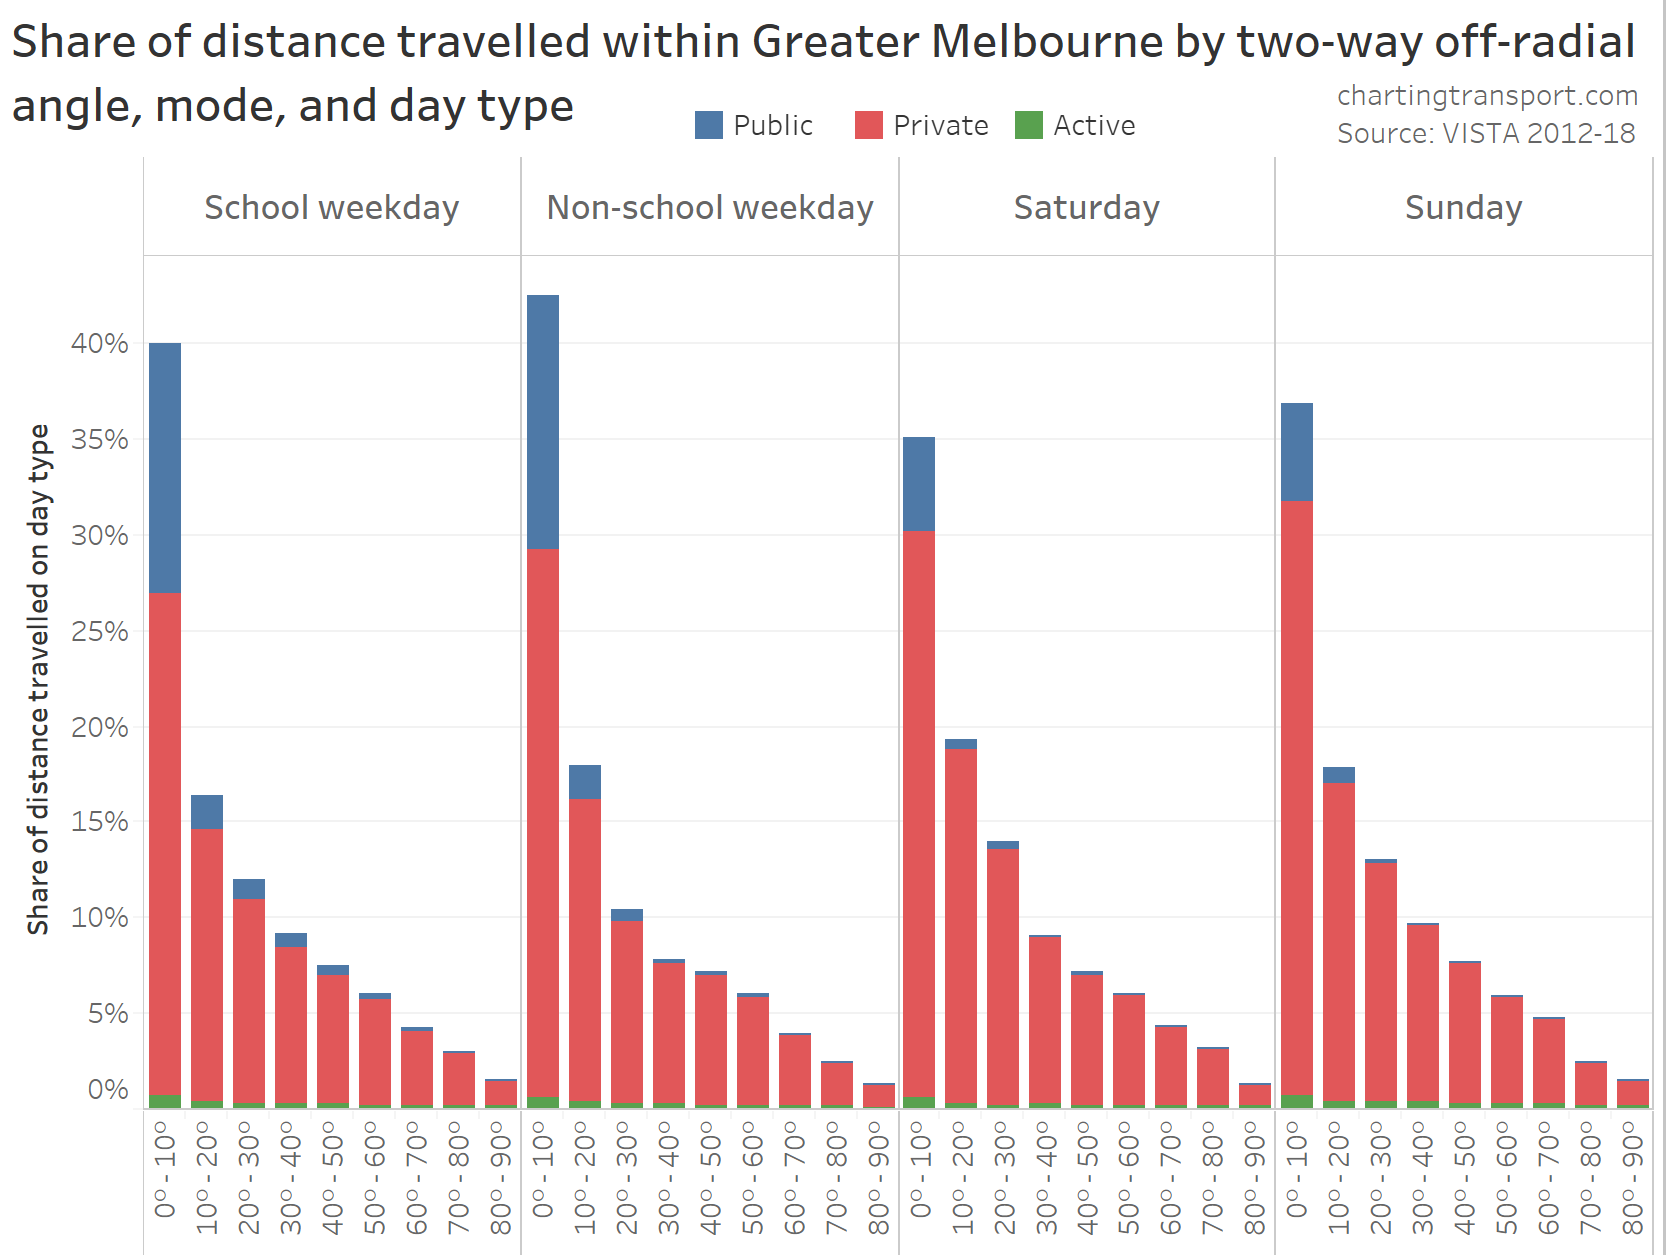
This first chart looks at the distribution of trips by mode and two-way off-radial angle interval, with a histogram for each day type:
Technical note: As per usual, I’ve classified any journey involving public transport as “Public”, any journey not involving motorised transport as “Active”, and any journey involving a motorised road-based vehicle as “Private”. With VISTA a quite small number of trips are classified as “other”, which I have excluded.
You can see that on all day types, the most common two-way off-radial angle group is 0°-10° – which are very radial trips. The most radial day type is a school holiday weekday, where there are still many work trips to the central, but a lot fewer non-radial trips to schools.
You can also see that active transport trips are fairly well distributed across the angle intervals (with only a slightly bias towards radial trips), while public transport trips are highly radial on all day types.
Public transport mode share is only really significant for highly radial trips. This probably reflects most (but not all) high quality public transport lines being highly radial and running to the central city where car parking costs are generally much higher.
What surprised me a little is that weekend trips are only slightly less radial than weekdays, even for private transport trips (good quality roads exist in multiple travel directions in most of Melbourne).
What is different between weekday and weekend travel?
Here is a VISTA destination density map of travel around Melbourne by private transport (excluding trips to places of accommodation – such as homes) animated to alternate between school weekdays and weekends. The red areas have the highest concentration of trip destinations.
The central city area dominates weekday destination density, but major suburban shopping centres are also significant destinations on weekends (as you might expect).
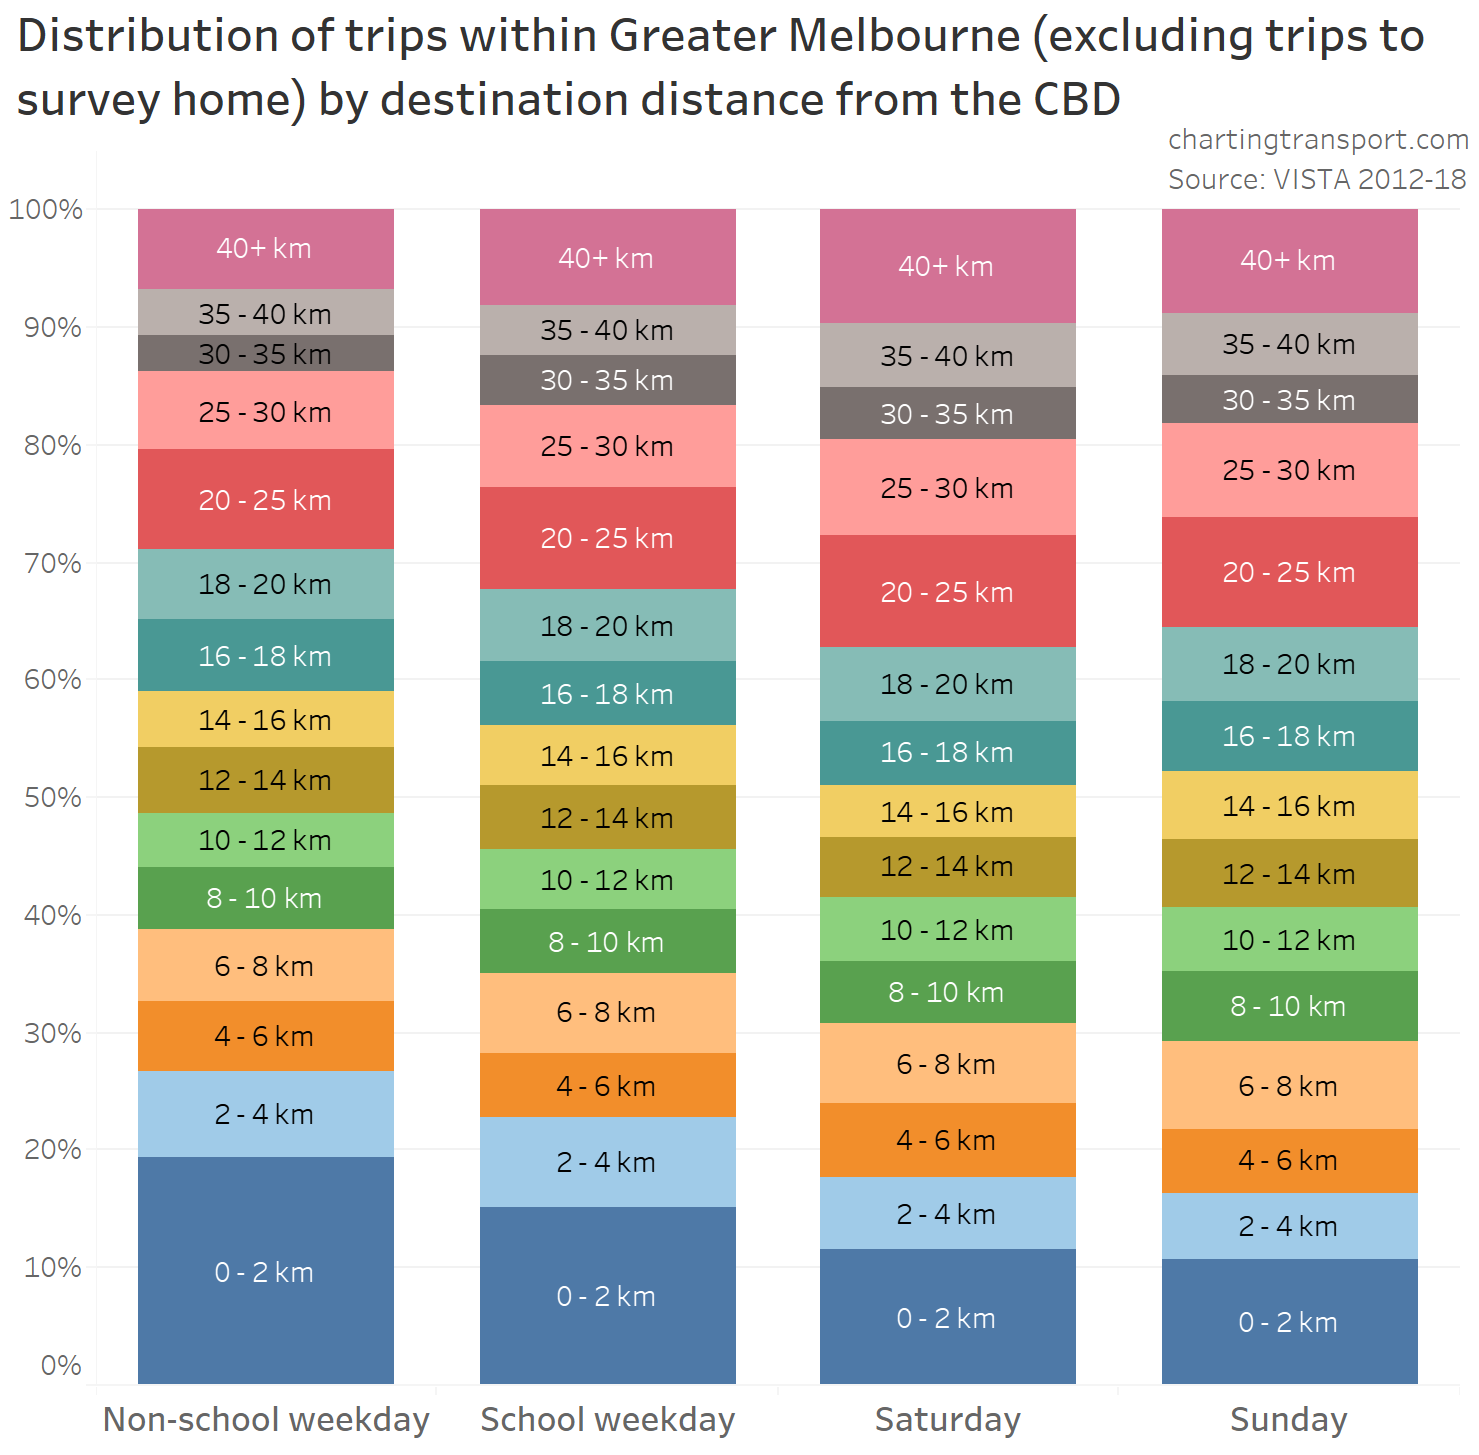
Here is a chart showing the distribution of destinations by distance from the CBD by day type:
You can see that trips on non-school weekdays are more likely to be to destinations closer to the CBD (indeed around 19% were to destinations within 2 km of the GPO). This reduces for school weekdays, and further for Saturdays and Sundays.
But as we saw in the first chart, there are still a large number of very radial trips on weekends, so where are these trips going? Are they still mostly going to the CBD, even though fewer people are travelling to the CBD when compared to weekdays?
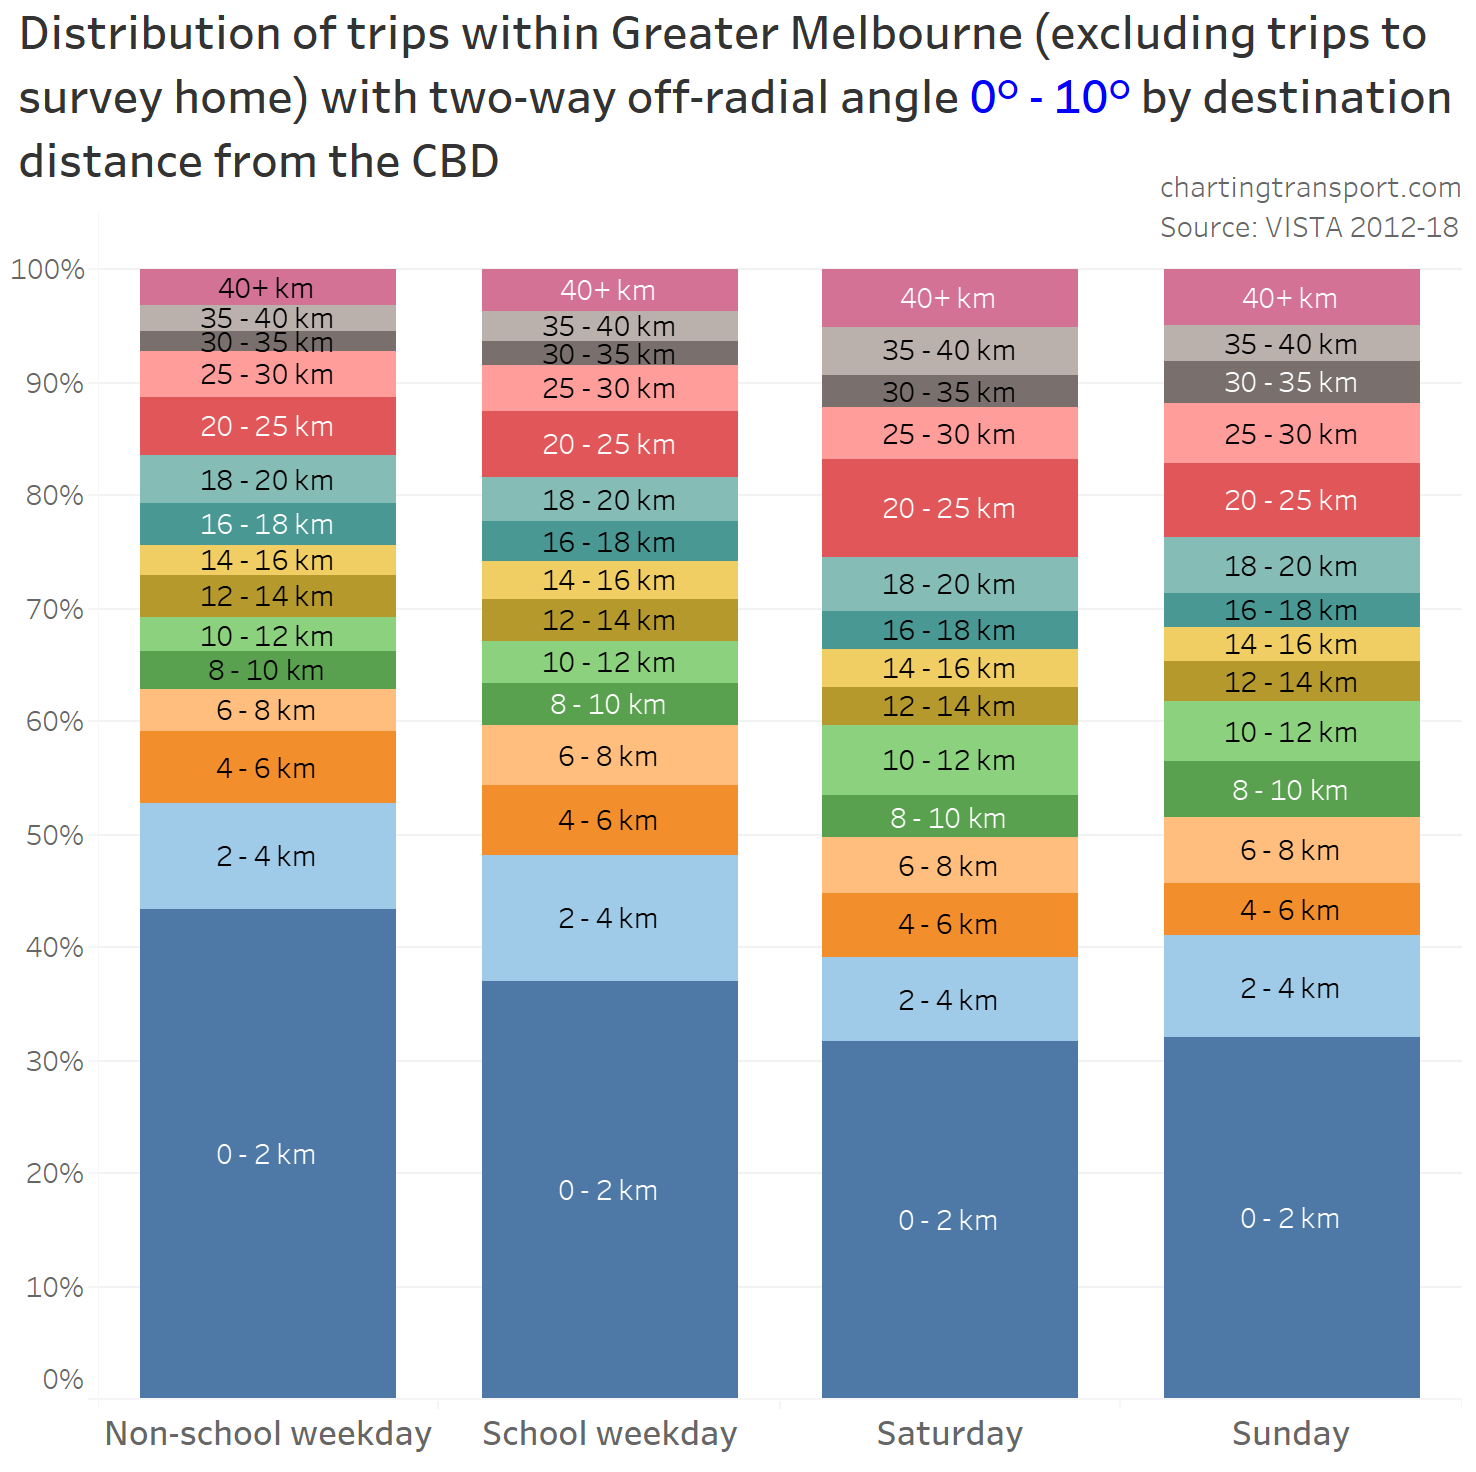
The following chart is similar to the last, but is filtered for very radial trips – being those with off-radial angles 0° to 10°:
Destinations within 0-2 km of the CBD are the largest category for very radial trips, but actually a minority of (non-home) destinations, even on weekdays. On weekends around two-thirds of very radial trips have a (non-home) destination more than 2 km from the CBD. There are lots of very radial trips on weekdays and weekends, but most of them are to destinations more than 2 km from the CBD.
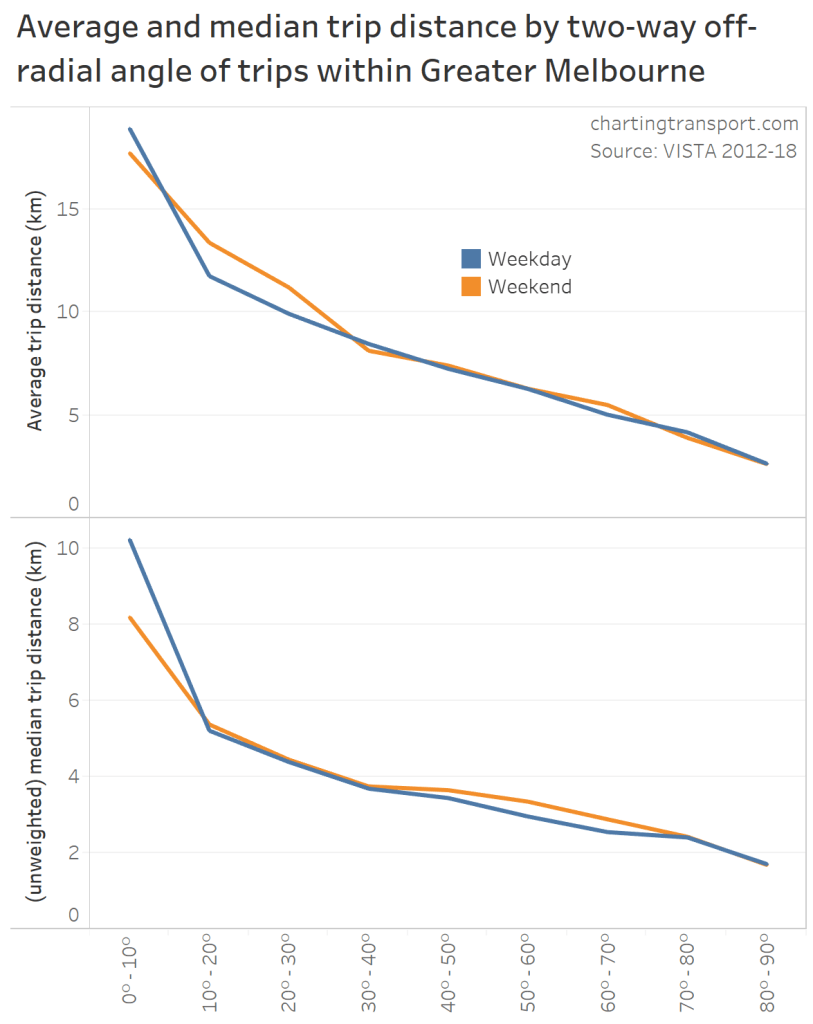
So are these very radial trips shorter on weekends? Here’s a chart showing the median and average distance of trips by two-way off-radial angle:
Technical note regarding weighted v unweighted: VISTA trips are weighted so that they can be summed to represent travel by the total residential population – with survey home types that are under-represented given a larger weighting. In all my averages I’ve used this weighting, but unfortunately at the time of writing Tableau cannot calculate weighted medians (or percentiles), so I’ve had to calculate unweighted medians instead (I’ve manually checked the weighted medians for 0-10° and they calculate as 9.98 km on weekdays and 7.99 km on weekends – fairly close to the unweighted medians).
For very radial trips (0°-10°), weekend trips are shorter by both measures, but for the next interval (10°-20°) weekend trips are curiously longer. There’s not a huge difference with subsequent angle intervals and I don’t think we should get too excited about them because there will be some noise in the sample.
How radial are trips by distance from the city centre?
If we want to measure radialness against multiple variables, then more histogram charts aren’t going to be practical. So instead I’m going to calculate a single summary statistic: the average two-way off-radial angle.
If the average is small, then trips are very radial, whereas an average near 40-45° would suggest no radial bias.
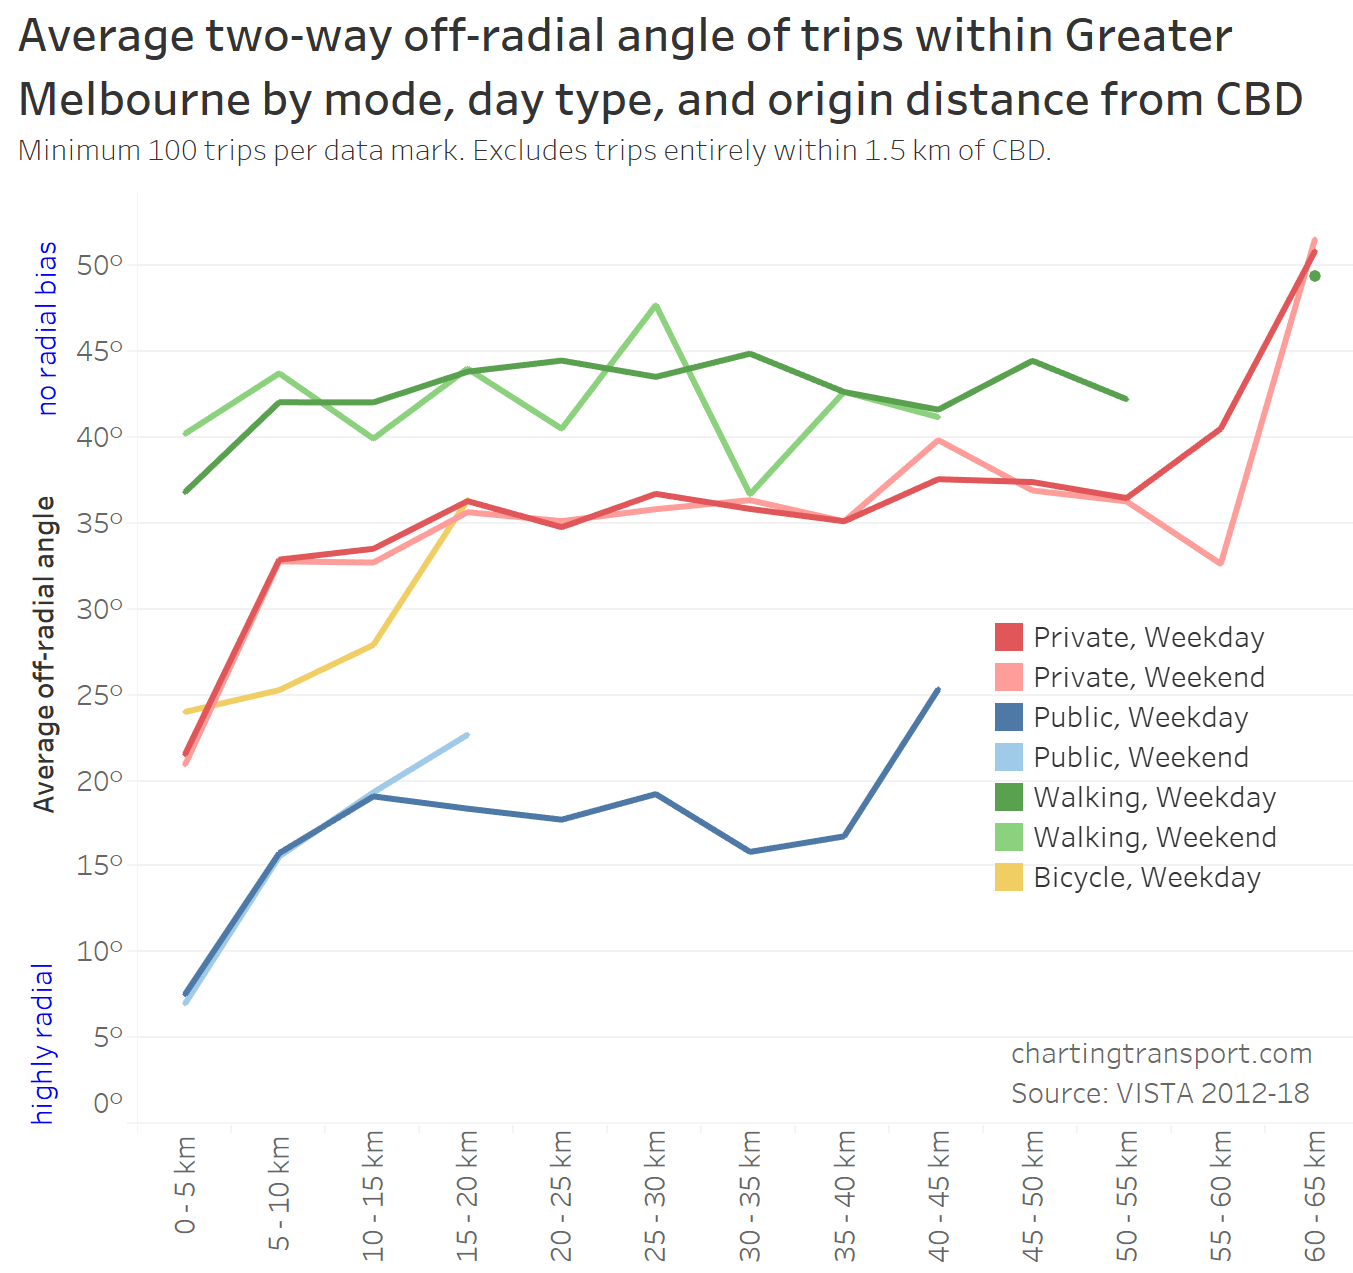
Here’s a look at radialness by origin distances from the CBD, main mode, and weekdays v weekends:
(in case you are wondering, this chart looks very similar if the X-axis is destination distance from the CBD)
Trips starting closer to the CBD are much more radial for all modes (although much less so for walking), suggesting the CBD is dominant for travel from the inner city.
Public transport trips are the most radial compared to other modes (as we also saw earlier). They are followed by bicycle trips, which probably reflects relatively better cycling infrastructure in the central city, and the fact bicycles can be ridden and parked in the central city for free (unlike public and private transport).
Walking trips are the least radial on average, with almost no radial-bias showing at all. Earlier in this post I pointed out that two-way off-radial angles measured will be slightly biased towards smaller angles, even if trips were truly randomly orientated. I think there’s a good chance that walking trips in the middle and outer suburbs have no radial bias, and the fact they mostly have an average angle of between 40° and 45° suggests the inherent measurement bias to smaller angles is not particularly strong.
In the chart you can also see that within each main mode there is little difference between weekday and weekend trips (for walking trips the smaller weekend sample size is likely introducing some noise).
Furthermore, average two-way off-radial angles are mostly flat for each mode between beyond 10 km from the CBD, with two exceptions:
The weekend public transport average two-way off-radial angle for 40-45 km from the CBD was 23°, influenced by many local non-work trips (and there is insufficient sample size for public transport trips commencing further out).
Trips in outer Melbourne (55+ km) are actually slightly biased towards non-radial travel – i.e. average two-way off-radial angle higher than 45°. It turns out most of them are on the Mornington Peninsula where trip bearings are heavily influenced by the shape of the peninsula.
To visualise this, here is a map showing the average two-way off-radial angle for trip origin SA2s across Greater Melbourne:
Technical note: the map is drawn using SA1 areas, and only SA1s with a trip origin are included, which explains the many small gaps.
Point Nepean (at the bottom of the map) has an average off-radial angle of 52°, which reflects the thin non-radial geography of the end of the peninsula.
Some relative outliers of interest include:
Melbourne Airport has a relatively low average angle of 23°, probably reflecting higher travel volumes to the CBD and wealthy inner city and south-east suburbs where regular air travellers might be more likely to live. However this would be offset by airport workers who tend to live nearby, although those in Sunbury are actually making fairly radial trips. Note that non-resident airport users are not included in VISTA, and I’ve filtered out flights (because almost all of them don’t stay within Greater Melbourne).
Wandin – Seville in the outer east has an average off-radial angle of 18°, probably reflecting that many of the urban settlements in this area are along the east-west (radial) Warburton Highway.
Melton and Melton South have a high average angle of 42° – probably reflecting many local trips within the township that would have no radial bias.
Mount Dandenong – Olinda has a higher average angle of 42° also – probably reflecting some north-south geographic barriers in the area (ie steeper mountain slopes on the western edge).
Several bay-side SA2s have higher radialness, probably reflecting the coast line being fairly radially aligned with the CBD, and the coast being a natural barrier to non-radial travel.
How does radialness vary by trip purpose?
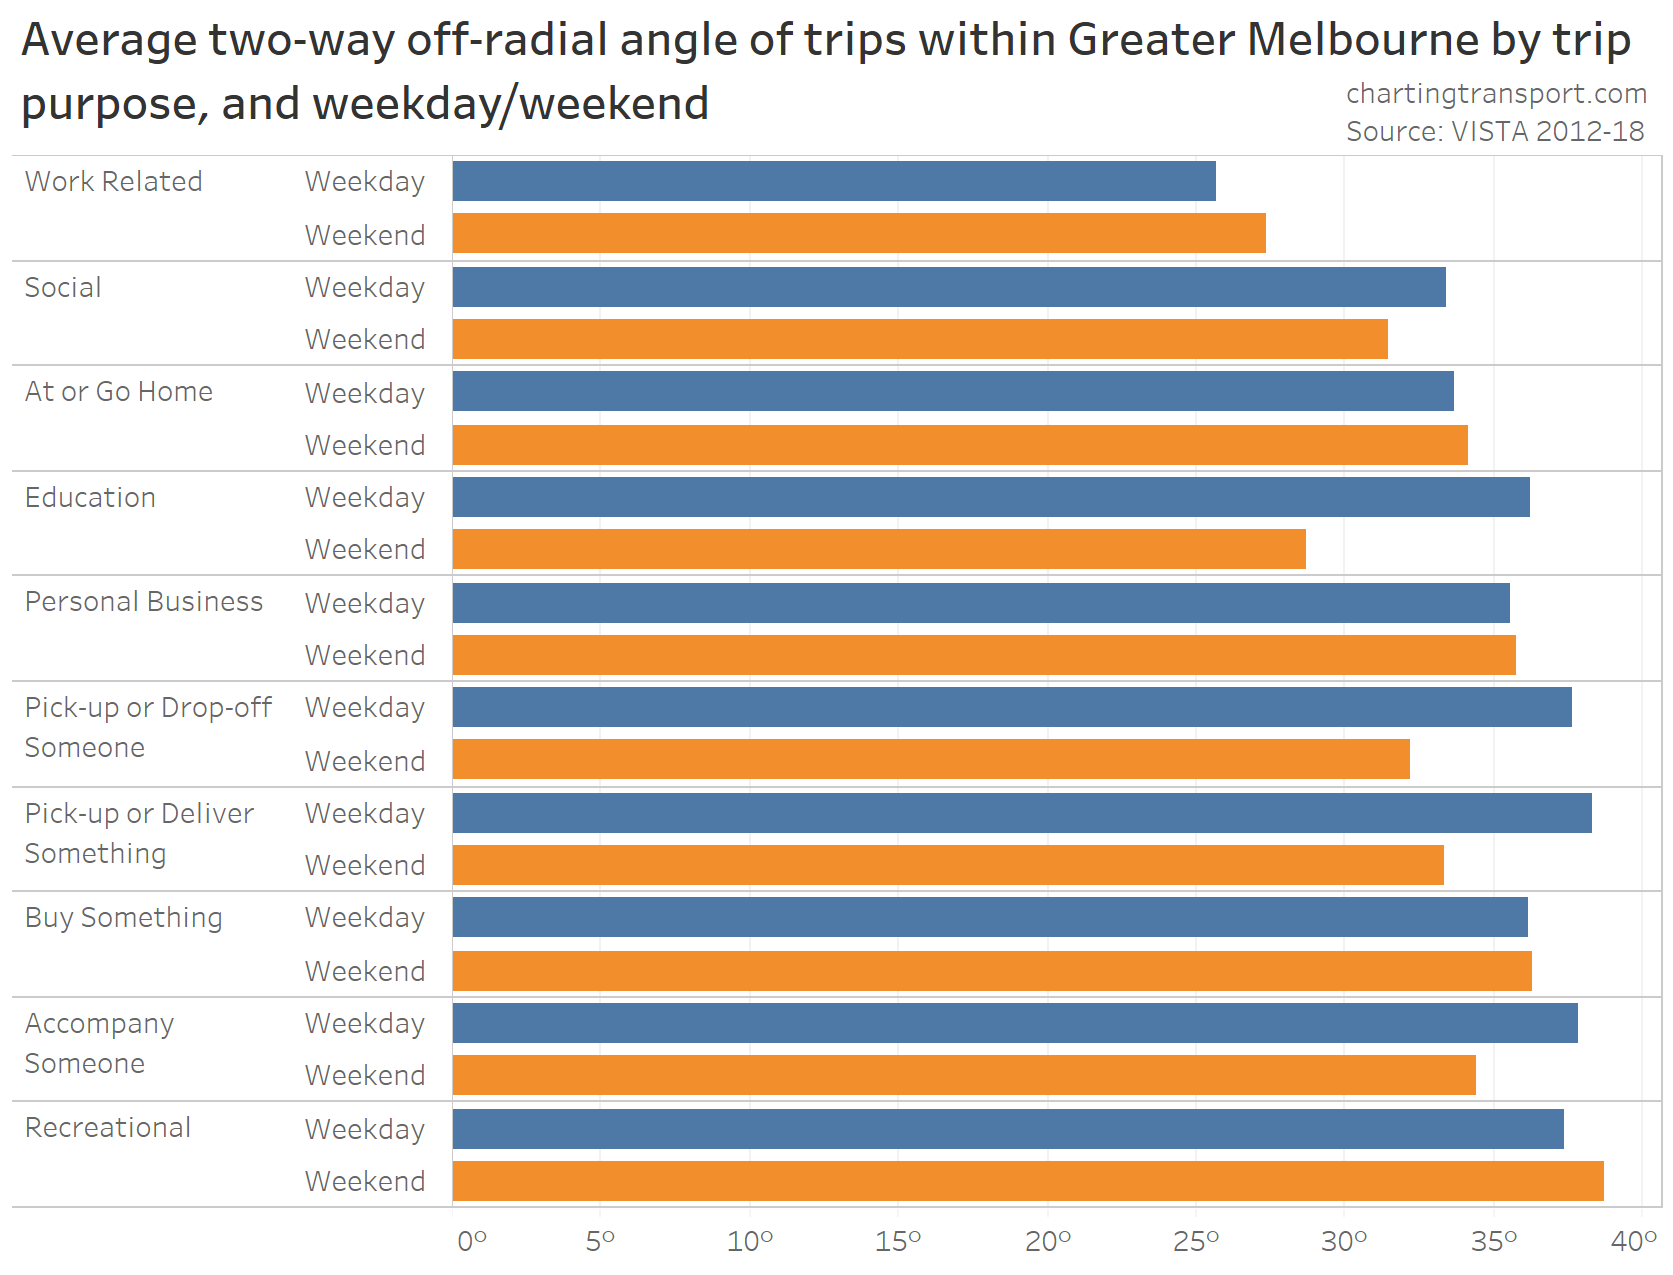
Firstly, here’s a chart showing average two-way off-radial angles by (destination) trip purpose for weekdays and weekends:
Work related trips are generally the most radial, followed by social and then education trips (except weekend education trips, of which there are few).
The least radial trip type is recreational trips on weekends.
Curiously, weekend trips to accompany, pick up or drop off someone were more radial than weekdays, perhaps because more people are not working and able to do this for others, and/or weekend public transport service levels are lower.
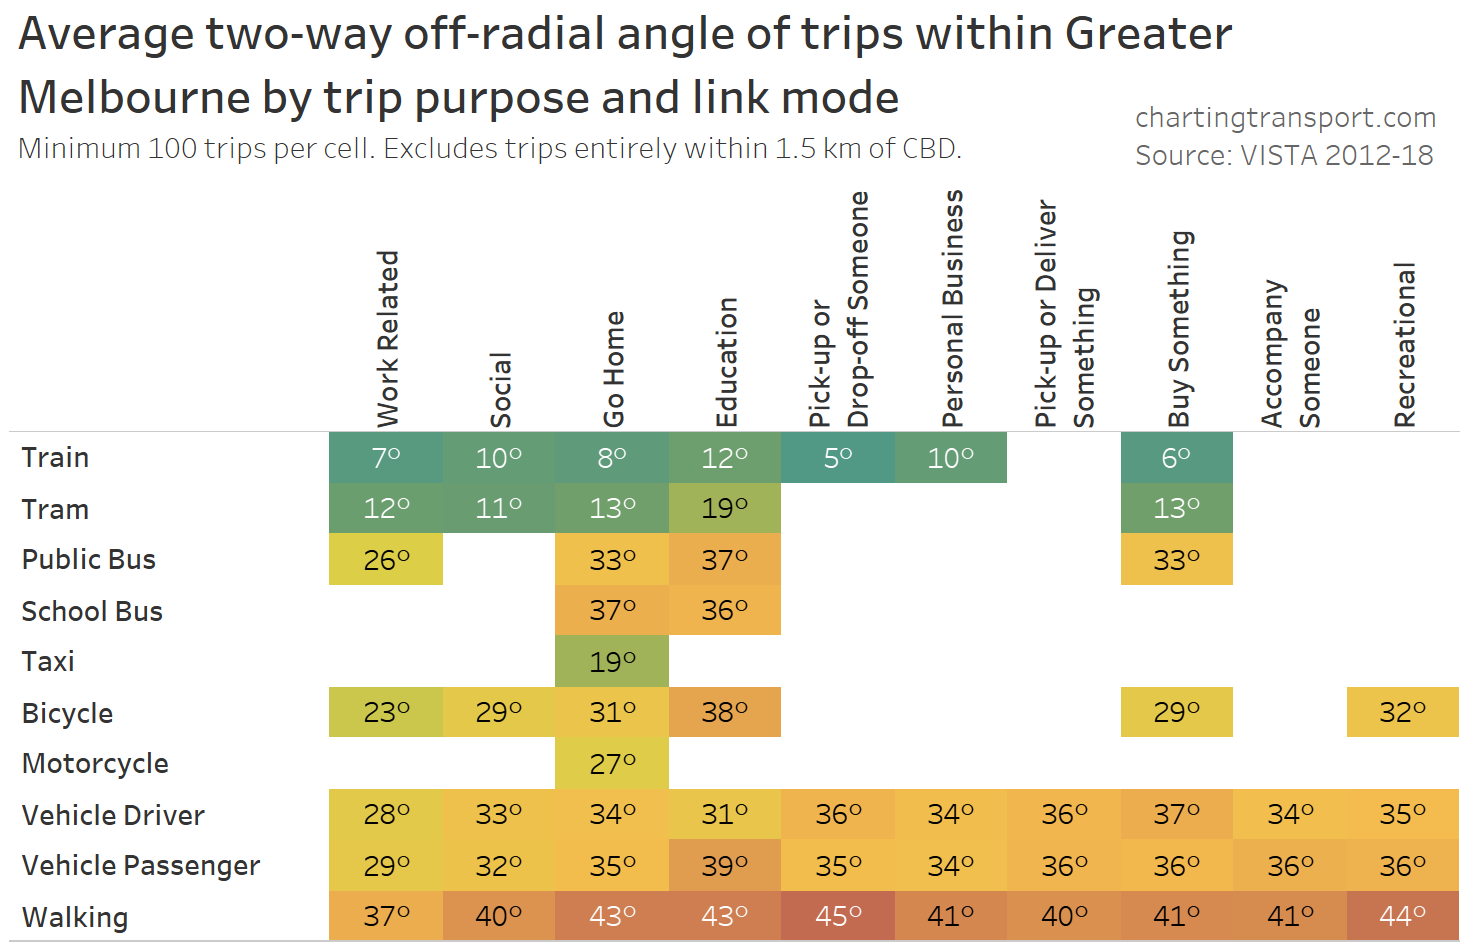
VISTA designates a “link mode” to each trip – being generally the highest ranked mode in the journey (trains being highest ranked, followed by trams, buses, vehicle driver, vehicle passenger, bicycle, walking). Actual trips may involve multiple modes, and the off-radial angle is measured for the end-to-end trip, not the part of the trip that used the “link mode”.
The following table shows average two-way off-radial angles for combinations of link mode and trip purpose:
Technical note: gaps in the table are where there were insufficient trips sampled of that trip purpose and mode combination (less than 100).
The table shows that:
Train trips are the most radial, followed by trams, taxis, motorcycles, buses, bicycles, private vehicle travel and finally walking.
Education trips by train and tram are less radial than other trip purposes on trains and trams, I suspect because many will be to schools and universities not in the central city.
How does radialness vary by different destination types?
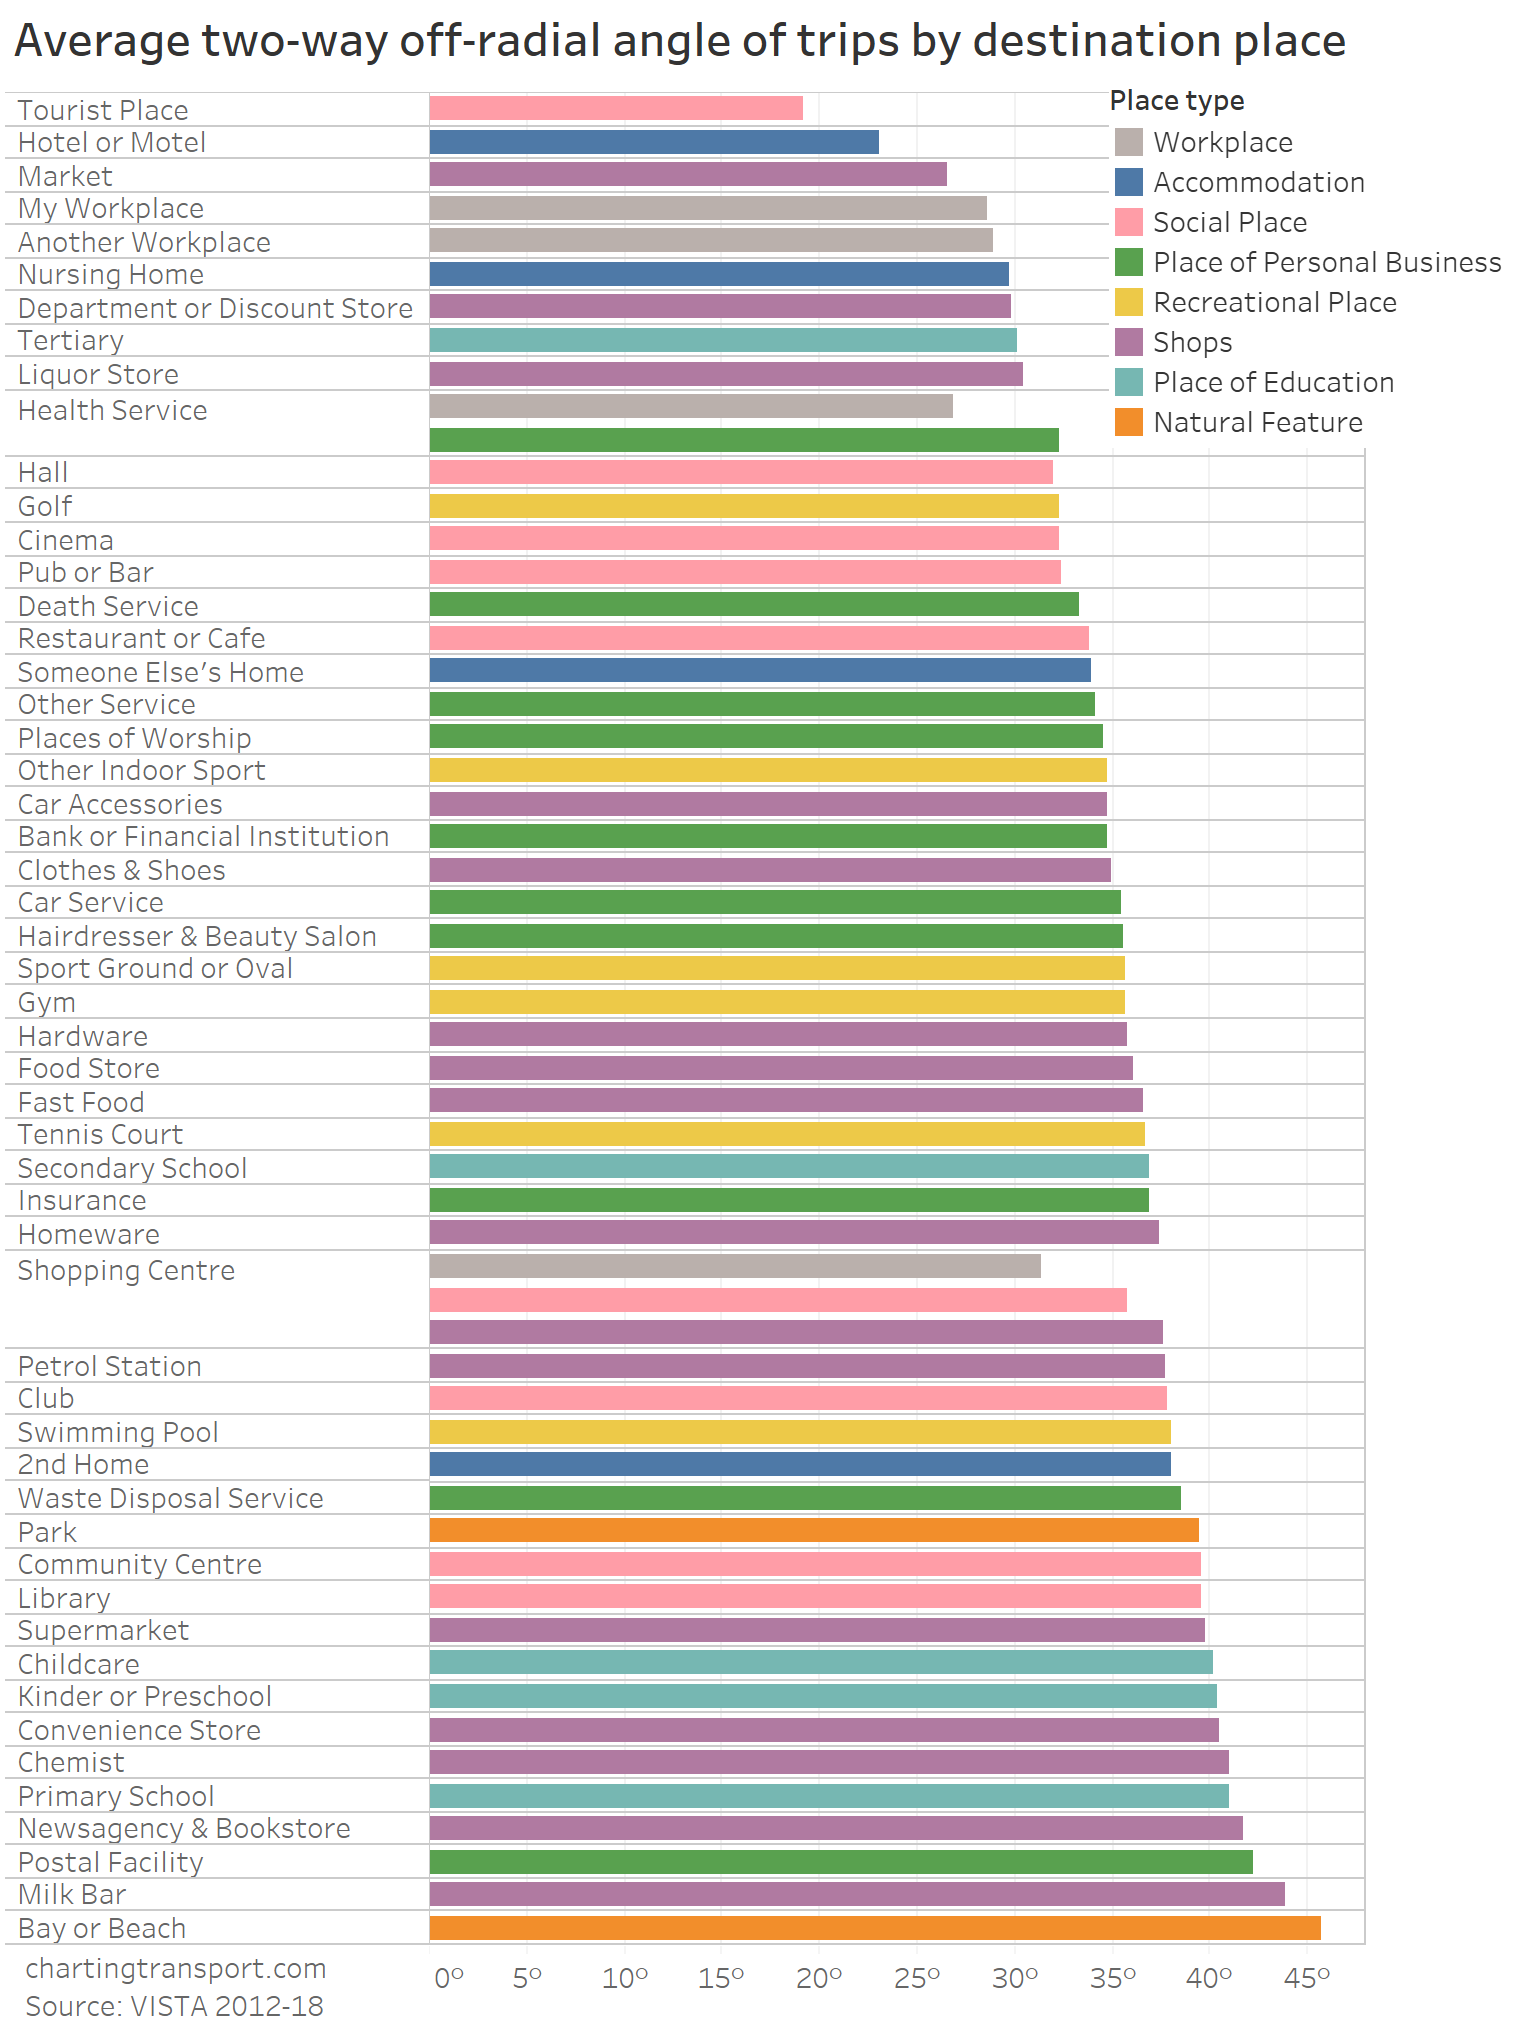
Here is a chart of average two-way off-radial angles for trips to most VISTA destination place types (those with a sample of at least 100 trips):
Some observations:
Trips to tourist places were the most radial, with most of those destinations in the central city.
Markets attract quite radial trips, probably because many popular markets are in the inner city (eg Queen Victoria, South Melbourne, Prahran, Footscray).
Trips to the bay or beach are the least radial – which makes sense given much of the coastlines are radial in orientation.
Within education places, primary schools have the least radialness, and tertiary institutions the most, with secondary schools in between.
I’ll let you make your own further observations.
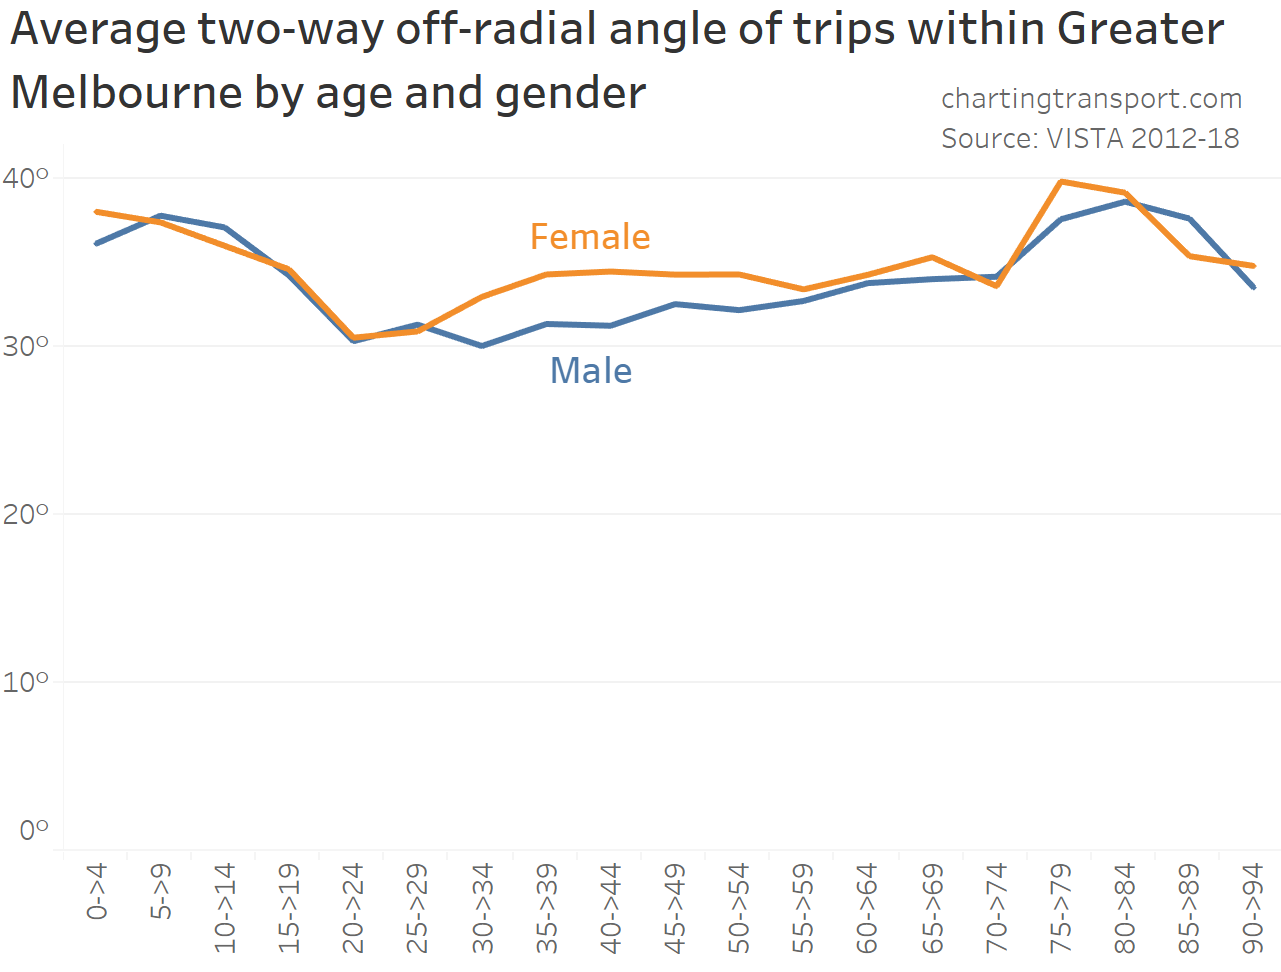
How does radialness vary by age and sex?
I expect the patterns are related to the most common occupations and trip purposes for males and females at different ages. For example, 20-24 year-olds might be more likely to be studying at university or working (both resulting in more radial trips), while children are more likely to travel to school which is not generally particularly radial. Females over 30 are less likely to be in the workforce so more likely to make local trips that are not radially biased.
How radial is total distance travelled?
Not all trips are the same length or duration. Longer trips will have more impact on the transport network. So what does radialness look like in terms of total distance travelled?
Here’s a similar chart to the first chart, but the Y-axis is the proportion of distance travelled on that day type, rather than proportion of trips:
A much larger proportion of distance travelled is accounted for by very radial trips (angles 0°-10°) compared to the proportion of trips. In fact it is around 42% on school weekdays, 35% on Saturdays and 37% on Sundays. On this measure weekend travel is again less radial than weekdays, but still heavily biased towards radial travel.
Why is travel so radial in Melbourne?
This analysis has found that travel in Melbourne is biased towards radial trips, even on weekends. I think a few things can explain the more radial nature of general travel, including:
The central and inner city is a major destination for many trips, including those to work, universities, entertainment, and medical facilities. Also, many specialised activities and services are only available in the central and inner city. Trips to these destinations will inherently be more radial.
Other large population-serving destinations such as hospitals, large shopping centres, and universities are more likely to be located in the inner and middle suburbs, resulting in fairly radial travel to them from the outer suburbs.
Melbourne’s urban form (like many cities) has several outer radial corridors, often orientated around train lines. Local travel within these corridors is going to be more radial on average because there are fewer non-radial trip destinations with the urbanised area.
The coastlines of Port Phillip Bay are largely radial in orientation relative to the CBD. In areas near the coastline, it is possible to make radial trips but non-radial trips are restricted by the coastline (as we saw above).
Part 2 of this analysis will focus on radialness of trips at different times of day for different travel purposes and modes, as well as visualising radialness on maps.
Finally, I want to thank the Victorian Department of Transport for sharing the VISTA data set with me and allowing me to publish this analysis.
Australian domestic transport emissions have continued to rise and is now the sector with the biggest percentage growth since 1990. Domestic aviation emissions have tripled since 1990. Car emissions per kilometre were improving until 2007, but we appear to have gone backwards since then.
Outer growth areas of Melbourne now account for around 43% of population growth, but urban consolidation in the inner suburbs continues to exceed projections.
This fully revised post looks at calculating population-weighted density using a new population grid for Australia, which finally allows for an internationally comparable measure of city density. I’ve also taken a look at some smaller Australian cities. The data suggests Sydney, Melbourne and Perth have been densifying fastest in more recent years.
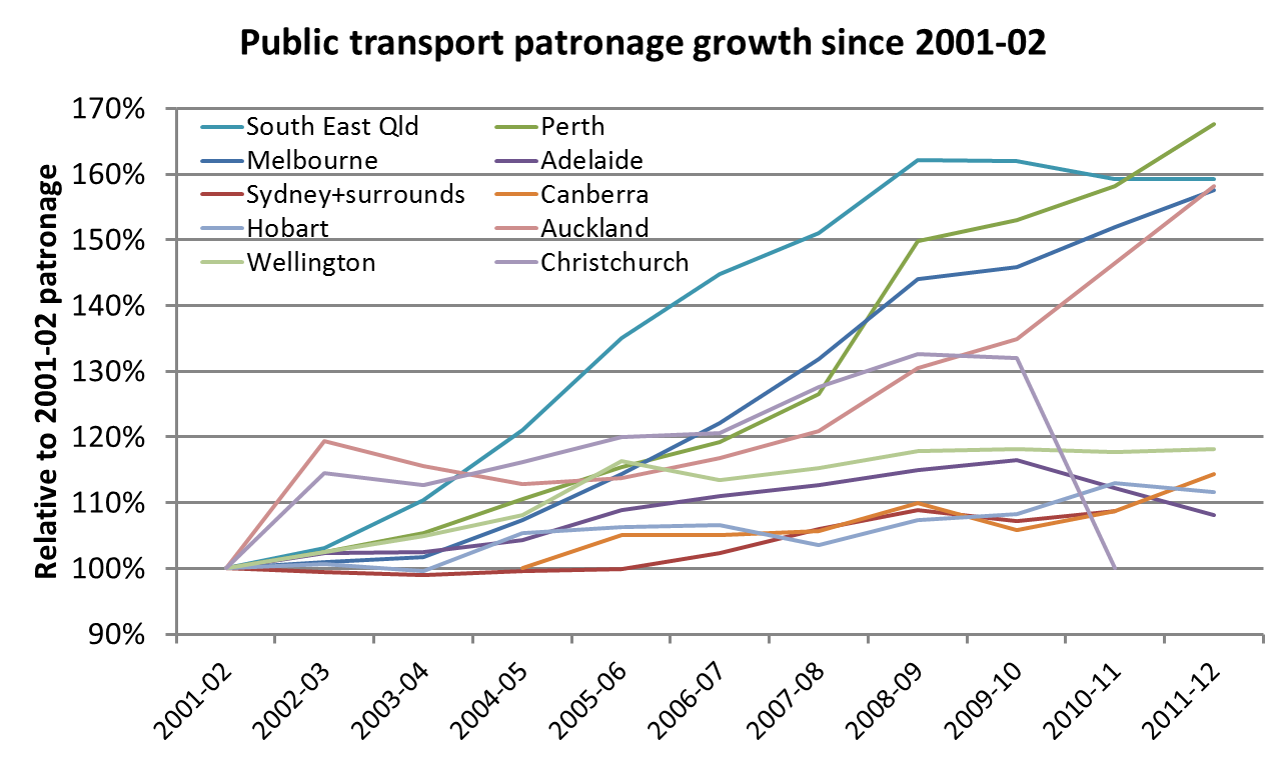
I’ve updated this post with data for the 2011-12 financial year, which shows Perth, Melbourne and Auckland continuing to post strong patronage growth.
Sorry about the delay getting this out. I will try to update this post again in a few months time when 2012-13 patronage data is available for most cities.
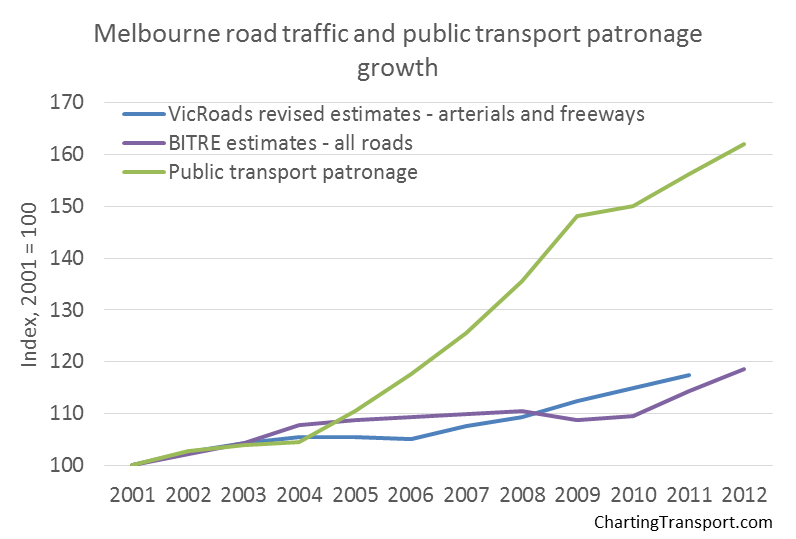
I’ve updated my post with the latest VicRoads (and BITRE) data published on Melbourne’s traffic.
While VicRoads have revised up their estimates of total traffic volumes on Melbourne’s arterial roads and freeways, the comparison with public transport patronage growth is still quite stark:


 Posted by chrisloader