How have mode shares of journeys to work from different home locations changed in Brisbane? What impact have recent bus service level improvements had?
In my post on city level mode share changes we saw that Brisbane had a 1.2% mode shift to public transport between 2006 and 2011. This post will uncover which areas shifted the most.
The following animations show various mode shares for journeys to work from census collection districts for 2006 and Statistical Area Level 1 (SA1) for 2011. These are the smallest geographies available for each census. All the data is by place of usual residence.
I’ve animated each image to alternate between 2006 and 2011, so you can gaze at them and spot the changes. You’ll need to click on them to enlarge and see the animation.
Public transport

You can mode shift in the inner suburbs, The Gap, the Albany Creek area, around Shorncliffe, the middle southern suburbs (between Yeerongpilly and Woodridge), and the strip towards Shailer Park. Much less mode shift is evident in the outer suburbs, particularly Ipswitch, Victoria Point, Cleveland, and Redcliffe. The Springfield growth area shows higher mode shares than average for urban fringe areas without heavy rail.
Sustainable transport (only)

This map excludes those who used private transport to reach public transport. In most outer suburbs of Brisbane, it seems the vast majority of people are using private motorised transport as part of their journey to work, including to get to train or busway stations.
Train

Significant mode shift can be seen along the Ferny Grove line, the Shorncliffe line, and the line towards Darra. I can see little mode shift on other lines.
There was modest mode shift towards train in the Inala area (near the Richlands rail line that opened in early 2011). Perhaps it will take some time for commuting patterns to change to take advantage of the rail line?
Note that a significant share of people in Springfield used trains. They will be getting a train closer to home when the rail line extension from Richlands to Springfield opens in 2014. It appears that only a few of them got to the train by feeder bus, as the next map shows.
Bus

There was significant shift to bus use in the southern suburbs, particularly around the South East Busway (shown in purple). This busway opened in 2001, but it seems mode shift has continued. There was also strong shift in South Brisbane and the West End (where the high frequency CityGlider bus was introduced), out to The Gap, to the inner south-west, the inner northern suburbs between the train lines, and south through Calamvale (north of Browns Plains, now served by high service “BUZ” bus routes using the South East Busway). There was little shift to using buses in the outer suburbs, other than in the Browns Plains area which is now serviced by BUZ routes.
Ferry

There are some significant changes, particularly around the West End (south-west of the CBD) where ferry mode share collapsed (perhaps due to increased bus service levels and disruptions to ferries following the 2011 floods). Ferry mode share also dropped in the St Lucia area, and for students on the University of Queensland campus. I suspect this might be to do with increased bus service levels.
There was strong growth in ferry mode share in Bulimba (north-east of the CBD), following the reopening of the Apollo Road Ferry Wharf in 2008 (which on these maps seems to have been a success) (Apollo Road wharf is the furthest downstream ferry wharf on the south bank).
Train and bus

Train and bus journeys increased share in many areas around Brisbane (note the different scale). Notable areas include around Ferny Grove, North Lakes, along the Beenleigh rail line, along the rail line to Darra, and in Springfield. However these are all very small mode shares.
Multiple public transport modes
Multiple public transport mode journey origins tend to be fairly scattered, so here is a summary over the Greater Brisbane area (using place of enumeration data and thus losing journeys with ferry + non PT modes):

Integrated fares were introduced in 2004/05 eliminating the fare penalty for changing modes. There was a slight drop in multi-modal public transport mode share in 2006 (compared to 2001), but then a substantial rise by 2011 (faster than growth in single mode journeys). I want to explore multi-modality in journey to work data some more soon. Stay tuned.
Mode shift to public transport overall
Here’s a map showing the overall mode share to public transport in Statistical Local Areas (SLAs), the smallest geography where data is available for both 2006 and 2011 (you’ll need to click to enlarge, and unfortunately my GIS software doesn’t give every SLA a label ).

The biggest mode shifts to public transport on this map are in Pallara – Heathwood – Larapinta (mostly sparsely populated), around Darra-Richlands (where the new train line opened), Calamvale (new BUZ routes presumably), and around the end of the South East Busway.
Pinjarra Hills has a shift but only 139 people travelled to work from this SLA in 2011, so it only takes a few people to register a larger mode shift. And before you get excited about the airport area (Pinenba-Eagle Farm), only 144 people travelled from there to work in 2011. I’ll look at mode share by work location in a later post.
The biggest shift away from public transport was in Yeerongpilly, whilst other SLAs with significant drops include Fairfield, Geebung, Holland Park, and Highgate Hill. Not sure what the reasons might be in those places.
Walking only

There was a slight shift to walking in the inner city areas, notably around Woolloongabba, Paddington, and Wilston. Walking mode share was highest around the CBD, Fortitude Valley, and around St Lucia/University of Queensland (UQ).
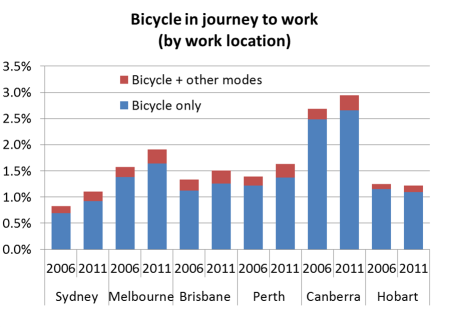
Cycling

Cycling has grown rapidly (off a small base), particularly in the inner suburbs include around St Lucia/UQ and West End.
I’m sure other people will find more patterns – please comment on any interesting finds.


 Posted by chrisloader