[Updated June 2012 to include ratios over time, inner city parking, and other updated data. First posted January 2010]
In this post, I test out a number of possible explanations for the trend in Melbourne’s public transport (PT) patronage growth over recent years to try to find out what might be driving growth. Is it population growth, CBD employment, fuel prices, international students, or the widening of CityLink? You’ll have to read on.
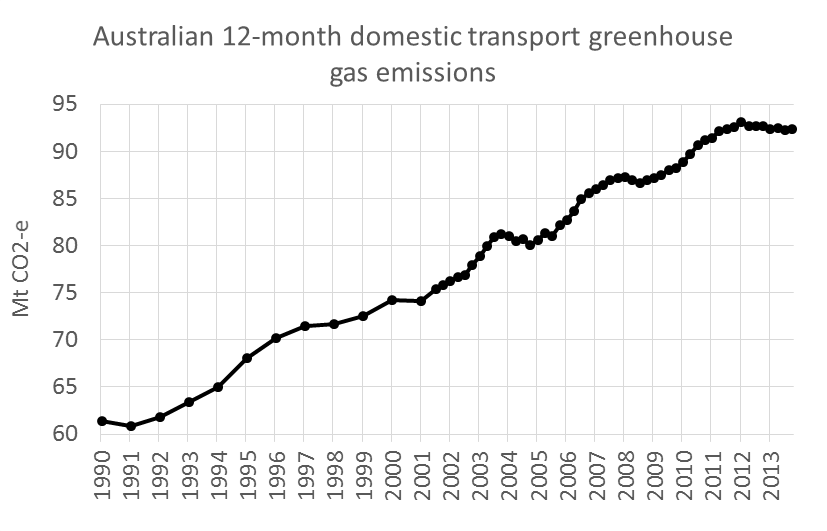
The first chart shows estimated financial year public transport patronage in Melbourne. Note: The method of patronage estimation has changed over the years for all modes. I have assumed comparable measurement for trains and trams and applied my own informed adjustments to bus patronage history (although I am less confident about the early 1990s – officially patronage stayed much the same despite significant service cuts). 
Patronage was bumpy in the 1990s, followed by modest growth for about 10 years and then a distinct uptick in growth around 2004/05.
I will attempt to find an explanation for this pattern in this analysis (particularly more recent years). Short of a fully comprehensive analysis, I will compare trends in possible drivers with the trend in public transport patronage.
Note due to the nature of available data sources, the years covered in chart will vary – you can spot each year by checking the year range in the chart titles.
Population growth

If this was a dominant factor then you’d expect to see a straight line on this chart. It does show that as population growth has increased, so has public transport patronage growth, but the overall relationship isn’t very linear. Here’s the ratio of patronage to population for all of Melbourne:

We know that public transport use is higher closer to the inner city of Melbourne. So is public transport better correlated with inner city population? The following charts compare PT patronage with “inner” population (LGAs of Melbourne, Port Phillip, Stonnington, Yarra, Hobsons Bay, Maribyrnong, Moonee Valley, Moreland, Darebin, Banyule, Boroondara, and Glen Eira).


The correlation appears to be slightly stronger, but still not very strong.
Employment
People often use PT to get to work. The next chart compares total employed people in Melbourne to public transport patronage (employment figures average monthly total employed people for each financial year, from ABS Labour Force surveys). 
Again, the relationship isn’t very linear – despite a small growth in employed persons in 2008-09, public transport patronage still increased significantly. But then in 2009-10, employed persons grew but patronage didn’t. Likewise PT patronage increased more between 2000/01 and 2001/02, despite little growth in total employment, whereas in the previous year employment grew strongly, but PT patronage didn’t.
This chart also shows kinks in the trend around 2005 and in 2008-09 – so employment doesn’t seem to explain the kink. Note also that journeys to work only make up around 40% of public transport trips in Melbourne (according to VISTA data). And public transport has a very low mode share of journeys to work outside the city centre.
Here is the relationship shown as a ratio over time:

ABS publish figures monthly, and here’s the picture for total persons employed in Melbourne. There was virtually no growth between late 2010 and May 2012 (at least). There was also a flat patch between the start of 2008 and the middle of 2009 (2008-09 shows substantial patronage growth on public transport).

City population (including visitors)
Another hypothesis suggests that if PT is heavily focussed on the inner city (where it has the highest destination mode share), then if more people need to travel to the inner city, this would probably increase PT patronage. This sounds very plausible, especially for trains and trams. The City of Melbourne has estimated weekday daytime population for 2004 to 2010 calendar years. So I am mixing calendar year visitor data with financial year PT patronage – which is not ideal. Anyway, here is what that relationship looks like:

The year 2005/06 includes the 2006 Commonwealth Games that were held in March 2006 and boosted city visitors considerably. If you take out this anomaly, the other four data points look like they form a very linear pattern (as drawn), suggesting it is quite probably a strong driver. There was weak growth in both public transport patronage and city population in 2009-10, suggesting a strong relationship.
The next chart shows the same relationship as a ratio over time. The 2006 anomaly is much less noticeable (note not a huge variation in weekday daytime population the chart above). This suggests that City of Melbourne weekday daytime population is not directly proportional to public transport patronage (in other words: the y-intercept is not zero).

A longer time series of CBD data is available for employment, thanks to the City of Melbourne’s Census of Land Use and Employment. As it hasn’t been an annual survey (red dots are census results), I have made linear interpolations between the years for CBD employment numbers.

Between 1997/98 and 2007/08, the trend was remarkably linear suggesting a strong relationship. When CBD employment grew very weakly between 2002 and 2004, so did PT patronage. Looking at census data for 2001 and 2006, we know that PT mode share to the Melbourne CBD for journeys to work (well, technically the inner Melbourne SLA which is much the same) grew only slightly from 59.1% to 60.8%. So it looks fairly safe to assume that the growth in people using PT to get to jobs in the CBD grew at much the same pace as CBD employment itself.
However between 2007/08 and 2009/10 the trend seems very different. Public transport patronage grew strongly even though the number of employees in the Melbourne CBD did not show much growth at all.
Here’s the same relationship expressed as a ratio over time. The ratio is remarkably flat over time.

Employment has grown around the Melbourne CBD in neighbouring Docklands, Southbank and there are also a number of office buildings in East Melbourne. In fact between 2008 and 2010 there were around 3,300 new jobs in the CBD, and 11,400 new jobs in Docklands.
These areas are also well serviced by public transport. Unfortunately data for these surrounding precincts only goes back to 2002. Here’s a chart comparing PT patronage to total employment in the CBD, Southbank, Docklands and East Melbourne for 2002 to 2010:

Suddenly the trend looks a lot more linear, with a deviation only for the interpolated result in 2008-09 (which might be a product of the GFC in that timeframe). CBD employment alone is no longer a strong driver of public transport patronage. Although bear in mind that public transport mode share in these CBD fringe areas was much lower than the CBD in 2006 (see previous post).
Here’s the same relationship as a ratio over time, which is a little flatter:

While the CLUE data series only runs until 2010 at present, a more timely and regular dataset that might be related to CBD employment is occupied office floor space, calculated from the Property Council of Australia’s Office Market Reports. While I do not have access to the reports themselves, much of the data is available on the internet in various forms, and I have used that data to reconstruct the data series (there is chance of errors creeping in, particularly for earlier years).
Here is the trend in occupied Melbourne CBD office space:

Slow growth until about 2005, then very strong growth. Does that trend sound familiar?

This charts shows very strong correlation (r-squared = 0.99). Although there are still a few small kinks such as 2009-10.
Here it is as a ratio over time, which is not entirely flat:

But the overall strong relationship this confirms the high likelihood of CBD employment being a very significant driver of public transport patronage. Ideally Southbank, Docklands and East Melbourne should be added to the mix, but the data is not readily available.
Inner city parking
A commenter on this blog suggested I look at parking in the inner city. The following chart looks at public transport patronage and total commercial parking spaces the CBD, Southbank, Docklands and East Melbourne.

Between 2004 and 2006, commercial parking spaces grew strongly, while public transport patronage did not. Then public transport patronage grew strongly and there was actually a decline in the number of commercial parking spaces.
I would expect the price of parking to be a stronger driver of public transport use than the capacity available. Unfortunately I do not have a long enough time series of parking prices to test this hypothesis. See also my post on the Melbourne CBD.
Fuel prices
I have taken the monthly average unleaded fuel prices for Melbourne, adjusted for CPI, and then averaged the months for each financial year, to produce the following chart:

Fuel prices are highly volatile, even on an annual basis. Again, even though fuel prices dropped in 2008-09, PT patronage still increased. There seems to be a lot more at work than fuel prices. That said, since 2004-05, real fuel prices jumped from around 115 cents to over 130 cents and have remained higher since. So fuel might be an explanation for the kick up in PT patronage since 2005, perhaps more as the breaking of a psychological price barrier. Or perhaps people’s responses to fuel prices have longer lag times that wash out short-term fluctuations – as people make major decisions – such as the decision to purchase a new car or not. More on that later.
International students
Another hypothesis is that the recent boom in international student numbers drove public transport patronage, as many international students come from countries where public transport is the “default” mode. And while their finances might stretch to studying in Australia, it might not stretch to owning a car (certainly in the car ownership maps we see low car ownership around many universities). 
Unfortunately I’ve only found complete data for financial year 2002/03 onwards, and only at the state level (more detailed data is not freely available).
The boom in international students looks like it really took off in 2007, but fell away sharply in 2009-10 and has been lower since. In 2009-10 patronage grew more slowly, perhaps reflecting the drop in international student numbers. But 2010-11 patronage growth was strong again, despite little growth in international student numbers.
The international student numbers are very small in comparison to the total patronage. However if half of those students averaged 10 trips per week for say 40 weeks a year (purely a guess), that’s 38 million trips. I’ve not got data on what their PT use is actually like (I suspect many live close to their school or university and actually walk). And their boom doesn’t coincide with the boom in public transport patronage that started around 2005. So they might be having an impact – hard to conclude much.
Road congestion

Until 2006-07 there was a fairly linear correlation, but then speeds only slowed slight while public transport patronage increased. In 2009-10 speeds increased and public transport patronage grew slowly. Perhaps congestion wasn’t a driver for patronage growth in 2009-10?
Another point to note is the scale on the X axis – the average speed hasn’t changed by very much. Although the variations in AM peak speeds for particular road segments are likely to have changed more significantly, I somewhat doubt whether the average driver would notice the difference between 35.8 km/h and 34.8 km/h (the change between 2005/06 and 2007/08).
The opening of CityLink in 2001 may have led to a slight increase in AM peak speeds, but this seems to have been quickly eroded the following year (so do new freeways ease congestion?). I’m not sure why traffic sped up in 2003/04, but then dropped again significantly the next year.
Road congestion impacts the majority of the tram network, and essentially all of the bus network. So perhaps only trains are attractive as an alternative to driving in congested traffic. Here’s same chart again but plotted only against train patronage: 
The chart looks much the same. So congestion might be a driver of PT patronage growth, but it probably doesn’t explain the growth in tram and bus patronage, and the relationship isn’t nearly as linear as other factors.
Perhaps also at play here is congestion being relieved for non-radial commuting, where PT had a low market share beforehand anyway. Further research might look at congestion on CBD-radial roads only, though even then, many will also cater for some cross-city trips.
Two of the radial freeways that feed inner Melbourne are operated as the CityLink toll roads, and quarterly data is available on average daily transactions. If the CityLink toll roads compete with public transport it is probably mostly with trains for longer distance travel to the inner city. Here is a chart showing growth in CityLink transactions and train patronage: 
There was very little train growth in the first few years of CityLink (which started in 2001). But then train patronage grew strongly from 2005 while CityLink transaction growth went flat until 2010. A major upgrade project on the eastern leg of CityLink (M1 upgrade) caused delays between 2007 and early 2010, and there was little traffic growth. After the project was largely completed and the fourth lane opened, traffic growth accelerated over 2010. This happened at much the same time that trains recorded weak patronage growth. Then in 2011, train patronage grew again, while traffic seems to have flattened again.
To take a closer look at the two growth rates, here are financial year growth rates on CityLink and trains: 
After most of the works were completed, CityLink transaction growth exceeded train patronage growth in 2009-10 and 2010-11 (note that the flattening evident in the previous chart doesn’t show with annual data). The evidence suggests there could well be a relationship between freeway capacity and train patronage, and that the M1 widening project may have reduced patronage growth on the train network. It has certainly enabled a return to strong growth on CityLink.
Car ownership
People who don’t own cars are probably much more likely to use public transport. The following chart uses cars per 100 persons aged 20-74 (as a proxy for people of car driving age).

This chart shows in the early 2000s that car ownership rose quickly, while public transport patronage growth was slow. Then from 2006-07, car ownership levels peaked and public transport patronage grew quickly. Car ownership dropped in 2008-09 just as public transport patronage surged, but recovered in 2009-10, as public transport stalled. This suggests there may be some relationship between PT patronage and car ownership, but the annual change rates aren’t always consistent.
Service kms
Another potential driver of PT patronage is the amount of service provided. Thankfully, this data is available in Victorian State Budget papers (hidden away in budget paper 3) on the number of timetabled service kms for each mode. As the modes are quite different, I’ve plotted modal charts: 
Train patronage doesn’t seem to be very strongly related to timetabled kms. Perhaps this is because the service levels at peak times on most lines are already attractive from a frequency point of view at least. Many of the extra train kms are providing capacity without a substantial jump in frequency (although some of the additional kms have been in off-peak periods). That’s not to suggest there isn’t a relationship, just that it doesn’t look likely to be the dominant driver. In the early 2000s it seems that there wasn’t a strong response to increased timetable kms (including Sydenham electrification in 2002), while in the mid 2000s patronage grew despite kms staying much the same (other factors must be at work). 
Again, not a strong relationship between tram kms and patronage, despite strong growth in timetabled kms in the early 2000s (partly from tram extensions into lower density suburbs in 2003 (Box Hill) and 2005 (Vermont South) – see here for more history). It also looks like some cuts in 2000 (when some city routes had to be joined due to the loss of W class trams) were done in a way that didn’t result in a loss of patronage. Perhaps because service frequencies were still fairly good after the cuts.

There does seem to be a stronger relationship between bus kms and patronage. This is perhaps to be expected as bus service levels are on average very low in Melbourne, so improved service levels are likely to result in existing users travelling more, and better attract new users.
What is unexpected is that patronage grew at much the same rate as kms between 2005-06 and 2009-10 – an average elasticity of around 1, which is much higher than you would normally expect. In 2010-11, the annual elasticity fell to 0.42. One possible explanation for the slightly steeper rate in recent years is that more of the new kms have come in the form of SmartBus kms (with higher frequencies). We know that long run implied service elasticities for SmartBus can be around 2 – which is higher than the textbook expectation of service elasticities of up to 1 in the long run. Bus upgrades in the early 2000s were a little more focussed on providing new low-frequency services to the urban fringe, which would be unlikely to lead to as much patronage growth.
Here’s a chart showing the ratio of patronage to service kms for all modes:

This chart shows increasing intensity of use of trains and trams between 2004 and 2009, while buses have remained around 1.0-1.1 boardings per service km for at least 12 years running. The significant difference between trams and buses is best explained by the territory covered: trams mostly the CBD, buses mostly not the CBD.
Comparing annual growth/change rates
The following table shows the annual change in Melbourne public transport patronage and a number of potential explanatory factors. I’ve used conditional formatting such that darker green cells indicate values you might expect to contribute to strong PT patronage growth. Rows that have dark green in the same years as PT patronage are potentially stronger at explaining the trends in public transport patronage. I’ve also included the r-squared value for a correlation for each factor compared to PT patronage (based on annual growth rates, not actual values). You might need to click to enlarge and make it easier to read.

The table confirms a strong correlation with CBD+fringe employment, City of Melbourne visitors (2006 removed due to Commonwealth Games anomaly), international student enrolments, population (particularly inner city), and CityLink volumes.
Fuel prices don’t show a strong relationship, although it is hard to believe that they would have no impact. If you offset the fuel price changes by one year the correlation rises to 0.3 so there might be some lag involved.
Conclusions
Based on these simple charts, I surmise that City of Melbourne (LGA) visitations is likely to be one of the strongest drivers of overall PT patronage in Melbourne (but certainly not the only driver). And it certainly stands to reason, given PT’s dominant mode share of travel to the inner city.
But international students, radial motorway traffic volumes, population are probably also having an impact. The impact of fuel prices appears to be more complex.
Buses probably show less response to growth the inner city travel market (as most do not serve the city centre), so service kms are likely to be the strongest driver of bus patronage.
The PCA’s Office Market Report provides the most timely and frequent data relating to CBD employment growth and reveals much slower growth over calendar 2011 (1.4% in occupied office floor space). We might find this trend reflected in slower patronage growth on the train network as figures are published.


 Posted by chrisloader