Updated November 2025 with data up to January 2025
On this page:
- State/territory car ownership (annual)
- Motor vehicle per capita in cities (five-yearly census data)
- Differences between the annual and five-yearly metrics
Data sources:
- ABS Motor Vehicle Census (mostly annually collected for January, up to 2021)
- Australian Bureau of Infrastructure and Transport Research Economics (BITRE) Road Vehicles Australia, January 2024 (collected for January each year from 2021).
- ABS Quarterly Population – State/territory (data to June 2024, released December 2024)
- ABS Census of Population and Housing (2006, 2011, 2016, 2021)
State/territory car ownership (annual)
The first metric is registered passenger cars per capita.
BITRE took over annual data collection in 2021, and slight changes in methodology generated a break in the series (with an unexpected jump for Tasmania). Both ABS and BITRE values are shown for 2021. I suggest focus on the gradient of the lines either side of 2021, and try to ignore the step change in 2021.

Here’s an alternative measure that compares registered passenger cars to people roughly of driving age (aged 18-84):

A closer look at more recent trends (except Northern Territory):

In the 12 months to January 2025, all states and the ACT had a small increase in car ownership rates.
A possible explanation for recent trends is that non-car owning temporary immigrants (eg international students) largely disappeared during the COVID19 pandemic (impacting January 2021 and January 2022), and on their return overall ownership rates went down. However it’s less clear to me why ownership rates went up in the year to January 2025.
Tasmania had a large difference in 2021 estimates between ABS and BITRE that seems to be closing so who knows what might be going on there.
Several states appear to have had peaks in car ownership – Tasmania in 2017, Western Australia in 2016, and ACT in 2017.
Motor vehicle per capita in cities (five-yearly census data)
The ABS Census of Population and Housing is conducted every five years and asks people in private dwellings how many motor vehicles were parked at or near the dwelling on census night. I’ve combined this with a count of the population aged 18-84 living in private dwellings who responded to the question about motor vehicles present, to calculate motor vehicles per 100 persons aged 18-84 in Significant Urban Areas.
Here’s a chart showing motor vehicles per capita for Australia’s larger cities (SUAs):
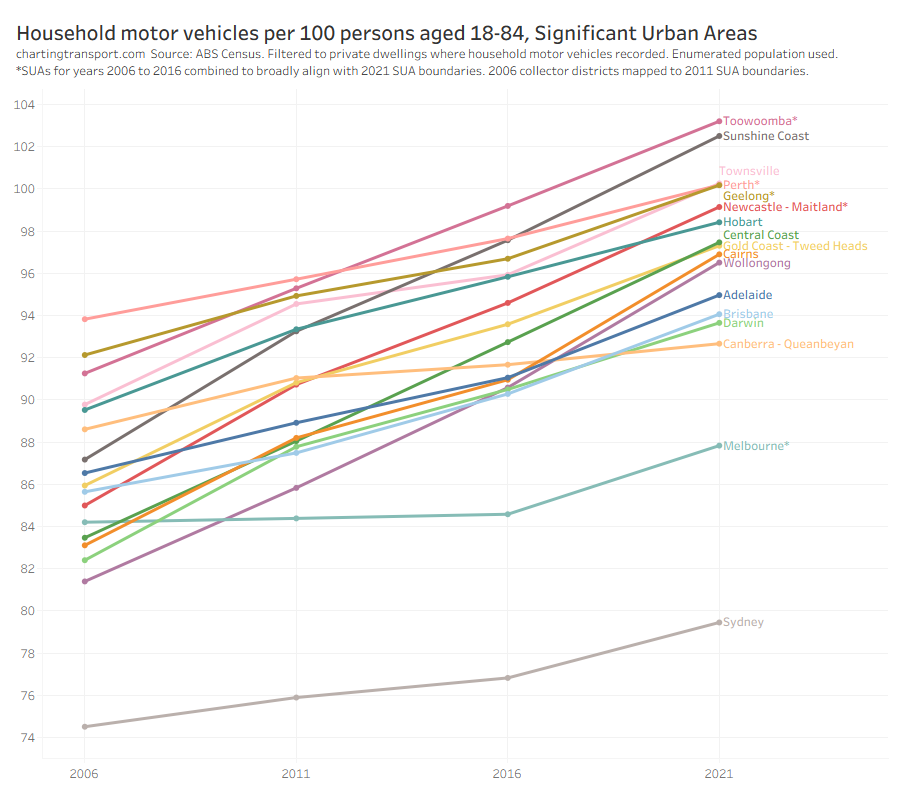
The largest cities of Sydney and Melbourne have the lowest rates of motor vehicles per capita, with Sydney having a much lower rate, almost certainly related to it’s generally higher population density.
The Sunshine Coast, Central Coast, and Wollongong have seen steep rises, while Melbourne and Canberra show periods of very slow growth.
The rates here are sometimes above 100 – suggesting there are more household motor vehicles than adults of driving age, but I suspect it’s an over-estimate, for reasons I will explain below. I suggest focus mostly on the relative differences between the cities.
Here’s the relationship between motor vehicles per capita and total population of those cities between 2006 and 2021 (note a log scale on the X-axis):
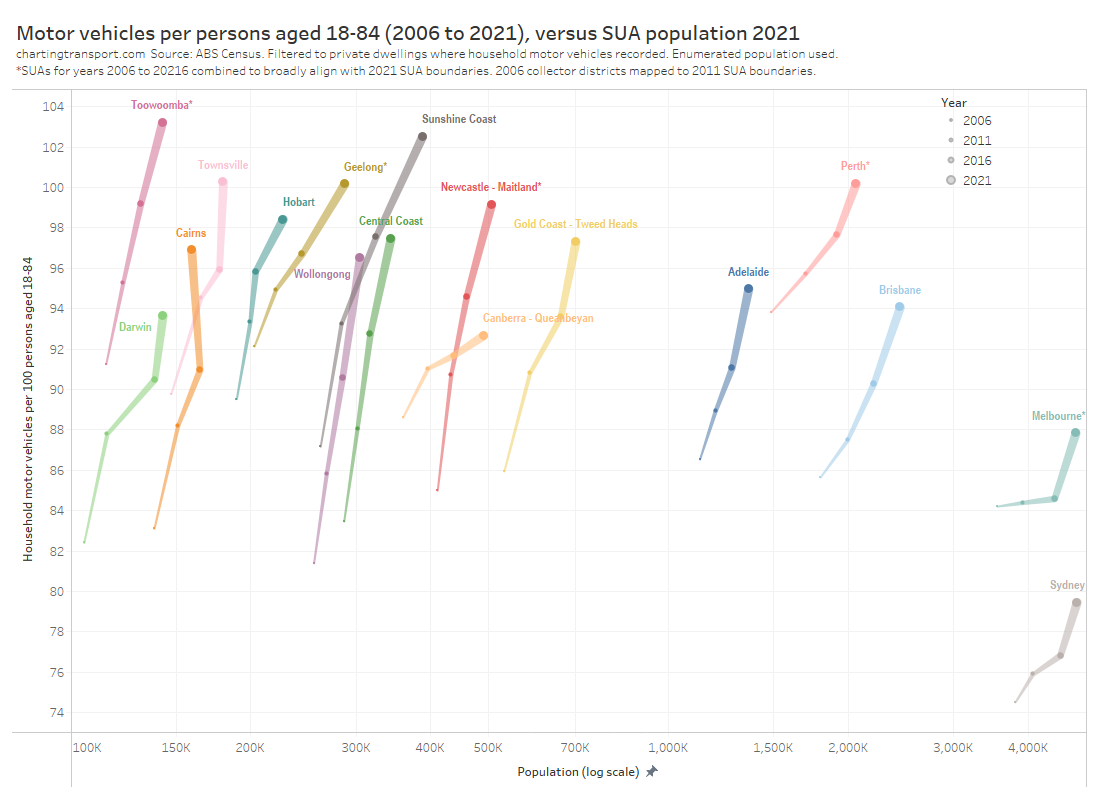
You can more clearly see that the larger cities generally have lower rates of motor vehicles per capita, and slower growth. But Perth is an outlier with a relatively large population and relatively high motor vehicles per capita, suggesting high levels of car dependence.
There are several “medium sized” cities, including Wollongong, Sunshine Coast, Central Coast, and Newcastle – Maitland, that have seen rapid increases in motor vehicles per capita. Most of these cities are also seeing rapid population growth so could be particularly vulnerable to increasing traffic congestion if they continue high levels of private car dependence.
Canberra – Queanbeyan is showing slow growth in motor vehicles per capita and much lower rates than other medium sized cities. This perhaps reflects some recent investment in light rail and increases in housing density. It might also reflect a slightly larger proportion of residents being students.
As mentioned previously, 2021 may have been an outlier for some cities (particularly Sydney and Melbourne) as there was an exodus of temporary immigrants during the COVID19 pandemic, and we know temporary immigrants are much less likely to own motor vehicles (particularly international students). I think it is conceivable that Melbourne and possibly Sydney might see a reduction in motor vehicles per capita between 2021 and 2026.
Boring but important notes about this data
I’ve used ABS defined Significant Urban Areas (SUAs) for the city analysis. The boundaries of SUAs sometimes change over time as cities grow, and also some city-fringe SUAs have been absorbed into a larger city SUA in later years. Perhaps most famously, the SUA of Melton was absorbed into the Melbourne SUA in 2021, which created headlines as Melbourne’s SUA population leapt above Sydney’s SUA population for the first time (Sydney’s population is still bigger if you use other statistical geography).
For this analysis I am retrospectively applying these amalgamations to previous census years so there is more consistency in geography (and it avoids/removes sudden movements in the time series metrics). The absorbed former SUAs are outlined in the following table:
| 2021 SUA | Previous year SUAs now part of 2021 SUA |
|---|---|
| Melbourne | Melton |
| Newcastle – Maitland | Cessnock Kurri Kurri – Weston |
| Geelong | Drysdale – Clifton Springs Ocean Grove – Point Lonsdale Torquay |
| Perth | Ellenbrook Yanchep |
| Toowoomba | Highfields |
SUAs were not part of the 2006 statistical geography, but I have mapped 2006 Collector Districts (CD) to the 2011 SUA boundaries to get the closest possible approximation (50%+ overlap required to include a CD). If SUA boundaries had been drawn for 2006 they might have been slightly smaller in some cases, but the areas that might have been excluded in 2006 would probably have had relatively small population so hopefully unlikely to have a major impact.
The census data reports household motor vehicles as 0, 1, 2, 3, … 29, and “30 or more” for years 2011 onwards, and 0, 1, 2, 3, and “4 or more” for 2006. I have arbitrarily assumed the small number of households reporting “30 or more vehicles” averaged 31 vehicles, and assumed “4 or more vehicles” households in 2006 averaged 4.7 vehicles (which was the national average for households with 4 or more vehicles in 2011).
I have used enumerated population – i.e. the people present on census night – rather than usual population, as the motor vehicle count is the number of vehicles present on census night. If someone took their car away for work/holidays that night it would reduce both the population and vehicle count. But if they left their car at home when travelling, it would distort the ratio.
The census includes company vehicles stored at residential properties as well as many motor vehicles other than cars (eg vans, trucks) but not motorbikes and motor scooters. So it’s definitely not the same as car ownership.
This analysis is slightly different to previous analysis of census data on this blog. In that analysis I used 2011 SUA boundaries for all census years, while analysis on this page allows for changes in SUA boundaries into 2016 and 2021. The previous analysis will have sometimes calculated lower rates of motor vehicles per capita as newer urban fringe areas would have been outside the 2011 boundaries.
Differences between the annual car ownership and five-yearly motor vehicles per capita metrics
You may have noted the five-yearly census motor vehicle per capita rates are much higher than the annual passenger cars per capita rates. There are many likely explanations for these differences.
Firstly, here are reasons why the five-yearly census data would be higher than the annual data:
- Vehicles not classified as “passenger vehicles” such as trucks and vans that are garaged at or near dwellings are counted in the five-yearly census data, but not the annual data. There are probably a lot more utes parked outside people houses than 15 years ago.
- Households not reporting an answer to the census motor vehicles question were excluded from both the population count and the vehicle count. However these households might have much lower motor vehicle per capita rates than the households that did report, creating a bias. It might be that many households which actually had no motor vehicles failed to tick the “none” box or did not write a “0” as their count. It might also be that many non-reporting households are relatively disadvantaged – and have both few motor vehicles and poor response rates (perhaps low levels of education and/or limited English). Indeed:
- The proportion of missing responses is generally higher in both inner city high density areas, and more disadvantaged suburban areas (there’s a significant relationship with IRSAD).
- Response rates were much lower for dwellings in larger flats/apartment complexes. In the 2021 census, 28% of dwellings in buildings with nine or more storeys did not respond, and 17% of those with four to eight stories did not respond. I am guessing most of these dwellings actually had no associated vehicles.
- I suspect a fair few households over-reported their number of motor vehicles.
- For people in flats/apartments with nine or more storeys, 0.08% of these said 30 or more vehicles. I suspect these people did not answer the question in terms of vehicles belonging to them, and instead reported an estimate of total vehicles associated with all residents their building.
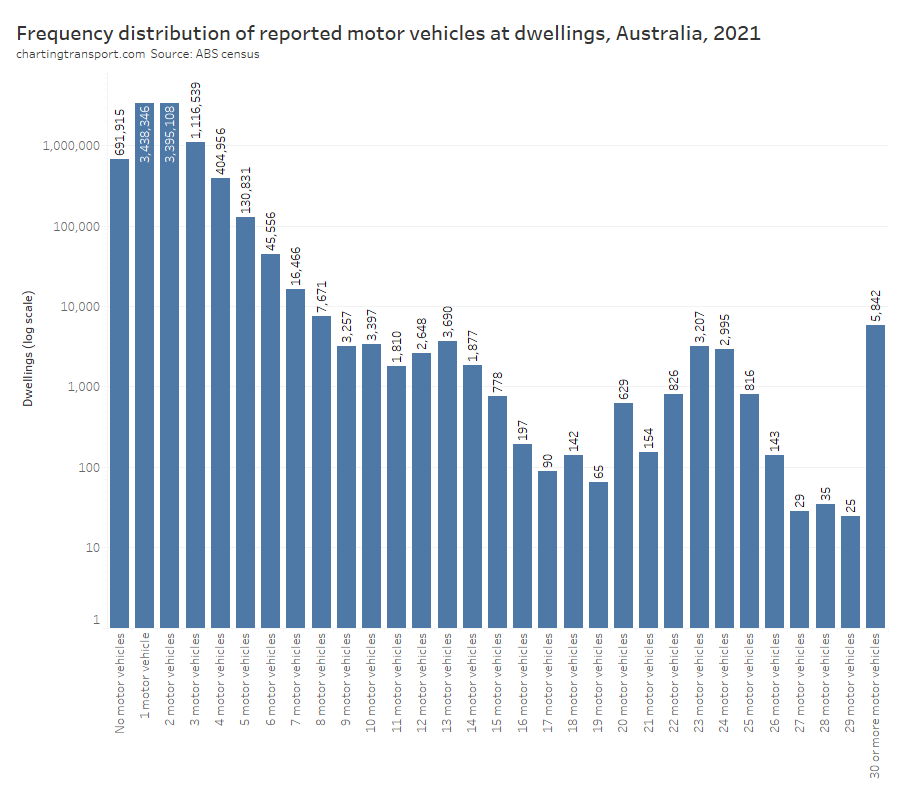
- The frequency of dwellings reporting 12, 13, 23, 24, and 25 vehicles was much higher than other large vehicle counts (see chart below). These are vehicle numbers with a low first digit and a second digit only a little higher. For example, 3207 households reported 23 vehicles but only 65 households reported 19 vehicles. I would have expected a declining frequency of reporting with higher vehicle numbers. Perhaps respondents crossed out an incorrect first single-digit number and then wrote the correct and slightly higher single-digit number next to it, but the ABS did not pick up that the first digit was meant to be disregarded? That could certainly explain the unexpected frequency distribution, and perhaps something for the ABS to watch out for in 2026 (the other “off-trend” dwelling counts were for 10 and 20 vehicles, which I put down to being round number estimates).
- Some people might be have entertained themselves by providing grossly inaccurate answers. I’ve found instances of very high vehicle counts in high density inner city Melbourne areas where it would be almost certainly impossible for most people to store 20+ vehicles (that could alternatively be a misunderstanding of the question, as above).
- People living in non-private dwellings are excluded in the five-yearly census calculations. These include prisons, care institutions such as nursing homes, staff quarters, hostels, hospitals, etc. They are all places where you would expect low or zero motor vehicle ownership for most residents.
But there are also factors which might be working in the opposite direction, but are probably being over-powered by the reasons above:
- Motor vehicle ownership is almost always lower in cities (when compared to areas not in an SUA).
- Passenger vehicles not garaged at private dwellings are included in the register of total passengers vehicles in the state/territory data, but not counted in the five-yearly census.

