Updated December 2025 with data to 2024-25.
Data source: Australian Bureau of Infrastructure and Transport Research Economics (BITRE) Infrastructure and Transport Statistics Yearbook 2025 (published annually in December)
Freight volumes
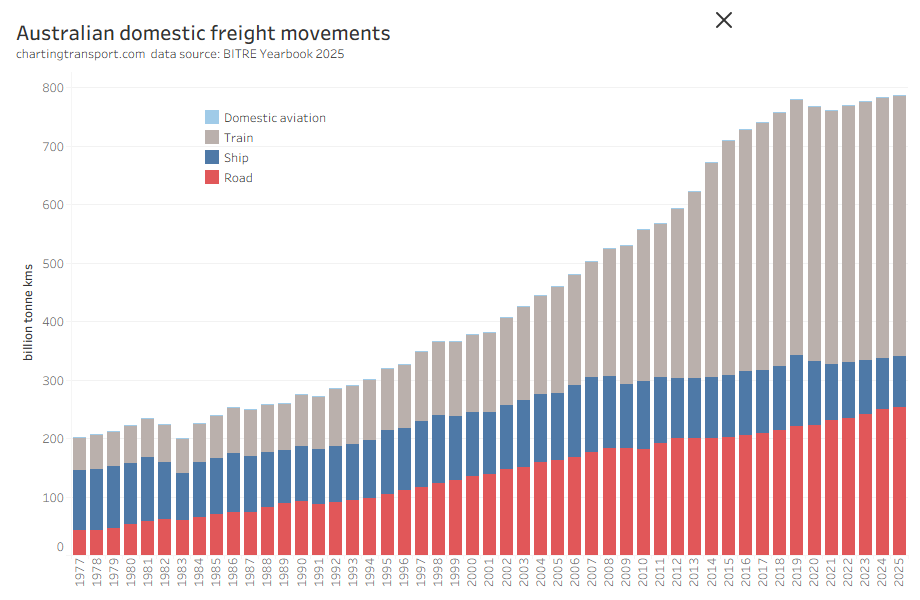
This data shows a dramatic flattening of total freight volumes around 2019, with a lack of growth in rail volumes, a decline in coastal shipping, but ongoing growth in road volumes. Much of this volume is bulk commodities, and so the trends will likely be explained by changes in commodity markets, which I won’t try to unpack.
Was this flattening of freight demand forecast? In 2022, BITRE forecast the total freight task to be 838 btkms in 2025 – 9% higher than 2020. Now the actual volume for 2025 was estimated at 786.5 btkms – only 2.5% higher than 2020.
Here’s a comparison of estimated actual volumes against 2022 forecasts:
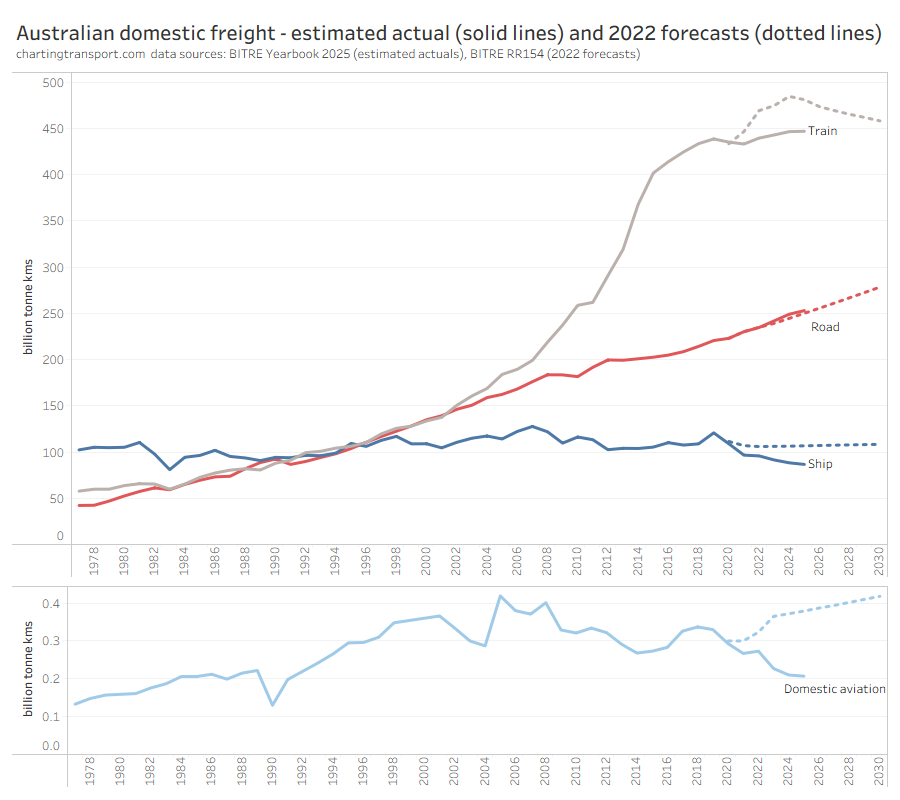
Freight volumes are lower than forecast for shipping, aviation, and rail, but slightly higher than forecast for road.
Non-bulk freight volumes are around a quarter of total freight volume, but are arguably more contestable between modes.

Freight mode split (non-bulk)

In recent years road has been gaining mode share strongly at the expense of rail, peaking at 81% road v 15% rail in 2023-24. This is a worrying trend if your policy objective is to reduce transport emissions as rail is inherently significantly more energy efficient.
Air freight tonnages are tiny in the whole scheme of things so you cannot easily see them on the charts (air freight is only used for goods with very high value density).
Road freight in cities
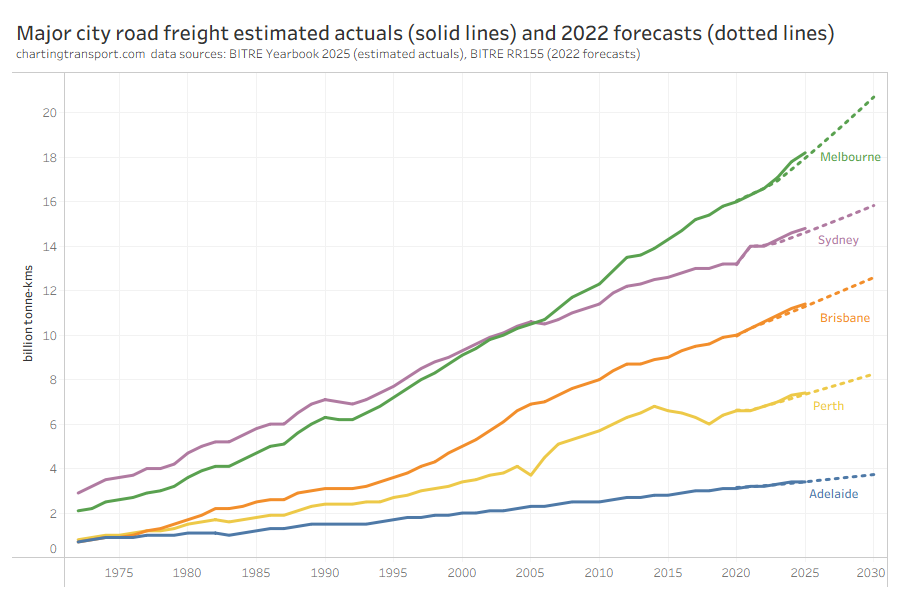
Road freight volumes in the major cities have been growing strongly, and have slightly exceeded BITRE’s 2022 forecasts in the four largest cities (but not Adelaide). Curiously Melbourne has significantly more tonne-kms of freight movements that Sydney, possibly owing to Melbourne’s much larger urban footprint despite having similar populations.
Freight emissions intensity
The following chart combines estimates of freight-related transport emissions with estimates of freight volumes (note the log scale on the Y-axis):
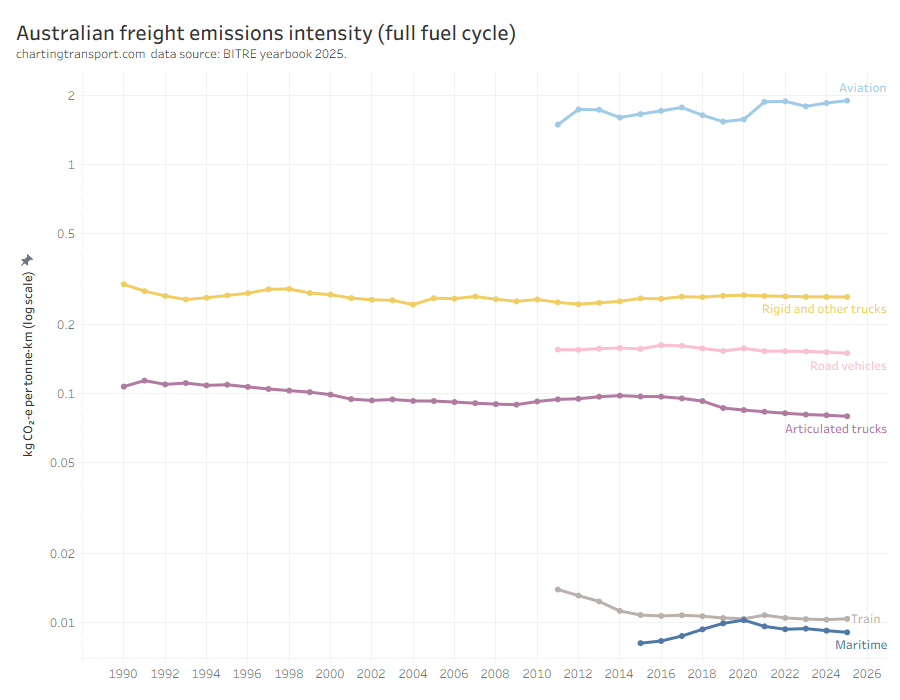
There are orders of magnitude differences in emissions intensity between modes. Aviation (lifting freight into the air at high speed) has the highest emissions intensity, while rail and shipping have the lowest. Road freight emissions intensity is around fifteen times higher than rail. Articulated trucks are much more efficient than rigid trucks, and their emissions intensity has been declining over time – presumably as trucks get larger – but not getting anywhere close to rail.

