Updated December 2025 with km data to 2024-25.
Data sources:
- Australian Bureau of Infrastructure and Transport Research Economics (BITRE) Infrastructure and Transport Statistics Yearbook 2025
- ABS Regional Population (latest data released in March 2025 for June 2024)
Here are passenger kilometres travelled overall (log scale):
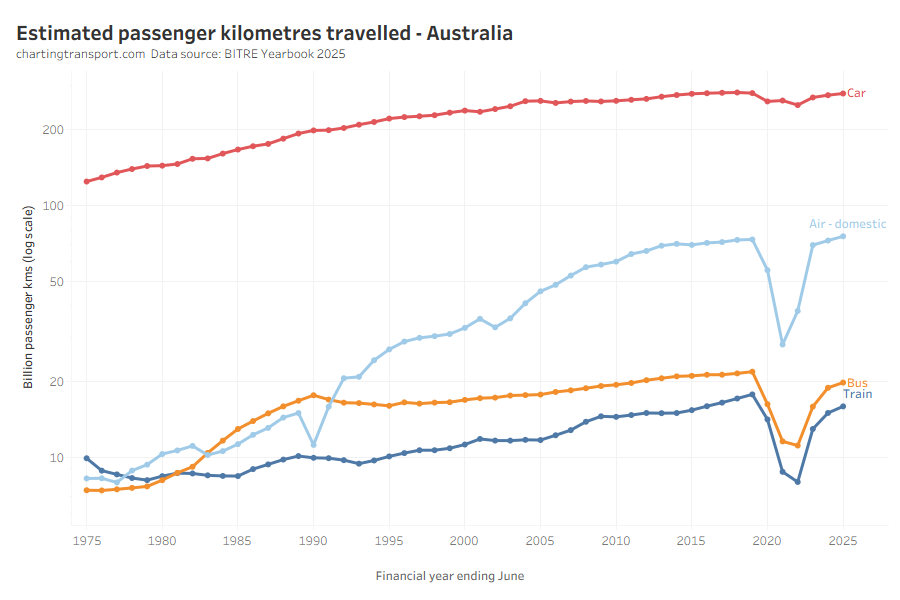
The pandemic had the biggest impact on rail, bus, and aviation passenger kilometres. Aviation has bounced back to pre-COVID levels while train and bus are still down (probably due to working from home patterns, reduced total bus vehicle kilometres, amongst other reasons).
Here is the same on a per-capita basis which shows very similar patterns (also a log scale):
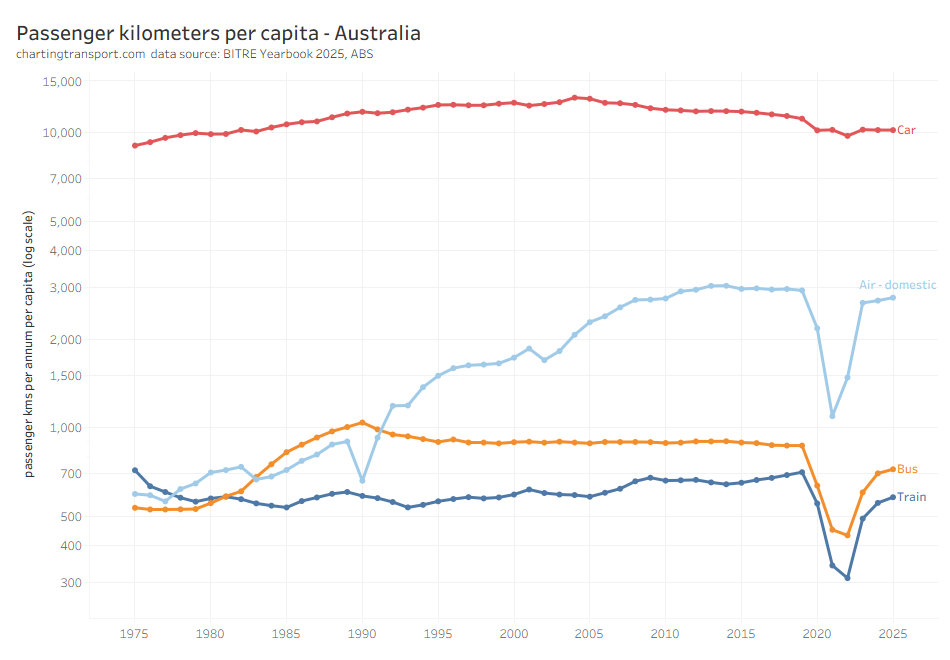
Car passenger kilometres per capita have reduced from a peak of 13,184 in 2004 to 10,238 in 2024-25.
Curiously aviation passenger kilometres per capita peaked in 2014, well before the pandemic. Rail passenger kilometres per capita in 2019 were at the highest level since 1975.
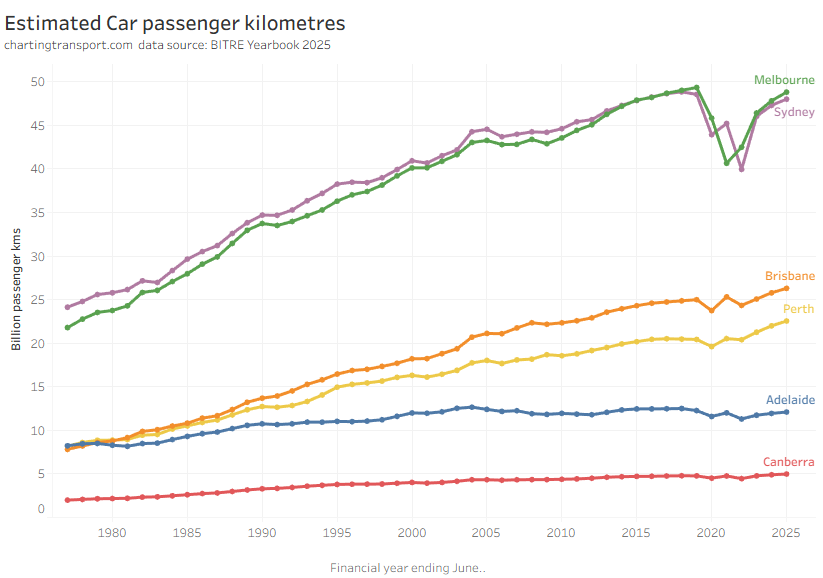
The COVID19 pandemic certainly caused some fluctuations in car passenger volumes in all cities for 2019-20 to 2021-22.
In 2024-25, Sydney and Melbourne had still not recovered to pre-pandemic levels, while Perth and Brisbane hit new highs.
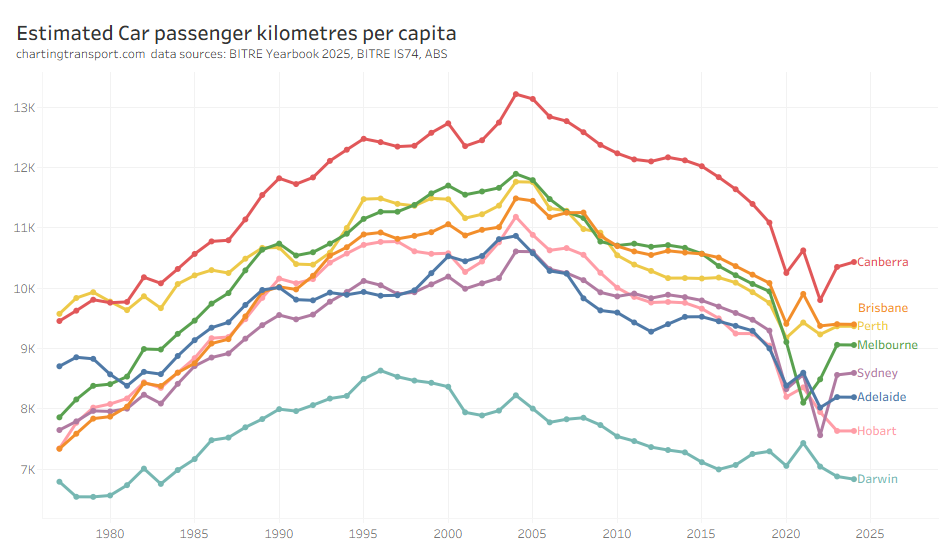
Car passenger kilometres per capita peaked in 2004 in most cities.
Following the pandemic, car passenger kilometres per capita have bounced back in Sydney, Melbourne, and Canberra – however most cities had 2022-23 figures that were in line with a longer-term downward trend if you disregard the COVID years. Between 2022-23 and 2023-24, car passenger km per capita was pretty much unchanged in most cities.
For public transport passenger kilometre analysis, see Trends in public transport patronage.
Technical note: Population for each financial year (FY) has been calculated as the average population across the middle of each quarter where quarterly data available (1982+), otherwise the average of the population at each end of the FY (pre 1982). In other words, the best possible representation of average population across the FY.

