Update December 2023 with data up to September 2023.
Data source: ABS Consumer Price Index data (refreshes quarterly, but I plan to update annually)
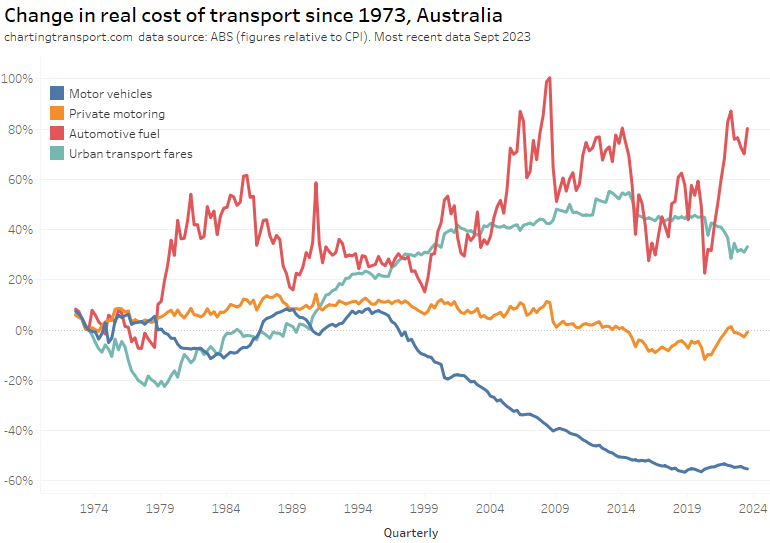
Technical note: Private motoring is a combination of factors, including motor vehicle retail prices and automotive fuel.
The cost of motor vehicles was in decline from around 1995 to 2018 and has been stable or slightly rising since then. Automotive fuel has been volatile, which has contributed to variations in the cost of private motoring.
Urban transport fares (a category which unfortunately blends public transport and taxis/rideshare) have increased faster than CPI since the late 1970s, although they were flat in real terms between 2015 and 2020, then dropped in 2021 and 2022 in real terms – possibly as they had not yet been adjusted to reflect the recent surge in inflation. They picked up slightly in 2023.
The above chart shows a weighted average of capital cities, which washes out patterns in individual cities. Here’s a breakdown of the change in real cost of private motoring and urban transport fares since 1972 by city (note different Y-axis scales):
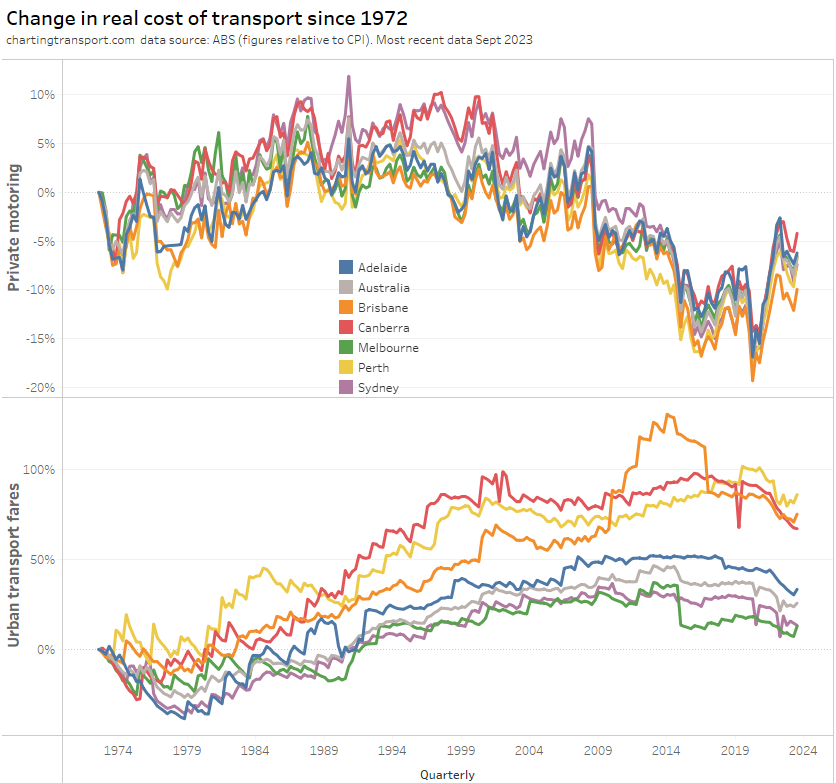
Technical note: The occasional dips in urban transport fares value are likely related to periods of free travel – eg May 2019 in Canberra.
The cost of private motoring moves much the same across the cities.
Urban transport fares have grown the most in Brisbane, Perth, and Canberra – relative to 1972. However all cities have shown a drop in the real cost of urban transport fares in June 2022 – as discussed above.
If you choose a different base year you get a different chart:

What’s most relevant is the relative change between years – e.g. you can see Brisbane’s experiment with high urban transport fare growth between 2009 and 2017 in both charts.
Melbourne recorded a sharp drop in urban transport fares in 2015, which coincided with the capping of zone 1+2 fares at zone 1 prices.

