In the last few months I’ve been updating the Trends pages on Charting Transport with new data from BITRE, ABS, and other sources. This post provides summary charts across numerous aspects of transport with links for further detail.
The charts below are current at the time of this post, but I will be updating the charts on the Trends pages periodically (mostly 2-4 times per year), so go to those pages if you want to be sure you have the latest charts.
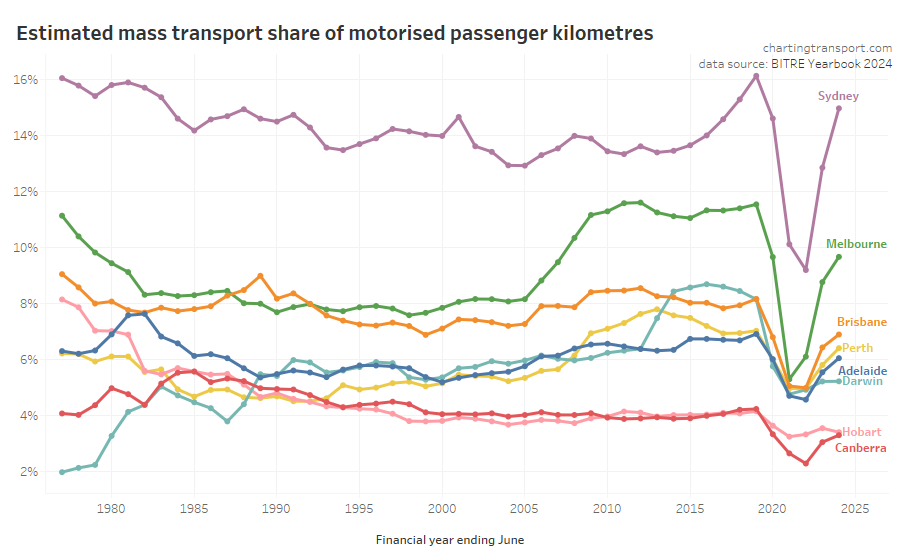
Mass transit mode shares bounced back a fair bit in 2023-24, although only Sydney appears to be close to pre-pandemic levels. Mass transit mode shares are below pre-pandemic levels presumably at least partly because of working from home.
More on trends in passenger travel mode split.
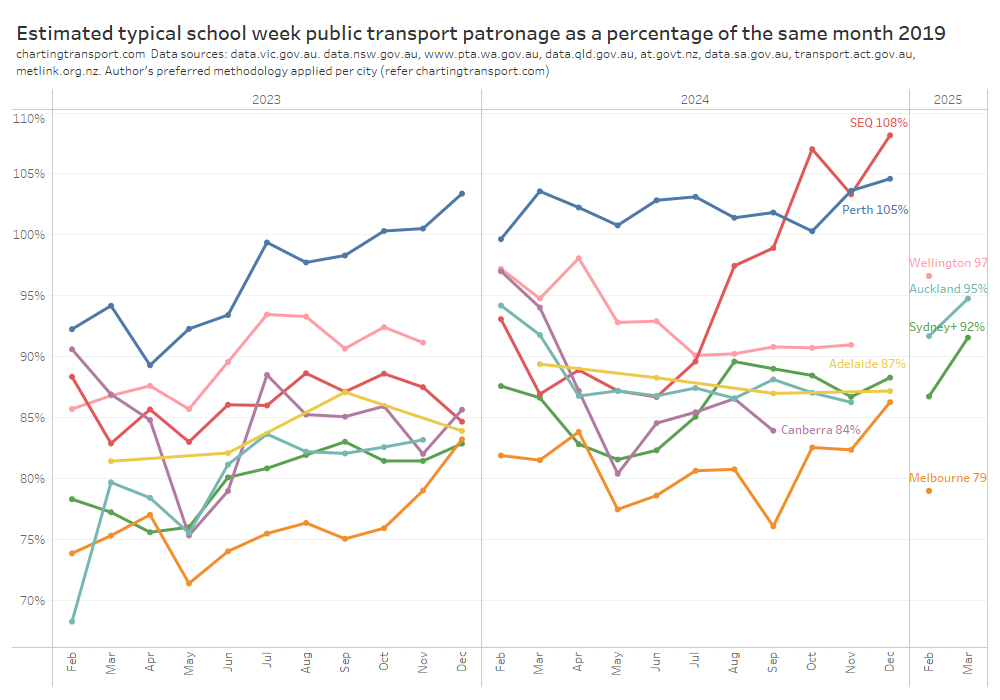
Public transport patronage has risen significantly in South East Queensland (followed a massive fare reduction). Perth is the only other city to have exceeded 2019 patronage levels so far.
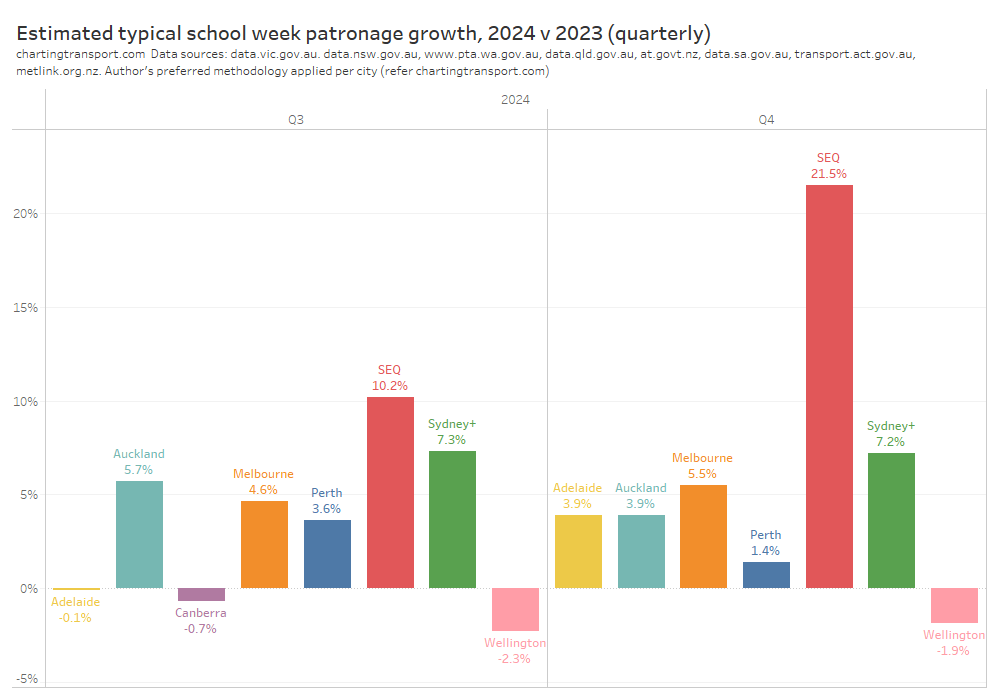
Patronage growth has slowed in most cities, but as of 2024 Q4 was still tracking above population growth in most cities (except Perth and Wellington).
More detailed trends in public transport patronage.
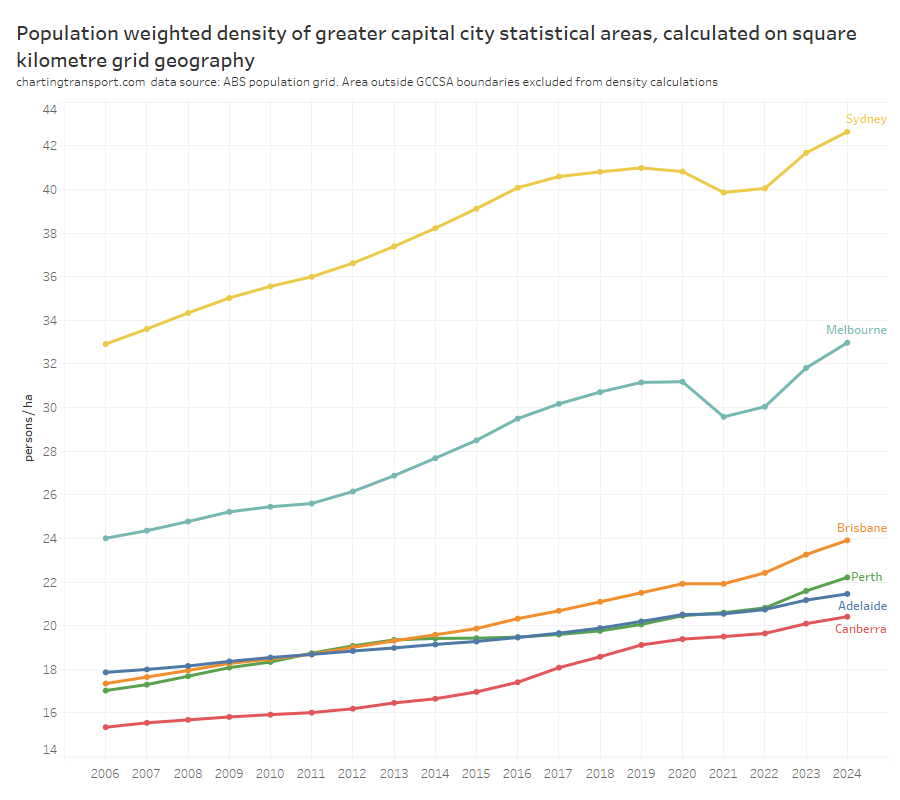
Population density is now rising rapidly in Australia’s largest cities, with Perth pulling ahead of Adelaide.
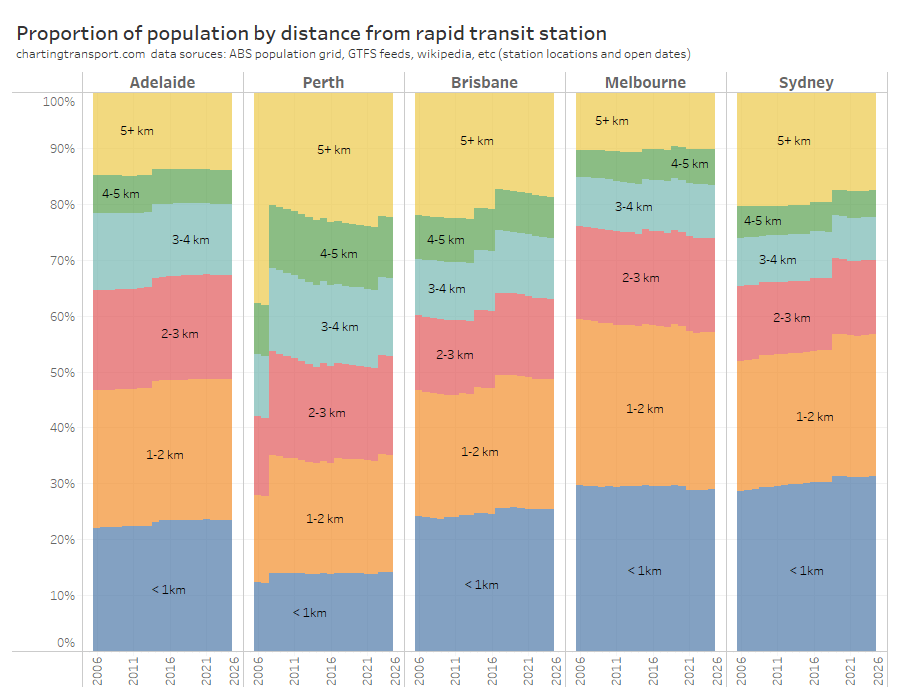
Most cities are improving the share of their population living close to stations over time. You can see the impact of opening new train lines/stations in several cities.
I’ve also created some new animated density maps for each city (2006 to 2024). Here’s Melbourne:
More on trends in density of major Australian cities (including animated density maps for other cities).
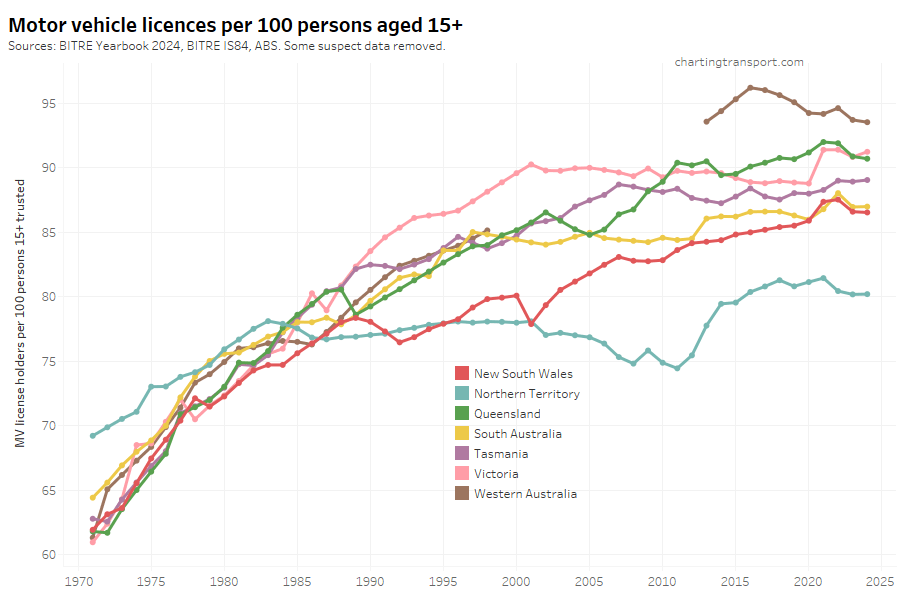
In 2023-24, driver’s licence ownership rates were flat in most states and territories.
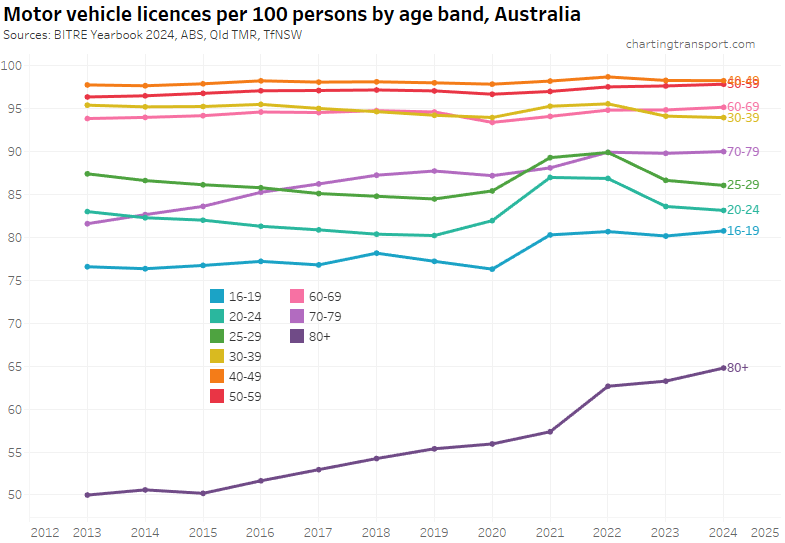
Motor vehicle licence ownership rates have varied by age group:
- For those in their 20s, licence rates were declining but then peaked during pandemic as a lot of temporary residents left. It has since gone back into decline, but is above 2019 levels.
- Licence ownership rates for teenagers jumped in 2021 but have been relatively flat since then.
- Licence ownership rates for older Australians continue to increase (especially for those aged 80+)
More on driver’s licence ownership.
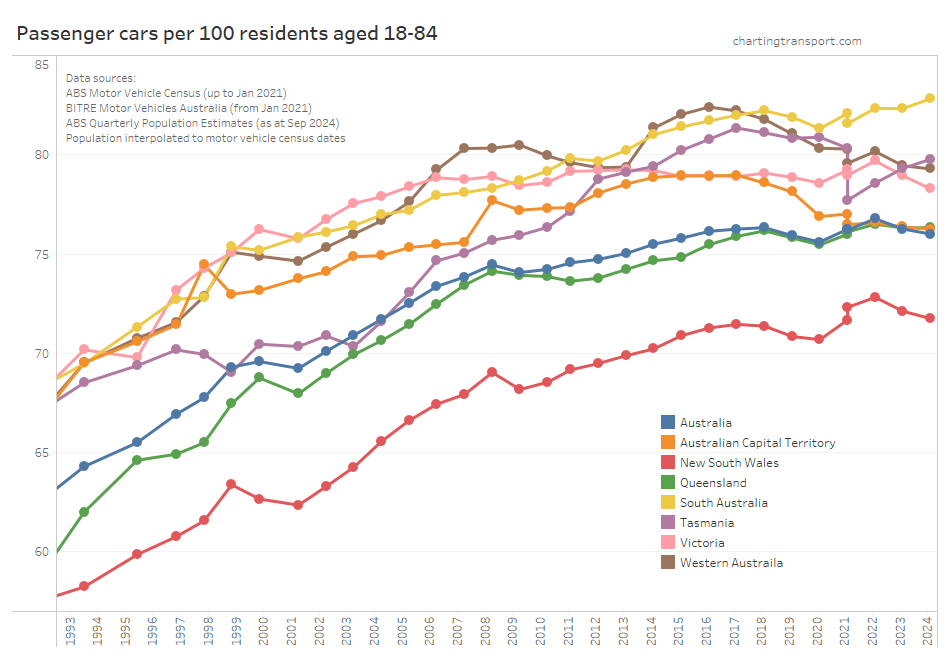
New South Wales, Victoria, and Western Australia saw a slight decline in motor vehicle ownership rates in the year to January 2024. Tasmania and South Australian were up, while ACT and Queensland were flat.
More on motor vehicle ownership rates.

Motor vehicle kilometres travelled was flat in most cities in 2023-24.
More on vehicle kilometres travelled and passenger kilometres travelled.
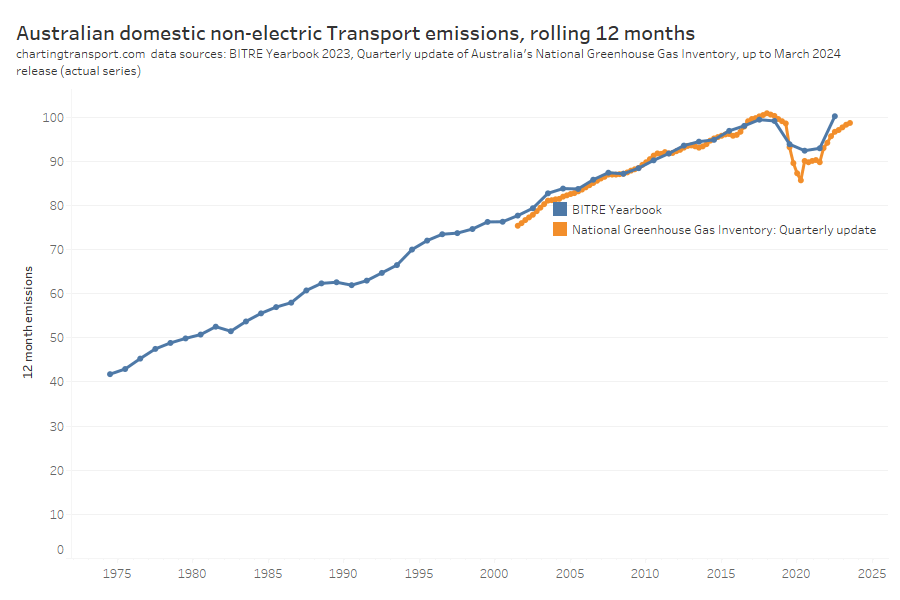
Non-electric transport greenhouse gas emissions are growing and are back around pre-pandemic levels.

Domestic aviation, truck, and light commercial vehicles emissions are higher than ever.

Only small improvements in emissions intensity are being made in Australia.
More on trends in transport emissions.
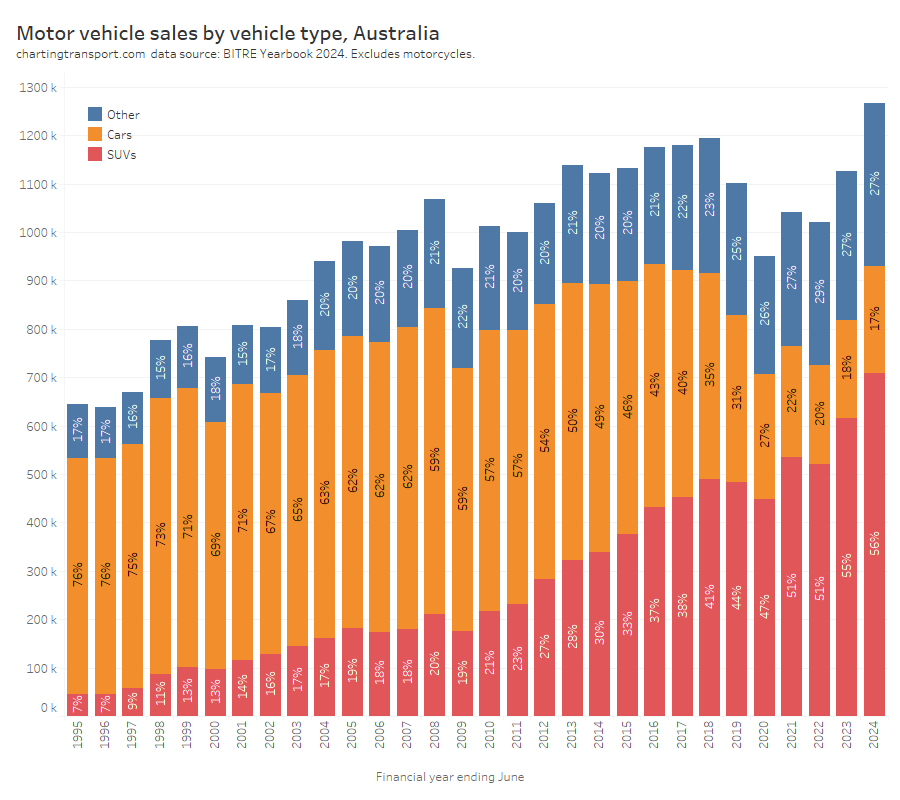
2023-24 was a record year for motor vehicle sales, with SUVs continuing to take a larger share of sales.
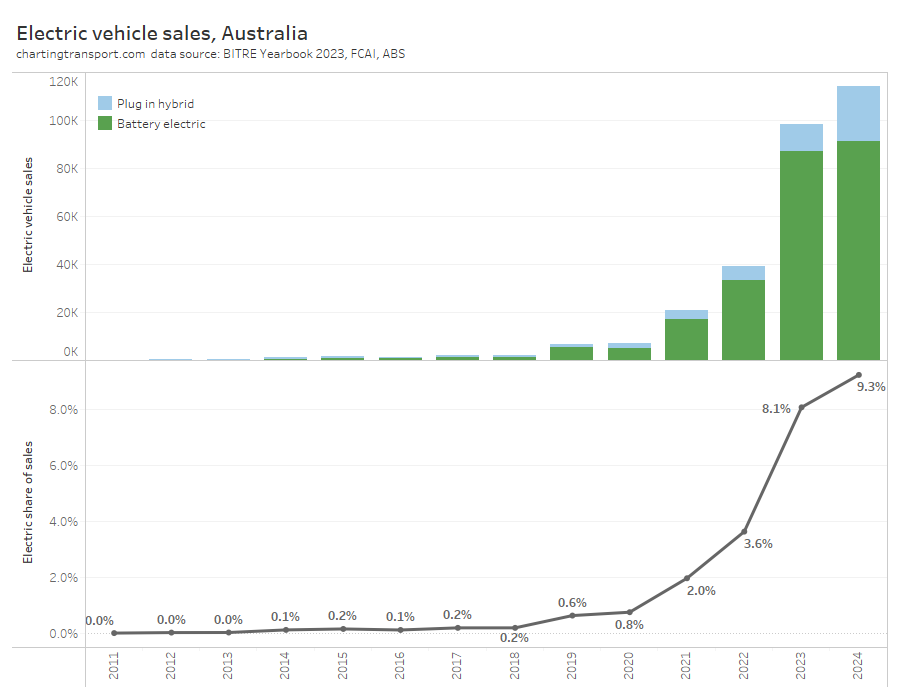
Electric vehicles continued to increase their share of all vehicle sales, although the rate of increase slowed in calendar 2024.
More detail on motor vehicle sales.
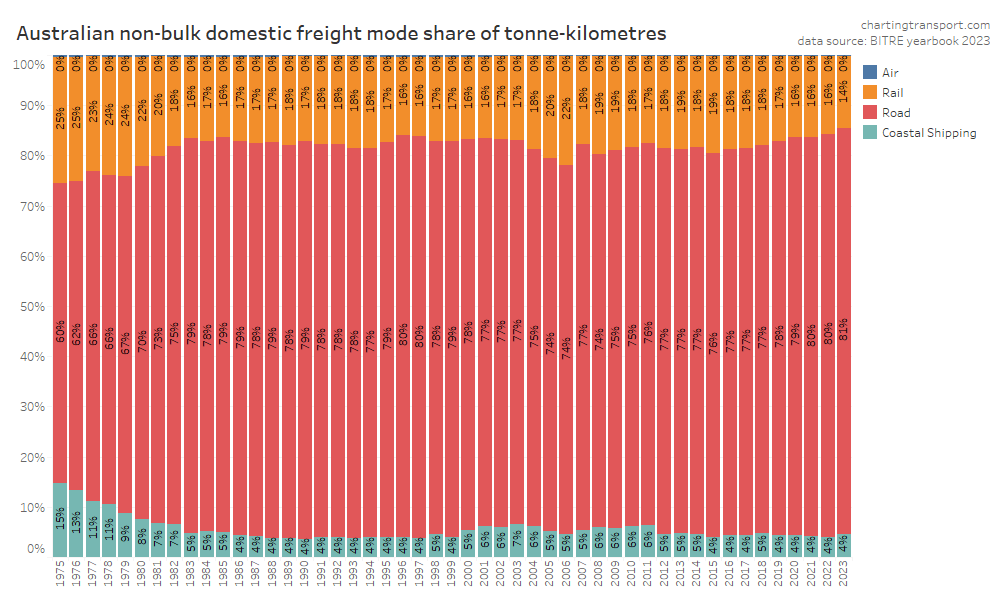
Rail is continuing to lose mode share of non-bulk freight movements.
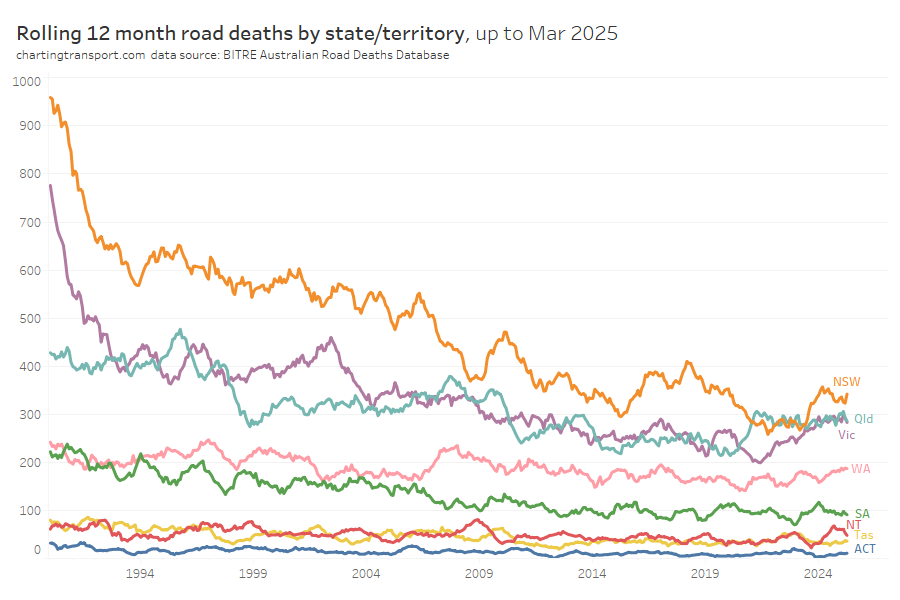
Road deaths have unfortunately not been trending downwards in recent times.

