Updated January 2026 with data to June 2025.
Data sources:
- Australian Bureau of Infrastructure and Transport Research Economics (BITRE) Infrastructure and Transport Statistics Yearbook 2025 (published annually, usually in December, with data from 2010)
- BITRE’s Information Sheet 84 (IS84) (once-off publication with data to 2018)
- Queensland and New South Wales state agency published data
- ABS Population data by state/territory
Note: data quality is a significant issue in this field. I’ve spent way more time that I planned investigating these issues and I’ve done my best to filter out suspect data. I’ve also made some adjustments where there are obvious corrections (Queensland BITRE table 4.10), made judgements about which data sources are probably more reliable where they conflict. But there are likely to be some instances of suspect data unfiltered in the charts below.
In particular it is unclear whether jurisdictions have double-counted people owning multiple licences – particularly car/truck and motorbike licences. It’s probably safer to look at trends for states, rather than compare states.
For more commentary on data quality, see a state-by-state assessment at the end of this post.
Total licence ownership
The first chart shows motor vehicle licence ownership for people aged 15+ from 1971. Note these counts include learner permits, and in some states will have extra counts for motorcycle licences and heavy vehicle licences. My best guess from reconciling the available data tables is that it excludes motorcycles for at least the Northern Territory, Queensland, Tasmania, and Victoria.
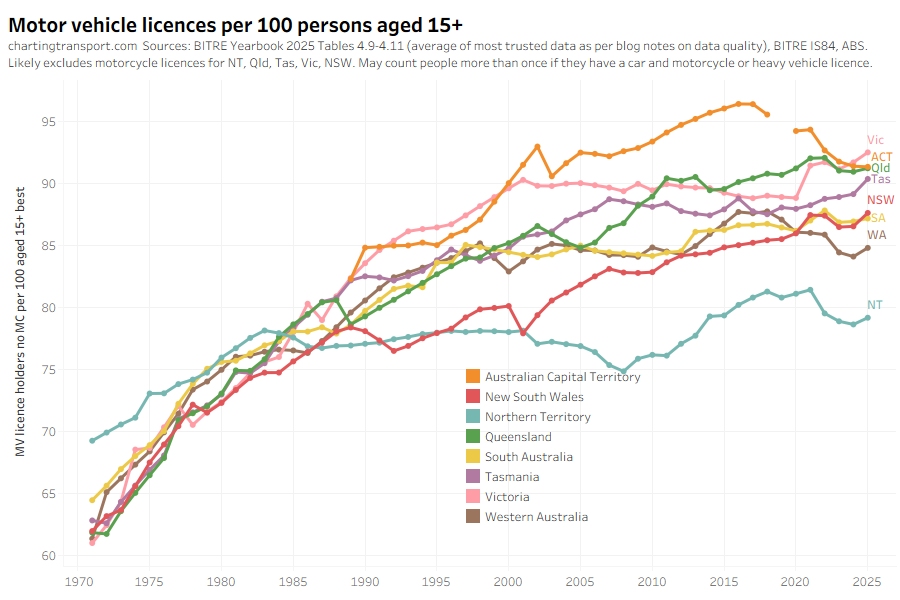
Licence ownership rates have fluctuated in many states since the COVID19 pandemic hit, most notably in Victoria and NSW which saw a big uptick in 2021 (more on that below).
Between June 2024 and June 2025, all jurisdictions reported an uptick in licence ownership (less so in South Australia and ACT).
Full car licence ownership
The next chart compares “full” licence ownership to people of an age eligible for a full licence (there’s no point counting people ineligible, but this also does not exclude very old people). I have not accounted for any changes in eligibility over time (although graduated licensing started in many states between 2000 and 2007 – before the data set commences).
Data quality note: I strongly suspect there is double counting of persons for Victoria and maybe also the ACT, but not other states. Also, the Victorian metric only encompasses people aged 22+, the highest threshold of all states because of its graduated licensing scheme. Furthermore, I have subtracted motorcycle licences from car licences for Queensland as this produces much more plausible figures. So be careful comparing states.
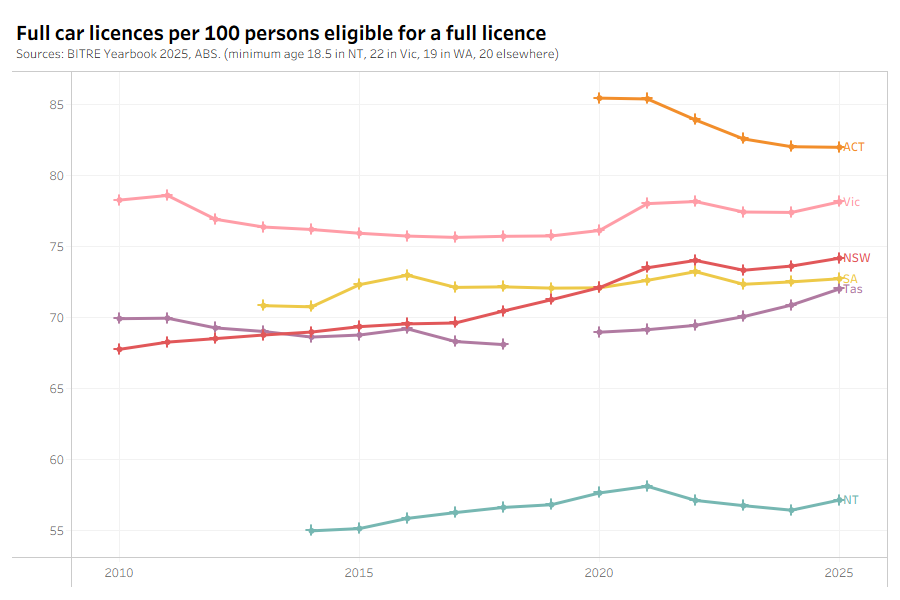
These rates are lower than in the first chart, as the first chart likely includes people with motorcycle and/or truck licences. Unfortunately I don’t trust the available data for Queensland and Western Australia.
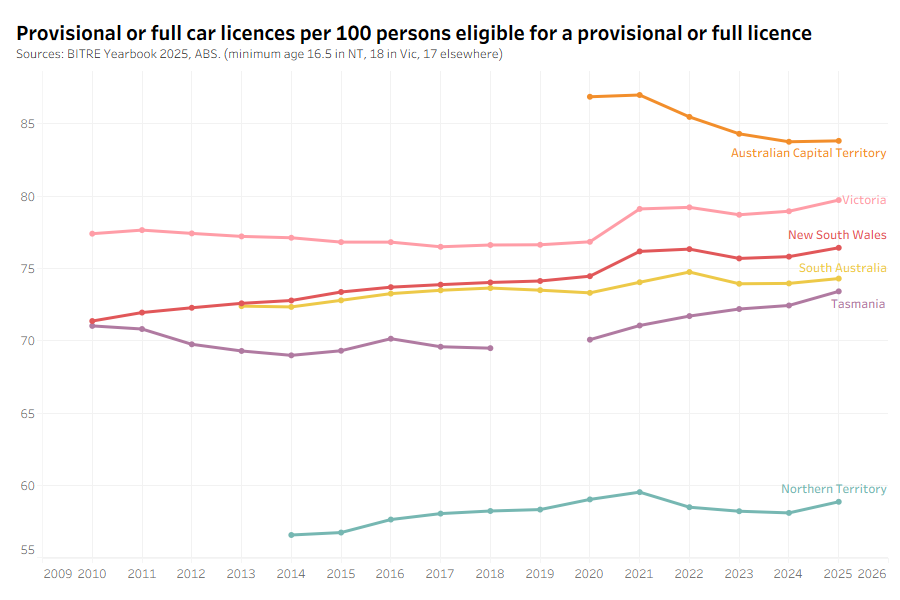
Similarly here’s a chart showing the ownership rate of a full or provisional licence for people of an age eligible for full or provisional licence:
Licence ownership by gender
The following chart uses data sourced from tables 4.9 and 4.11 (with suspect data removed). I am moderately confident this chart is not double counting people with both a car and heavy vehicle licence, although the ACT rates go above 100 so something must be happening there.
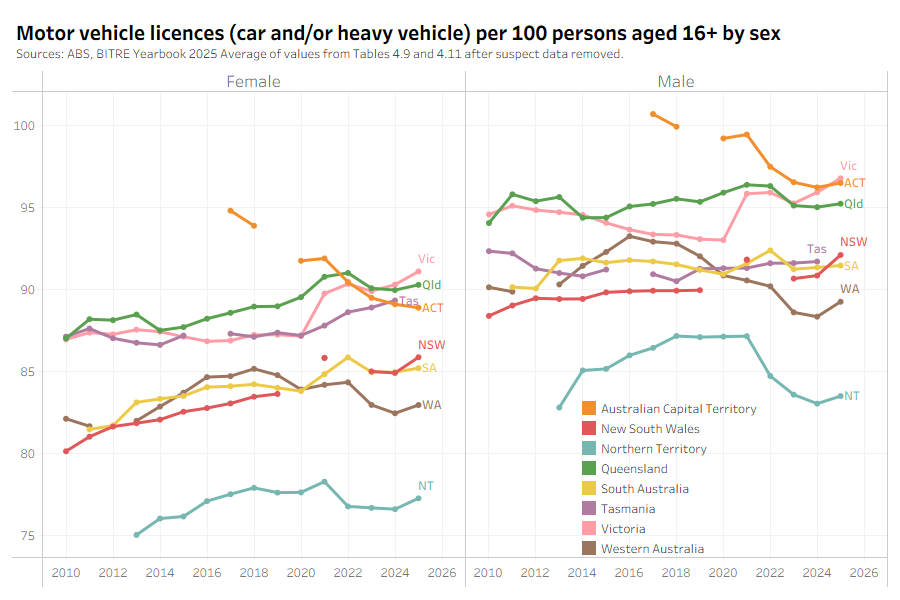
Licence ownership is higher for males in all states and territories, but the gap has been narrowing as females trend up while males roughly trend flat. The data suggests Tasmania has the smallest gap (less than 3%).
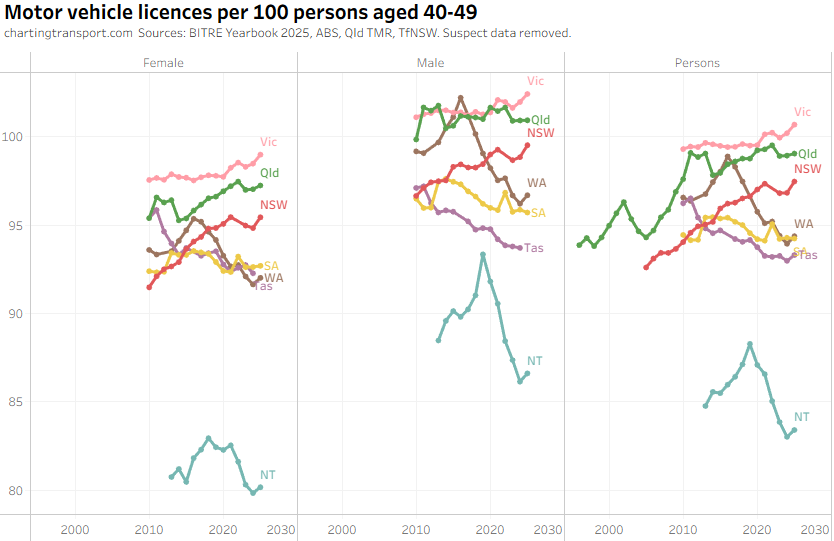
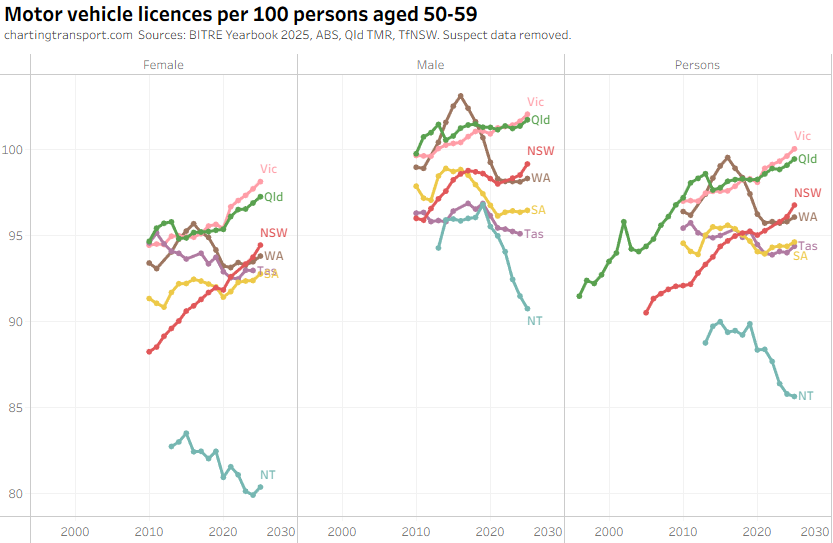
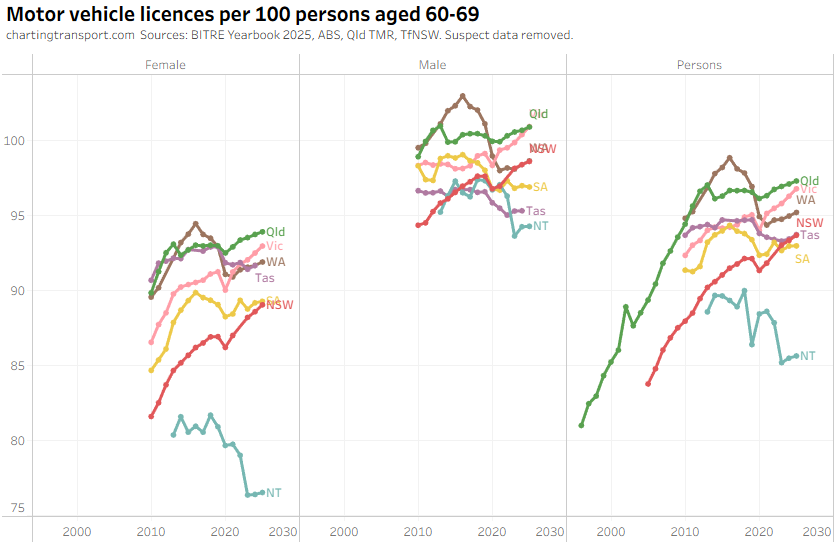
Licence ownership by age and sex
(note: there are a lot of charts in this section and I don’t have time to pull apart overlapping series labels in each one, sorry).
Firstly, here’s a look at each state/territory:
For New South Wales I’ve used data from Transport for NSW website where the BITRE data is different and otherwise suspect. Unfortunately, there is no good data available for June 2022. Also, the TfNSW age bands for data after 2022 differ from the age bands BITRE use, so you’ll see a bit of a mess of overlapping age bands available for different years.
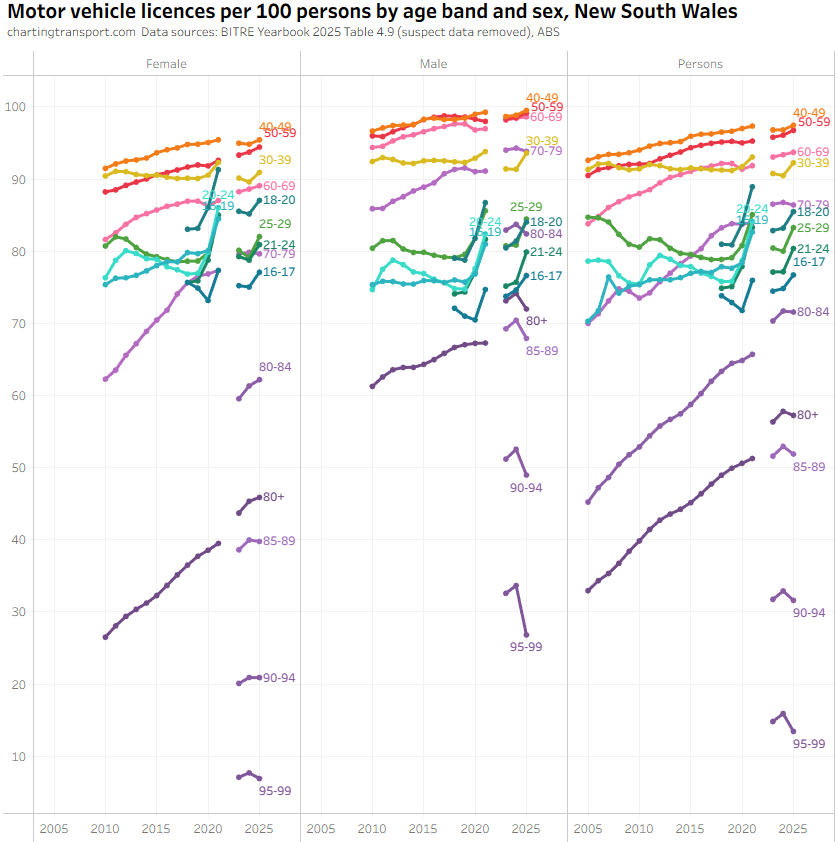
I haven’t compiled every year of per-sex data from TfNSW – unfortunately the most useful data is also the most difficult to extract from their website (the data that is readily available to download is problematic and unusable).
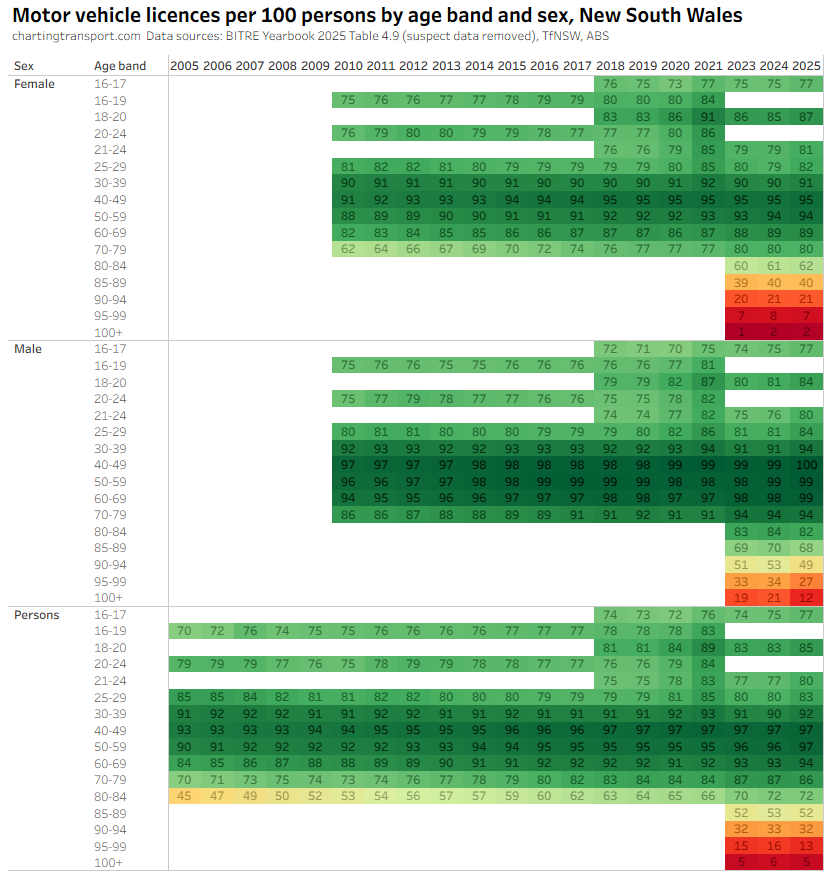
That chart above is pretty messy, so here’s an alternative heatmap representation in case you find this easier:
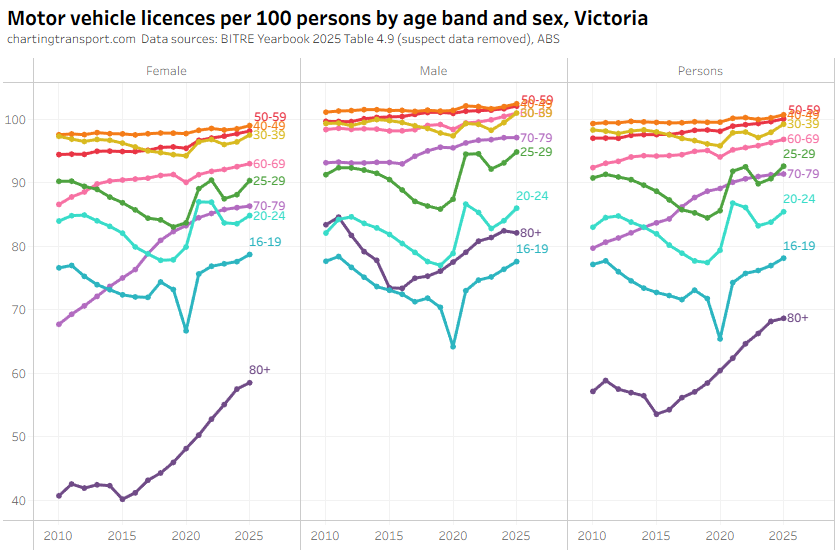
Victoria saw a sharp decline for ages 16-19 to June 2020, followed by a bounce back to a higher rate in 2021, probably because licence testing was suspended during the pandemic.
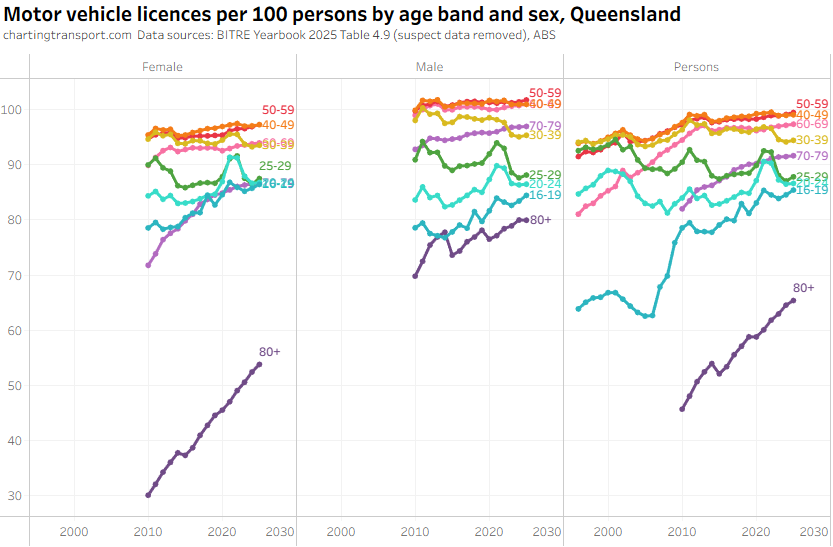
(additional data from Transport and Main Roads, Qld)
The ever increasing licensing rate for 20-24 females looks a bit suspect, and I’ve filtered out a lot of suspect 2025 data.
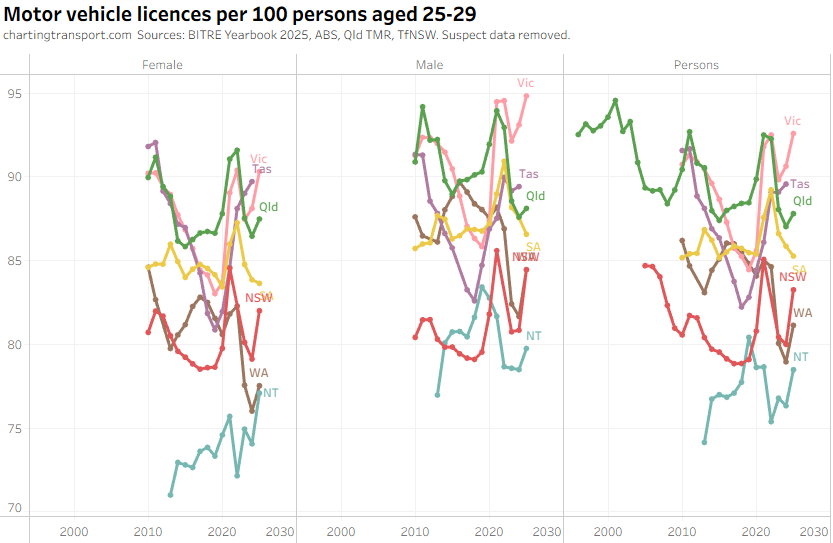
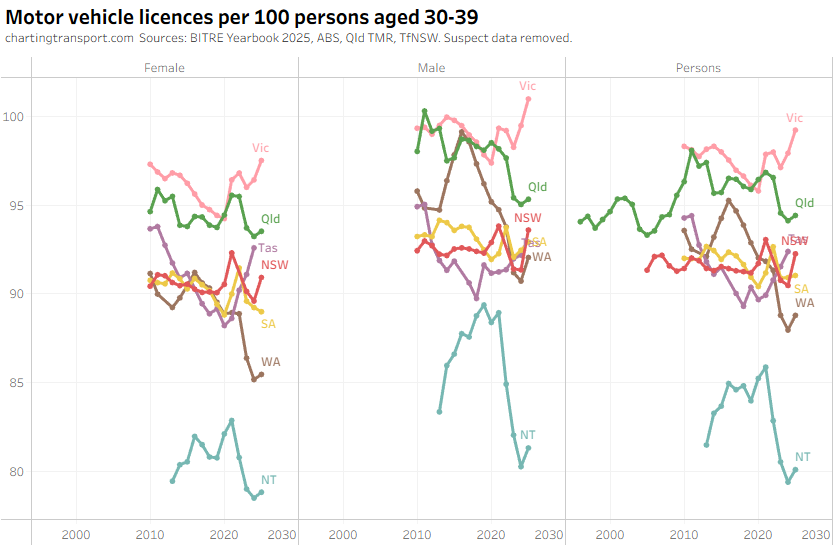
Now let’s step through the age bands and compare the states (note: recent NSW data is missing from the lower age band charts due to lack of comparable reliable data):
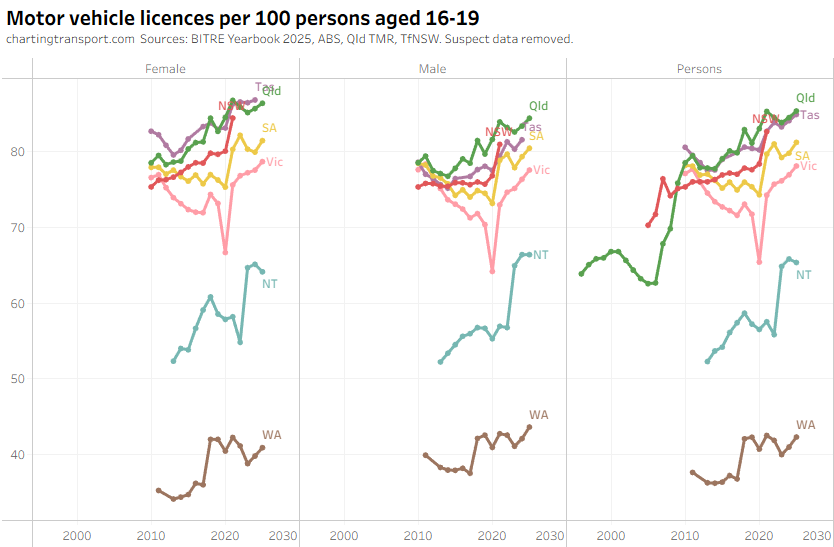
Victoria had the biggest drop in 2020, probably due to more severe lockdowns during COVID. South Australia also showed a dip in 2020, but other states and territories did not drop much in 2020, and most rose strongly in 2021.
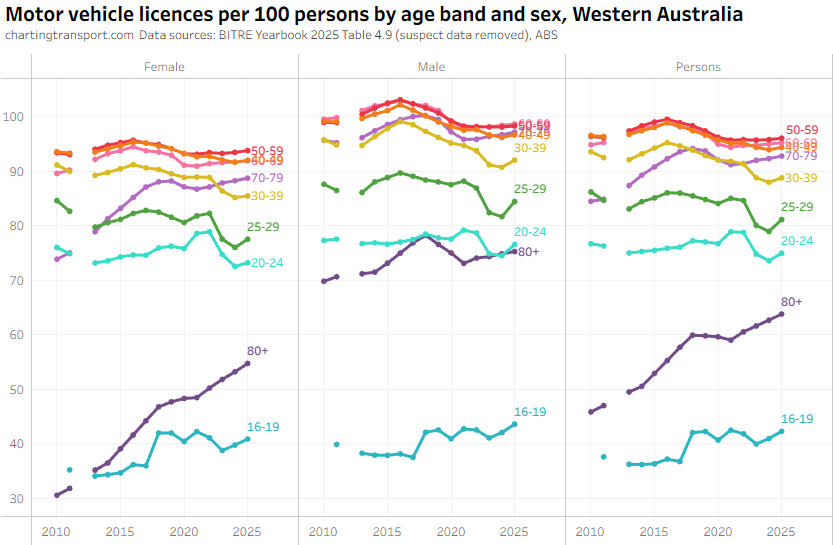
There were some changes to licensing in WA in 2017 but it’s not clear to me why this led to increased licence ownership rates, as learners permits were still available from 16 years, and provisional licences from 17 – according to Wikipedia at least.
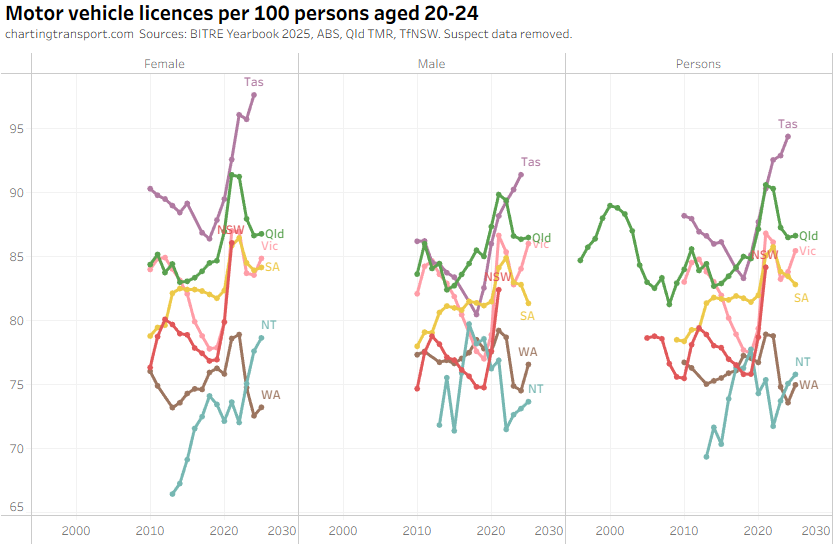
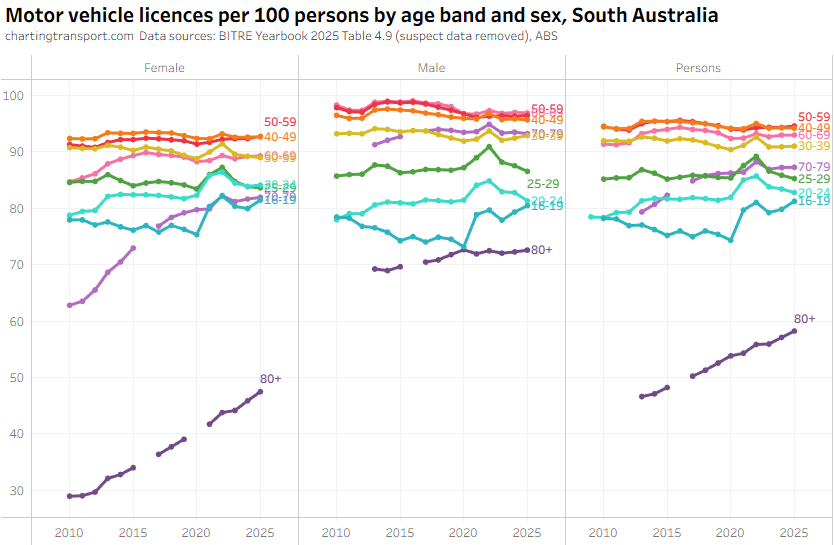
For 20-24 year old0,s the pandemic caused big increases in the rate of licence ownership in most states, however Victoria, South Australia, and Western Australian appear to have peaked.
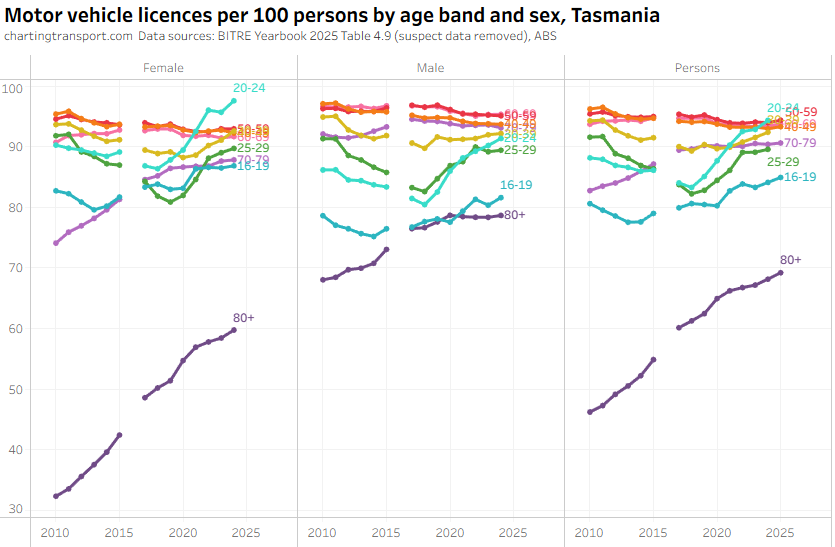
It’s difficult to explain the dramatic rise in licence ownership for Tasmanian women aged 20-24.
In a section below I discuss the surges in young adult licensing rates during the COVID19 pandemic.
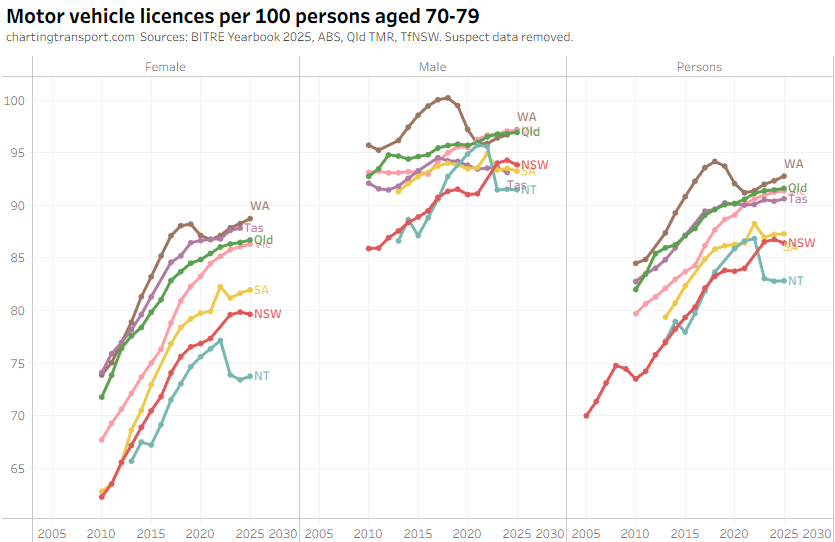

There’s a very clear trend in increasing licence ownership for those aged over 70 across Australia.
But this got me thinking – with big rises in licence ownership rates for higher age bands, are rates of licence ownership still declining for people as they age?
I can roughly convert age bands into birth years, and for those born in the 1940s to early 1950s, we have their licence ownership rates for when they were 60-69 and again when they were 70-79. Here’s how the licence ownership rate has changed for these people (plus immigrants, minus deaths and emigrants) over time:
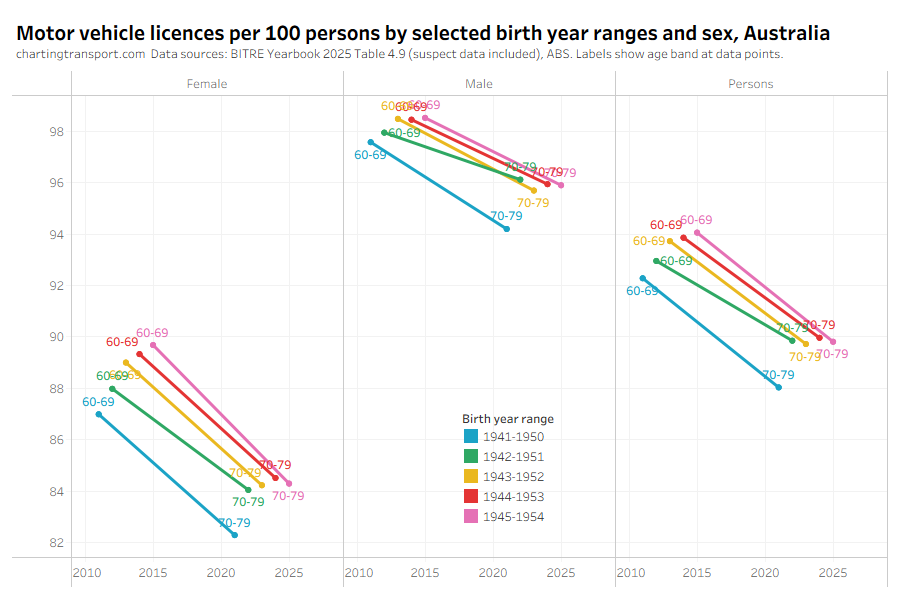
This chart shows that licence ownership rates have indeed been declining as people age. This, coupled with the fact that licencing rates have increased for people in the 70-79 age band over time, suggests that the rate of licence loss as people age has been slowing – i.e. people have been holding on their licences until later in life.
What happened to young adult licencing rates during the pandemic?
One trend I identified a few years ago was that the increasing rate of licence ownership during the pandemic seemed to largely caused by declining population in these age bands during the pandemic period when temporary migrants were advised to go home, and immigration almost ground to a halt. Most of the population exiting were those without a licence, while the number of licence holders remained fairly steady.
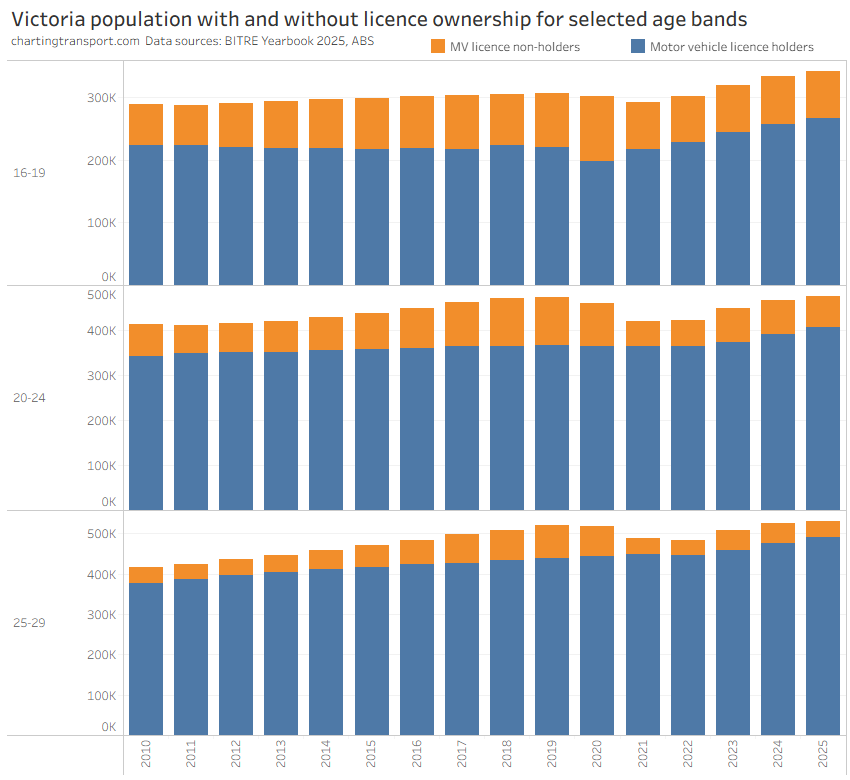
Therefore, for Victorians in their 20s, the increase in the licence ownership rate during the pandemic is mostly explained by a loss of licence non-holders:
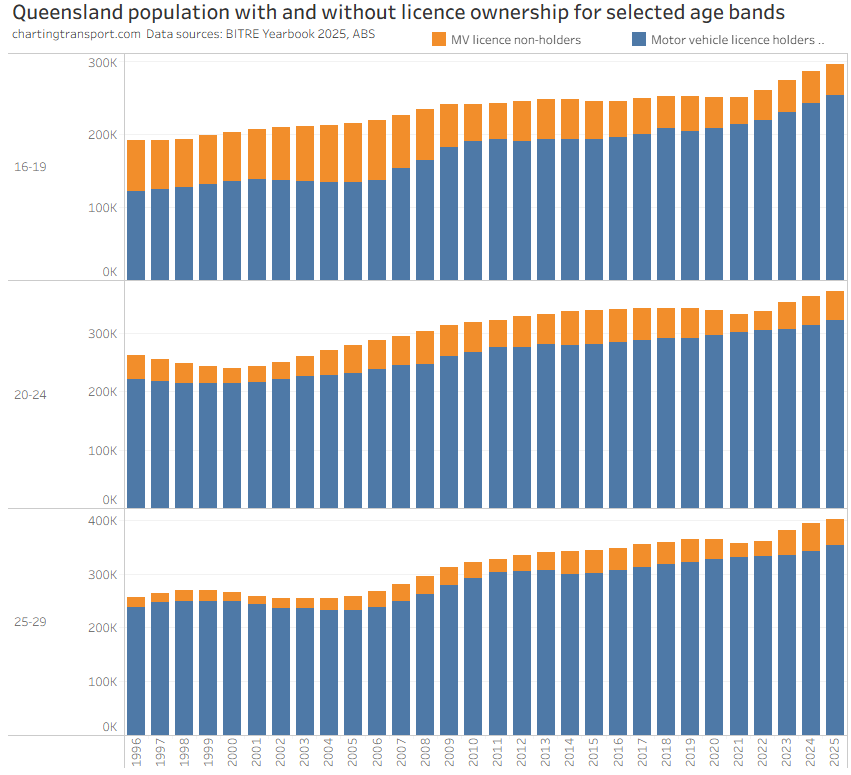
Queensland has experienced strong growth in licence holders at the same time as a decline in population aged 20-29 during the pandemic years. This might be the product of departing temporary immigrants partly offset by interstate migration to Queensland.
To illustrate how important migration is to the composition of young adults living in Australia, here’s a look at the age profile of net international immigration over time for Australia:
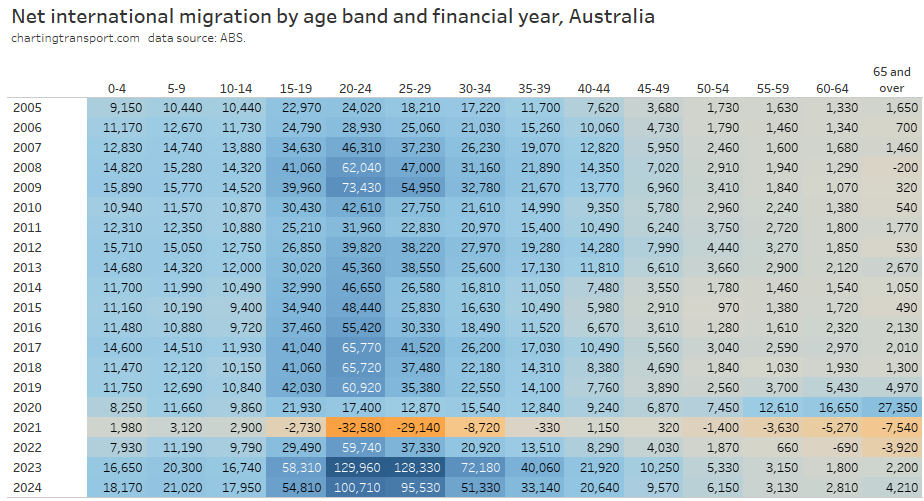
For almost all years, the age band 20-24 has had the largest net intake of migrants. This age band also saw declining rates of driver’s licence ownership – until the pandemic, when there was a big exodus and at the same time a significant increase in the drivers licence ownership rate. The younger adult age bands have seen a surge since 2022, and in the three states with data the licence ownership rates have dropped.
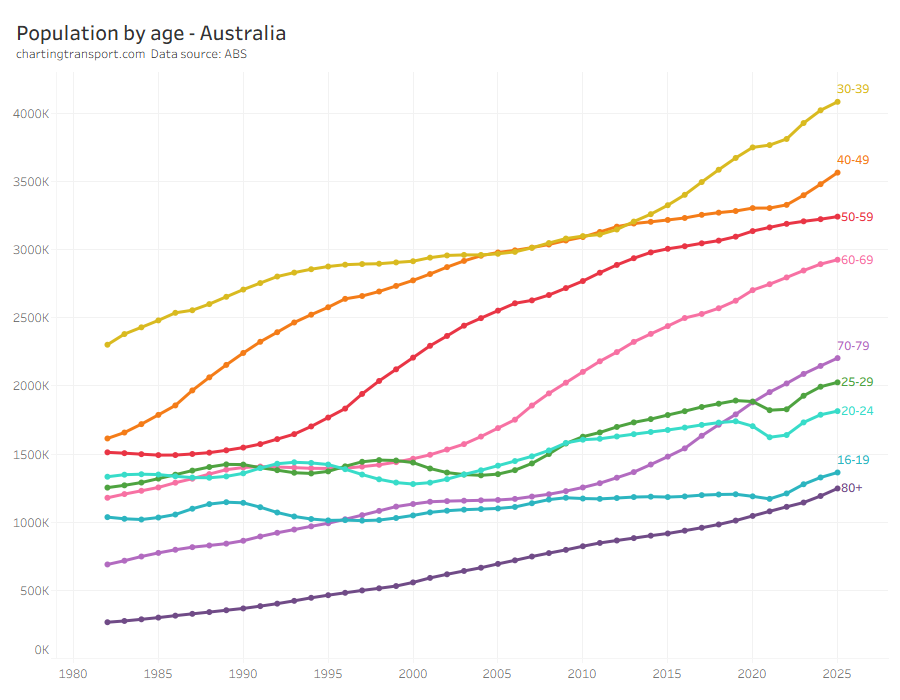
Here’s another view of this issue – Australia population by age band, showing clear dips in 16-29 year-olds during the pandemic:
Motor cycle licence ownership
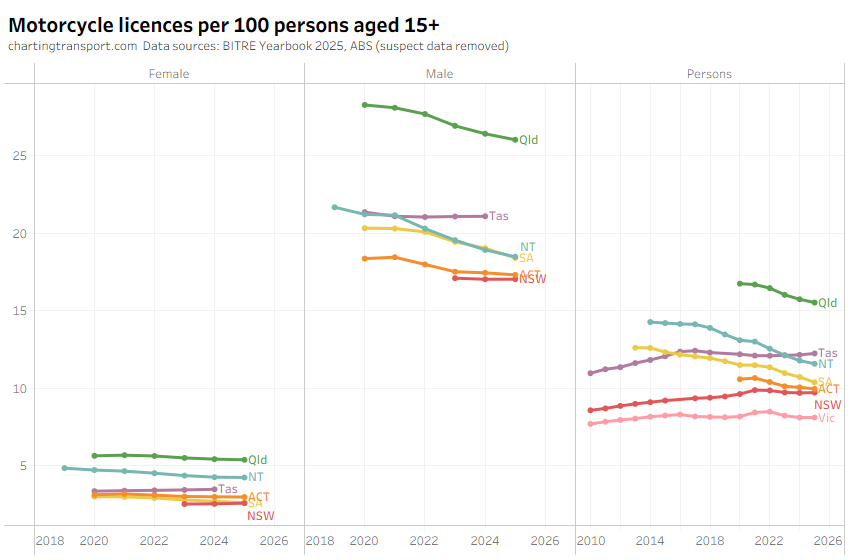
Motorcycle licence ownership per capita has been declining in most states and territories, except Tasmania and New South Wales.
Data quality issues
Collecting this sort of data is a undoubtedly a nightmare for BITRE, and it’s possibly also a nightmare for jurisdictions trying to report data to BITRE. There’s confusion about how to treat people with car and heavy vehicle licences, and people with car and/or motorcycle licences. Hopefully in future Yearbooks BITRE can work with state agencies to improve the consistency and quality.
There are three data tables for licence holders in the BITRE Yearbook:
- Table 4.9: Licence holders by age and gender
- Table 4.10: Licence holders by vehicle class and licence category
- Table 4.11: Licence holders by vehicle class and gender
All three tables provide total licence holders. Tables 4.9 and 4.11 also provide totals by gender. State agency data is also available for NSW and Queensland for many years and I’ve imported much of that as well. And BITRE Information Sheet 84 provides some data for years up to 2016.
I’ve reconciled estimates of total licence holders, and licence holders per capita aged 16+ for each jurisdiction and data source, and made some assumptions around data quality based on which data sets agree, and what trends look plausible. The data points I’ve discarded as “bad” are marked in the charts below.
Australian Capital Territory
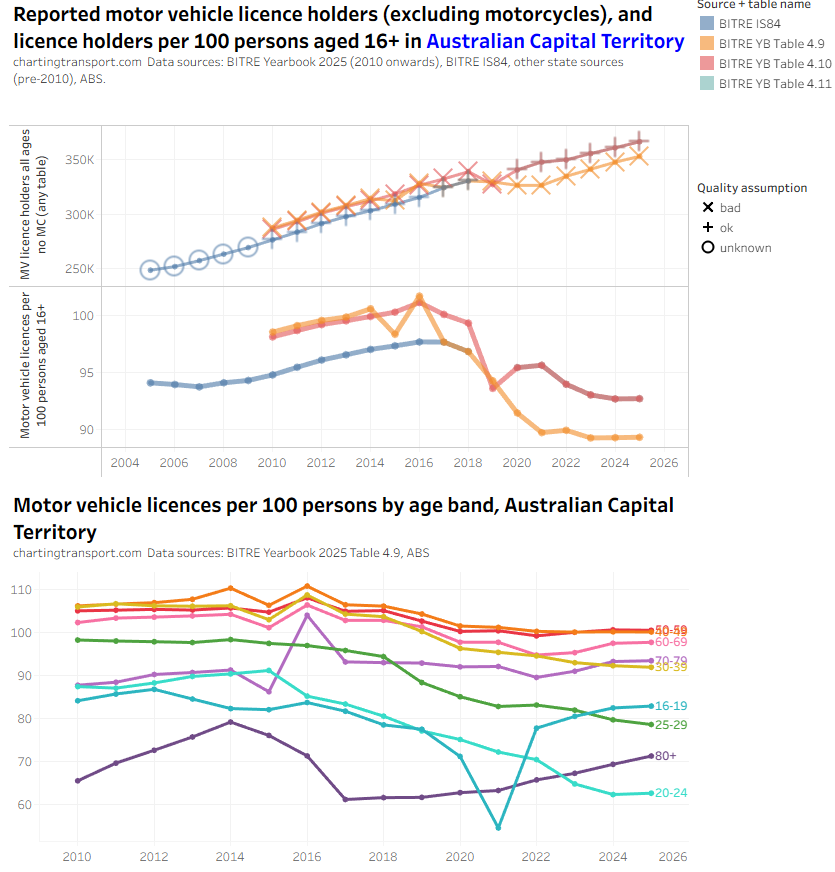
Looking at the top chart, I’m assuming the BITRE Information Sheet 84 (IS84) figures are good to 2018, and then I’m assuming the other figures that line up with these are reasonable from 2020 onwards, and I’m discarding the rest. Most of the Yearbook figures are a step above the IS84 figures for 2010 to 2018, while Yearbook table 4.9 then drops below this line fore 2019 to 2025.
Table 4.9 shows some implausible fluctuations in 2015 and 2016 for some age bands (bottom half of the chart), and also per-capita ownership rates above 100. However the trends in ownership rates by age band otherwise seem to be to plausible. So maybe they are at least indicative of trends, except around 2015 and 2016.
BITRE’s Information Sheet 84 (published in 2017 but with data to 2018) reports that ACT licences might remain active after people leave the territory (e.g. to nearby parts of NSW) because of delays in transferring their licences to another state, resulting in a mismatch between licence holder counts and population. However, New South Wales requires people to transfer their licence within 3 months of moving there, and other states likely do also. But that requirement might be new, changed, and/or differently enforced over time (please contact me if you know more).
New South Wales
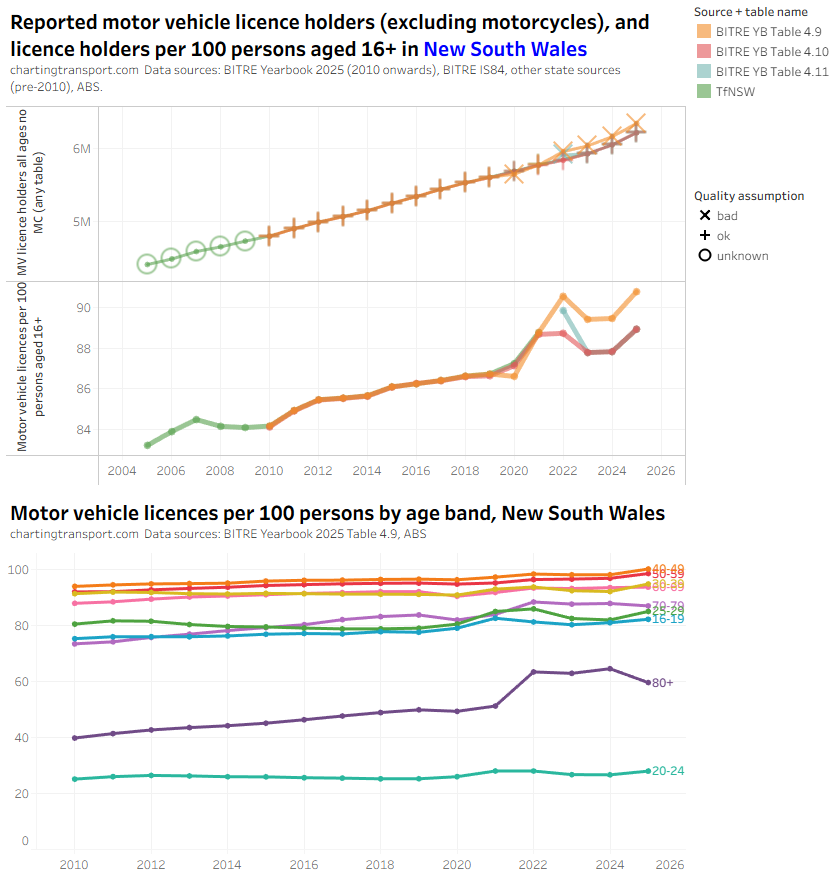
The different data sources agree up until 2019. Table 4.9 is under the rest for 2020, and above the rest for 2022+ so I’m assuming that data is bad. Table 4.11 agrees with the rest except for 2022, so I’m assuming that year is bad.
There was an unexpected increase in motor vehicle licences per capita for those aged 80+ from 2022 to 2024 in the BITRE data, which seems suspect. There were also sharp increases in 2025 in younger aged bands, but this might be plausible. The TfNSW data also shows a jump in licences per capita for 80+ but not by a much smaller amount.
Northern Territory
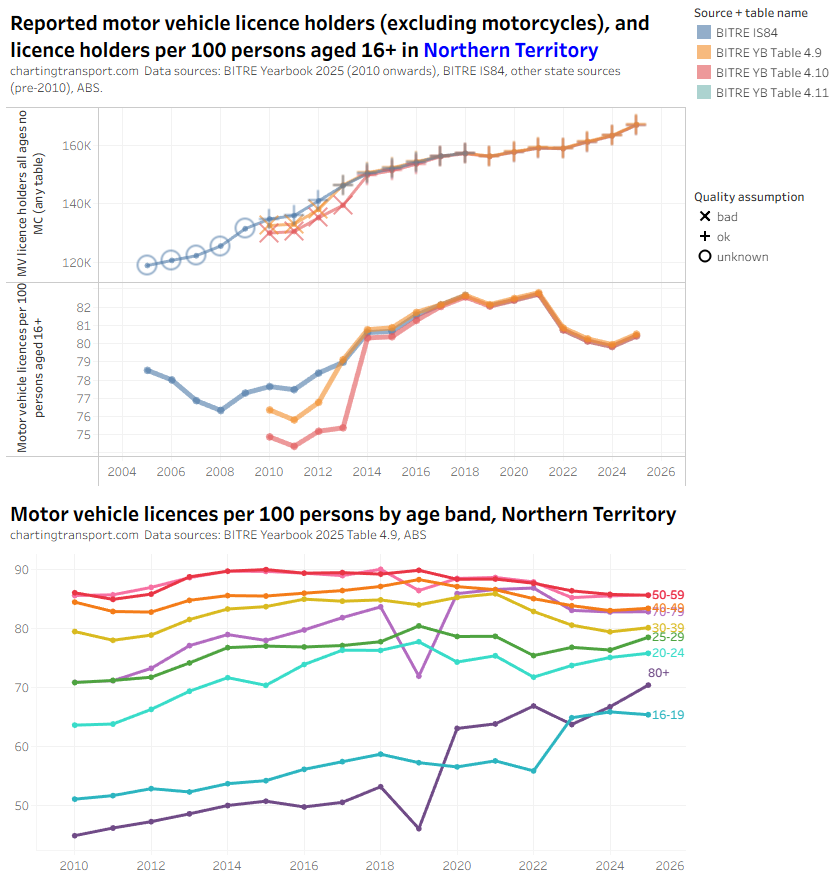
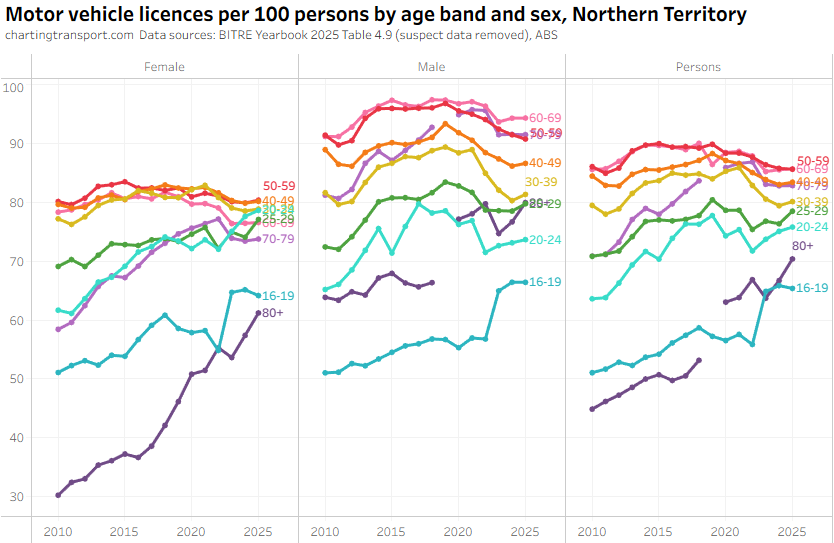
The series in IS84 lines up with the Yearbook sources from 2013 for table 4.9 and 2014 for table 4.10, so I’m assuming earlier numbers in 4.9 and 4.10 are bad. Table 4.10 figures are slightly below the other sources for 2014 to 2016 but very close.
Unexpected dips are reported for 2019 for ages 70-79 and 80+ so table 4.9 looks suspect for 2019.
Queensland
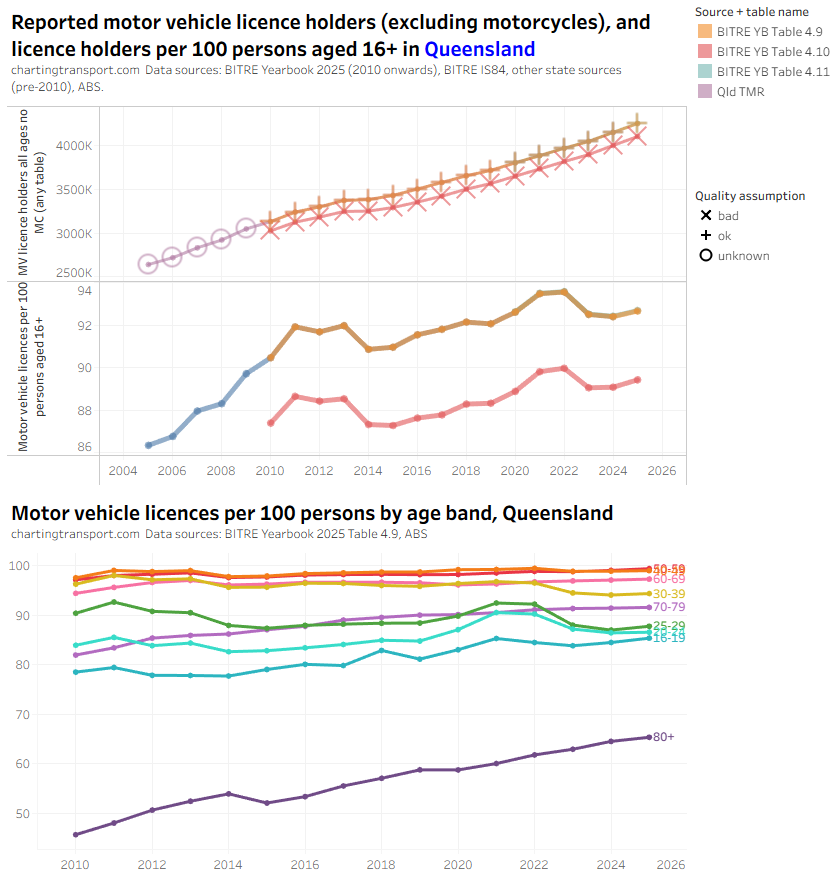
Tables 4.10 reports a consistently lower figure than IS84 and tables 4.9 and 4.11, so I’m assuming those figures are bad.
South Australia
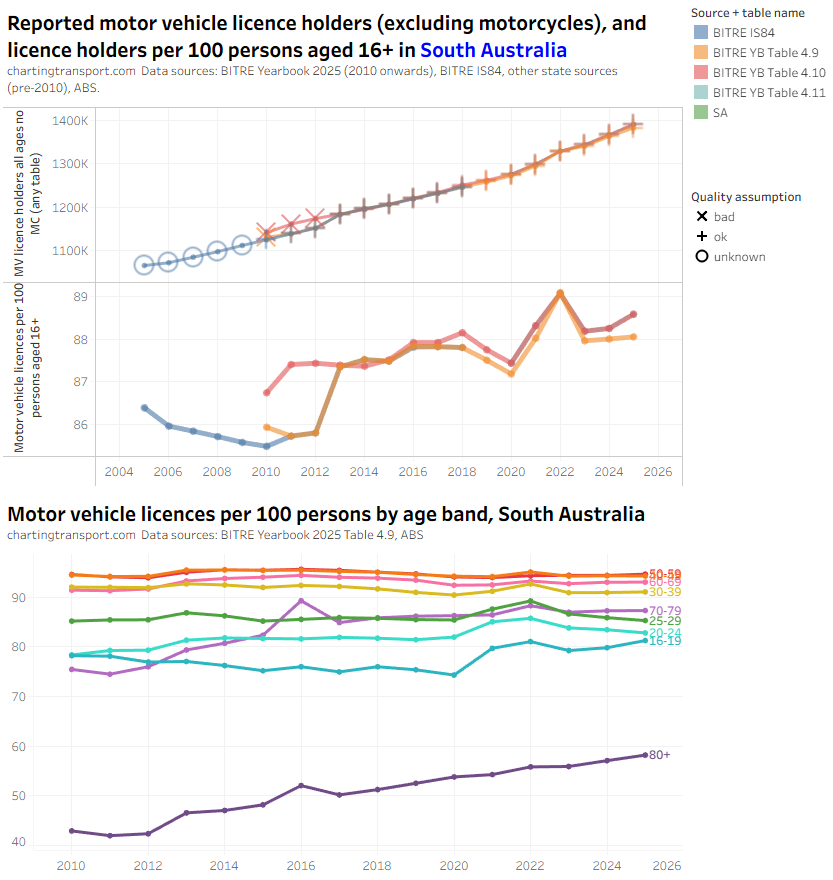
BITRE IS84 agrees with Table 4.9 in most years (except 2010), while table 4.10 appears high for years 2010 to 2012. There was a change to licencing rules in 2013, so a step change then seems plausible.
The 2016 data in table 4.9 looks suspect for aged 70-79 and 80+, but this doesn’t appear to impact the overall total.
Tasmania
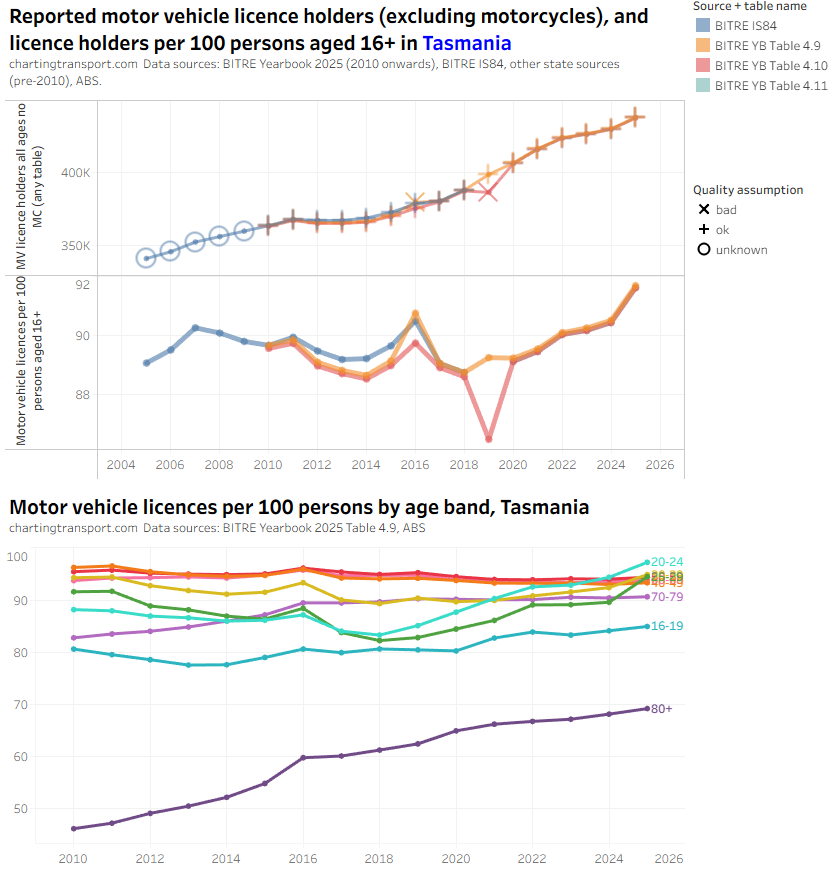
The data sources mostly agree, except table 4.10 is an outlier in 2019, and table 4.9 is an outlier in 2016. IS84 and table 4.10 are otherwise very close between 2012 and 2018 so I’ll be taking an average of the two where both tables can provide an estimate (for want of more certainty about what is likely to be correct).
I’ll dive deeper in licence ownership by age band and gender for Tasmania because there are further issues:
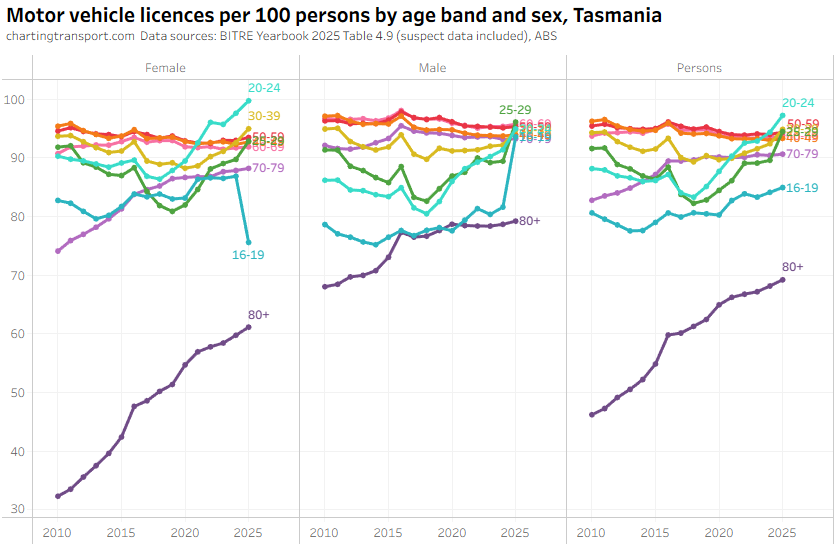
Something definitely looks wrong with 2025, particularly for younger age bands. And licence ownership by females aged 20-24 has been trending unusually high. The overall total for 2025 looks reasonable, but not so much the figures per age band.
Victoria
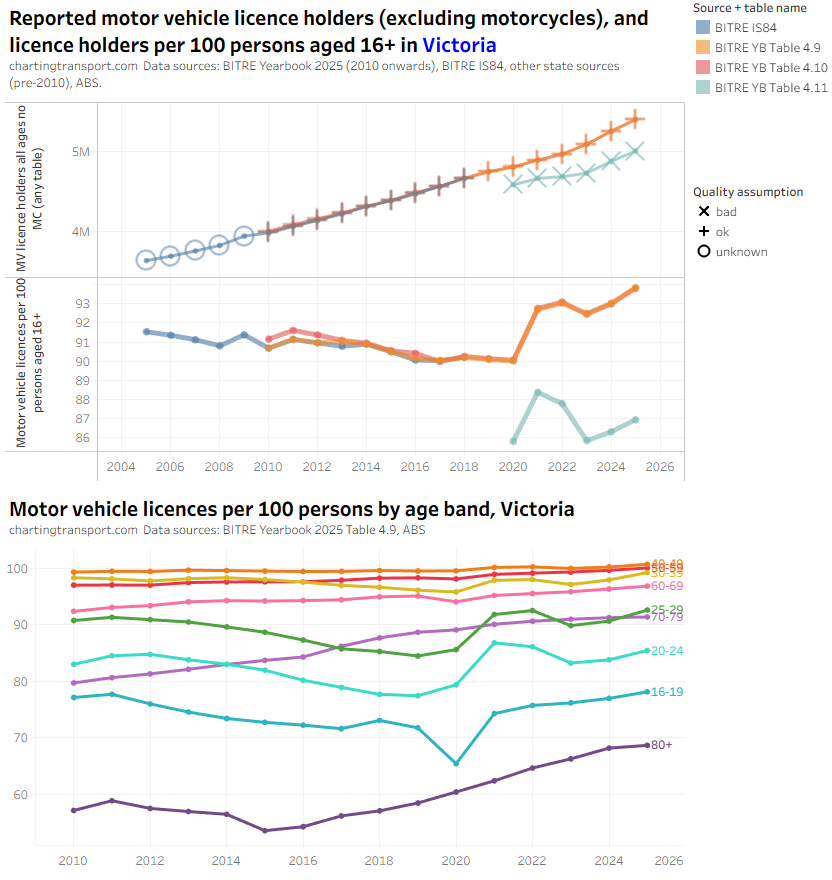
Table 4.11 consistently reports lower licence numbers than tables 4.9 and 4.10 so I’m considering that suspect. There was a large step up in licence ownership rates for many younger age bands in 2021 but that is plausible with the exodus of international students during COVID (as discussed above). Overall rates of ownership appear to be much higher for 2023-2025 with growth in all age bands, which doesn’t seem implausible. Perhaps Victorians were spooked by extended COVID lockdowns and decided a driver’s licence was more essential? The data in table 4.10 is slightly above the data from IS84 and table 4.9 for the years 2010 to 2013 but it’s not by a lot, so I haven’t discarded that.
Western Australia
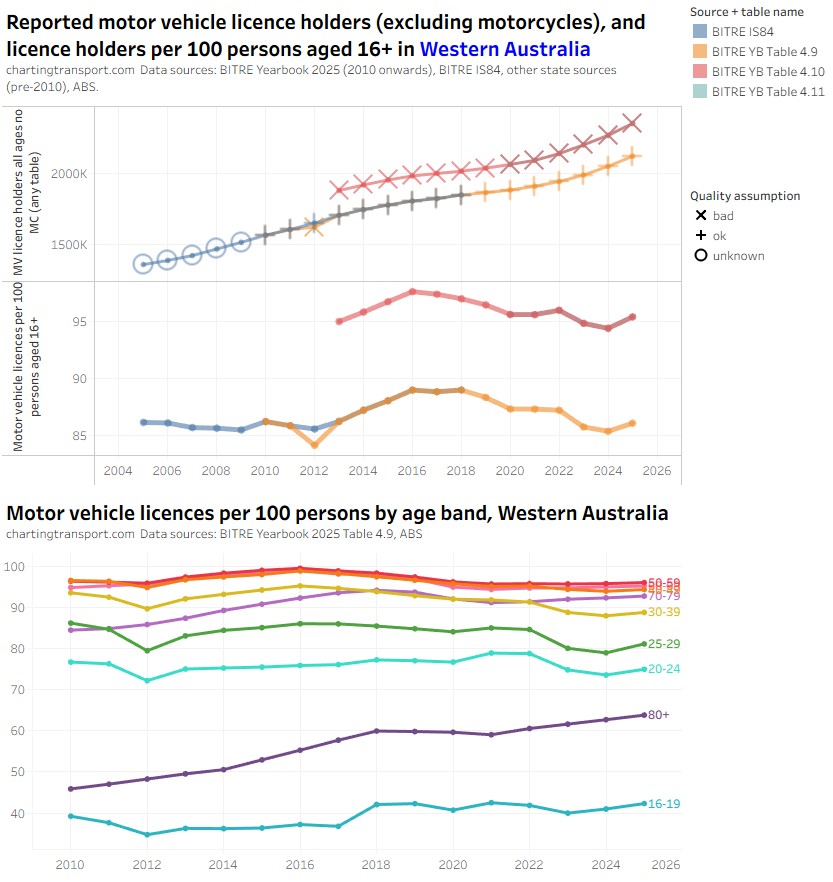
Tables 4.10 and 4.11 suggest very high rates of licence ownership, inconsistent with data in Information Sheet 84 and table 4.9. I’m inclined to trust the values in table 4.9 as being more plausible. But table 4.9 looks suspiciously low for 2012.
Table 4.9 seems to provide figures close to the total number of full licences in table 4.10, but if table 4.9 was missing non-full licences the licencing rate would be too high. Hard to know what’s going on here!
Final remarks: It’s easily to complain about poor data quality, but I do empathise with the people responsible for compiling these statistics. No doubt they are dealing with legacy systems and databases that might be hard to query and may or may not have good documentation. Then there’s plenty of room for confusion and double-counting across car, motorcycle, and heavy vehicle licences. And there are so many different types of licences – full, provisional, learners, probationary, restricted, suspended, interim, ordinary, extra-ordinary, etc. I suspect BITRE had many challenges trying to compile consistent data from all jurisdictions. Hopefully with more effort across the jurisdictions the quality could be improved in future. Licence ownership is unsurprisingly a significant driver of travel behaviour, so it is important to report licence holder numbers as accurately as possible.
For less-recent (2015) but more detailed analysis, see the older post Trends in driver’s licence ownership in Australia.

