You might also want to read a more recent post covering this topic published in 2019. For the latest data see the most recent annual update on transport trends, eg December 2023.
Recent research has talked about “millennials” being less likely to get their driver’s licence at younger ages, with data showing a decline over the 2000s. But is this trend continuing? This post checks out the latest data to see if the decline is still happening.
While I’m at it, I’ll look at licence ownership by age and gender (are young men more likely to have a licence than women?) and trends for older persons (are people holding onto licences longer into old age?). There’s also a strange quirk for people born in 1945/6.
This post analyses available state-based data on driver’s licence ownership in Australia in recent years. In this post some of the data sets I’ve used include learner’s permits, and some only count “independent” licences (watch for notes).
How does licence ownership vary with age?
I have access to licensing data for four Australian states that allows a quite detailed analysis (three publicly, and VicRoads kindly let me access theirs).
The following chart shows licence ownership for Victoria, South Australia and New South Wales by individual age for the most recent year available at the time of writing (combining licensing data with ABS state population estimates by single year of age to calculate ownership rates):

Licence ownership peaks between ages in the mid-thirties to late sixties, then falls away with age thereafter. There is certainly a pattern of people in their 20s and early 30s being less likely to have their licence.
The main difference for the younger ages is that the Victoria data include independent licences only (ie excludes people with a learner’s permit). Also, from what I understand, the minimum age for an independent driver’s licence is 17 in most states, except in Victoria where it is 18, and the Northern Territory where it appears to be theoretically possible at age 16 and 6 months. The minimum age for a learner’s permit is 16 years, except in the ACT where it is 15 years and 9 months.
The Victoria data is generally higher than the other states from around age 32, with some results calculated as high as 99.8%. The Victoria data includes suspended licences, which may not be the case for other states, and there may be other minor differences in the way the data is counted. But it is interesting that Victorian ownership rates are up to 10% higher for older age groups. I’ll look at those trends and patterns in more detail shortly.
I’ve previously looked at driver’s licence ownership using VISTA data (Victorian household travel survey 2007-2009) which shows a similar pattern but with less detail:

How does licence ownership vary with gender (and age)?
First up, New South Wales:
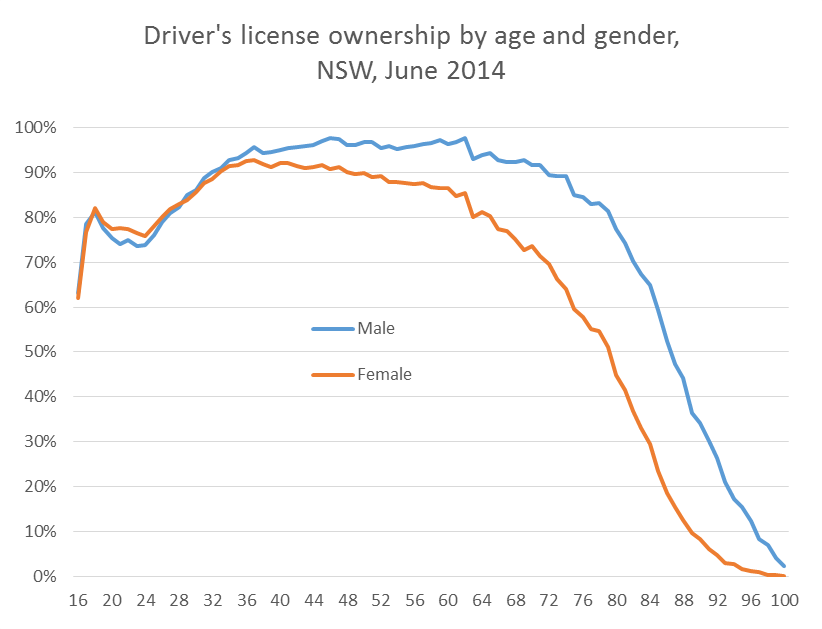
Age 30 is the age under which females are more likely to have a licence (or learner’s permit), and after which males are have higher rates of licensing. The difference in licensing between the genders grows very large for older ages. This might be explained by women of older generations being less likely to have ever obtained their licence, and/or men stubbornly holding onto their licence for longer than they should.
Here’s the same data for South Australia:
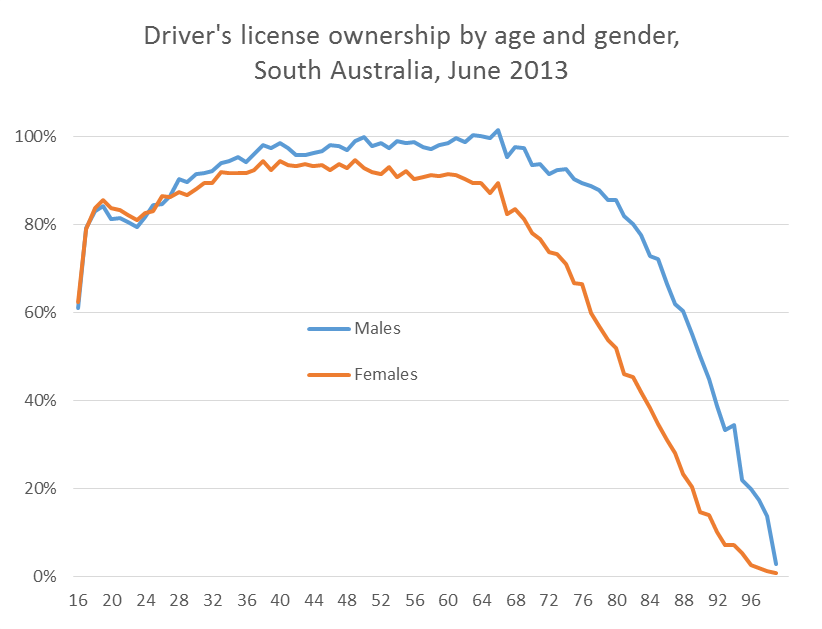
The gender flip occurs around age 27 – with younger women more likely to have their driver’s licence.
Queensland data is available with slightly less age resolution:
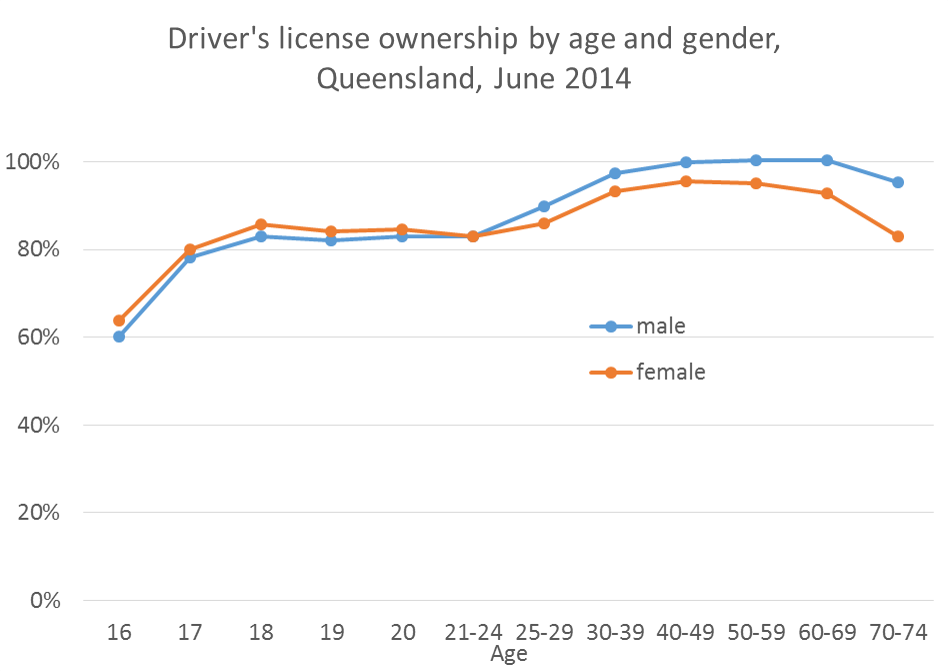
The gender flip point occurs sometime between ages 21 and 24.
I really wasn’t expecting younger females to be more likely to have a licence than males. Is this just something to do with learner’s permits?
I can only answer that question with Queensland data:
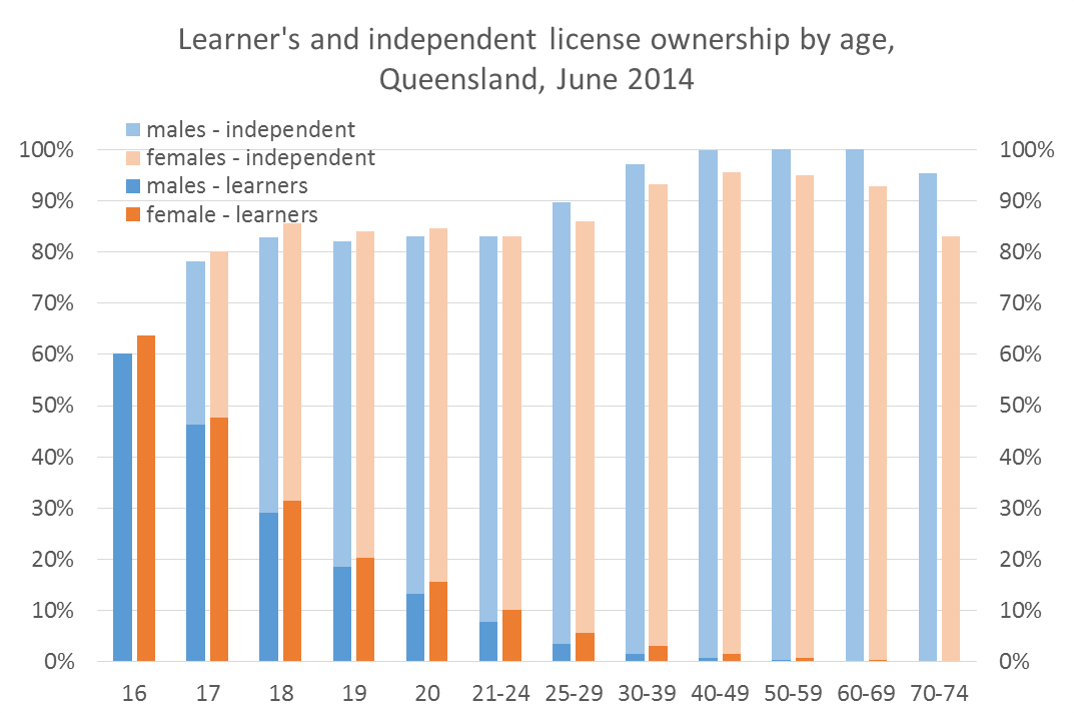
This shows women in Queensland are more likely to have their learner’s permit than men (at any age). However, men are actually more likely than women to have an independent licence from age 20 onwards, as women appear to spend more time with their learner’s permit. It would be interesting to look at this for other states, but alas the data isn’t readily available.
You may also have noticed the South Australia and Queensland data suggests around 101% of men in some age groups have their driver’s licence. This suggests imperfect data – perhaps double counting people with endorsements for higher classes of vehicle or people who have both car and motorbike licences, or imperfect ABS estimates of people at each individual age. So licensing data needs to be read with caution, with a focus on the trends and patterns rather than exact numbers.
Licence ownership trends of younger people
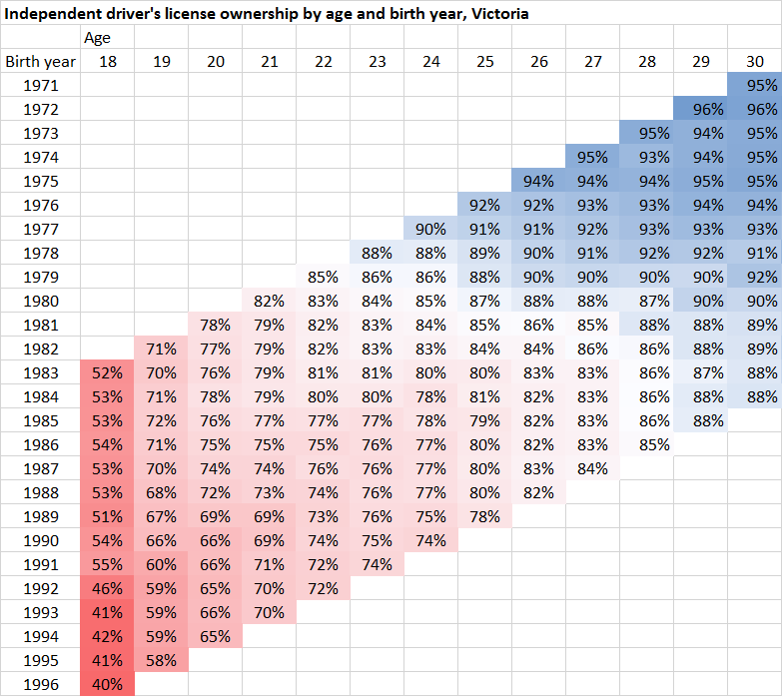
Here is independent licence ownership rates in Victoria for younger people:
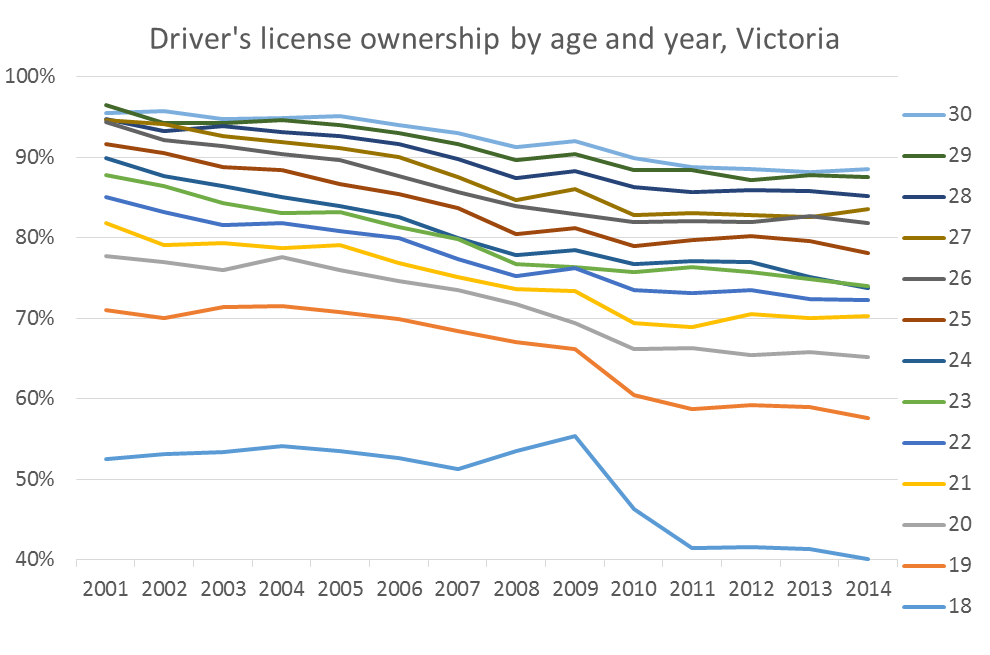
There are clear and sizeable downward trends in licence ownership rates amongst most ages, with most dropping by around 12% over 13 the years. There was a slight rise in most age groups in 2009 but then a quite significant fall between 2009 and 2010, particularly 18 and 19 year olds. The graduated licensing system was introduced between January 2007 and July 2008, and I’m yet to find references to changes in rules around 2009 or 2010. so I’m not sure how to explain the changes in 2010. That said, when I look at the data for 2010, there are a few anomalies in patterns in other age groups, so there may be some small data errors.
The rate of licence ownership of 18 year olds was however relatively steady between 2001 and 2008, but then dropped significantly from 2010. The minimum time period to hold a learner’s permit became 12 months in July 2007, making it harder to obtain your probationary licence by age 18. There is a peak of licence ownership at age 18 in (June) 2009 – these people will have turned 16 in the financial year 2006-07 and so probably escaped the new licensing regime (I suspect this cohort made more effort to get their learner’s permit before 1 July 2007).
I also note that the declines appear to have largely levelled off for most ages since around 2011. I don’t have much data about learner’s permit holders in Victoria, but some data published shows that the average time spent on L plates in Victoria for people aged 17-20 increased from around 60-70 weeks in 2000 to around 100 weeks in 2010, following the graduated licensing scheme introduction.
Have we now stabilised at new lower levels? More on that shortly.
Readers of this blog will note that several transport trends changed direction in 2011. That was about the time that public transport patronage growth in Melbourne slowed down, and mode share stabilised. Here’s the Melbourne mass transit mode share and young persons licensing rates charted together:
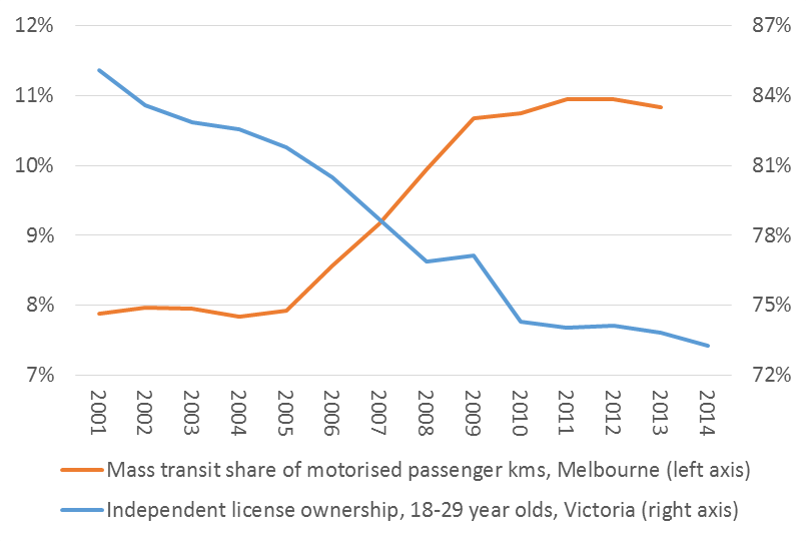
(mass transit mode share from other BITRE yearbook data)
Or if you look at this as a correlation:
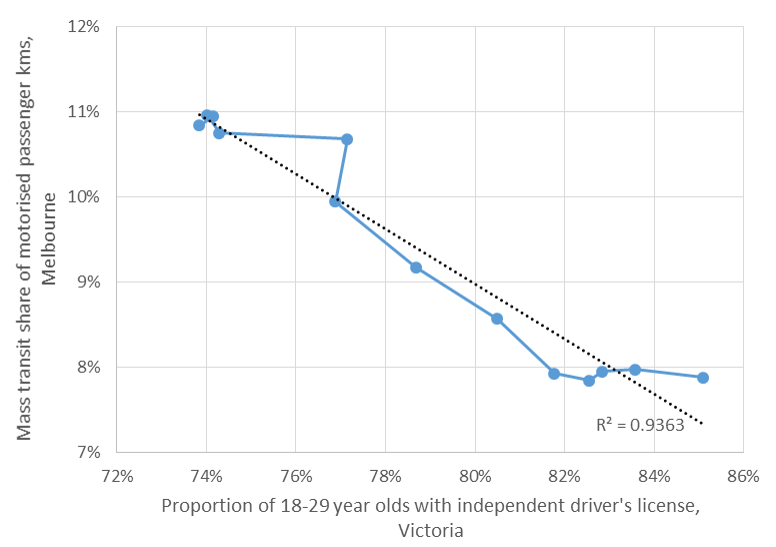
That’s a strong correlation. Given that younger people dominate public transport patronage, this isn’t hugely surprising. The major deviation from the trend is 2009, which is perhaps explainable through changes to the licensing regime, although between 2001 and 2005 there was a reduction in licence ownership without mode shift to mass transit.
So why has the trend towards lower licence ownership of younger people stopped in Victoria? Other researchers might have to answer that question.
Here is data for young people in New South Wales (note: data includes learner’s permits):
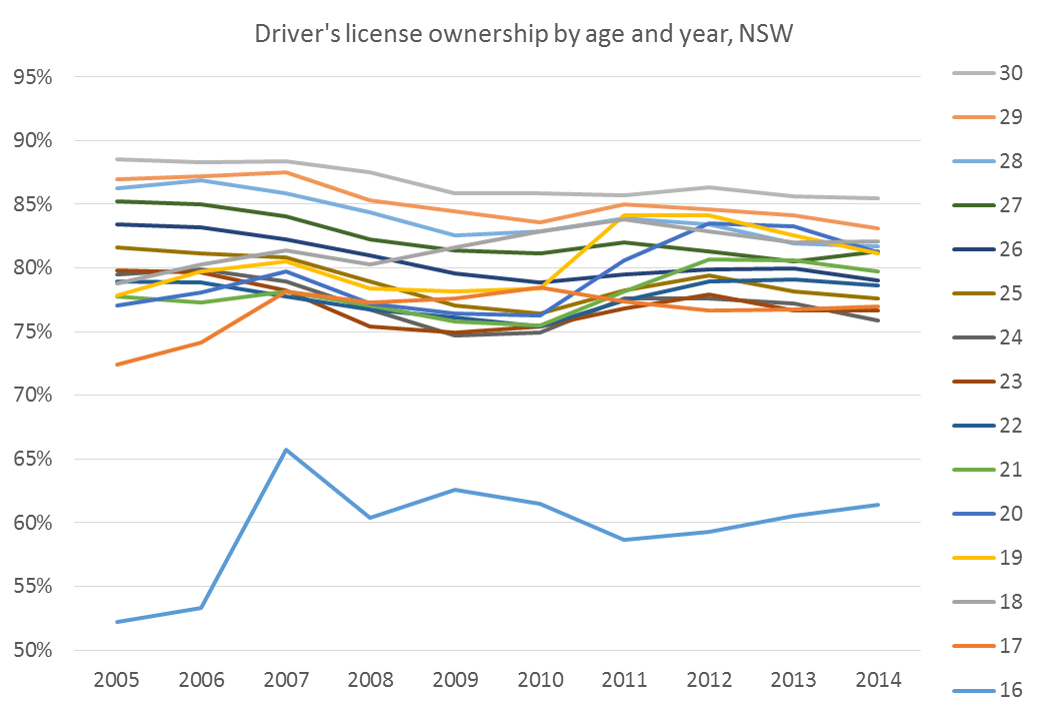
Very different trends! Most age groups trended down between 2007 and 2010 but then many bounced up again thereafter.
So is this completely different trend because it includes learner’s permits? Unfortunately I don’t have single-age based data for people with independent licences, but I do have it for age groups:
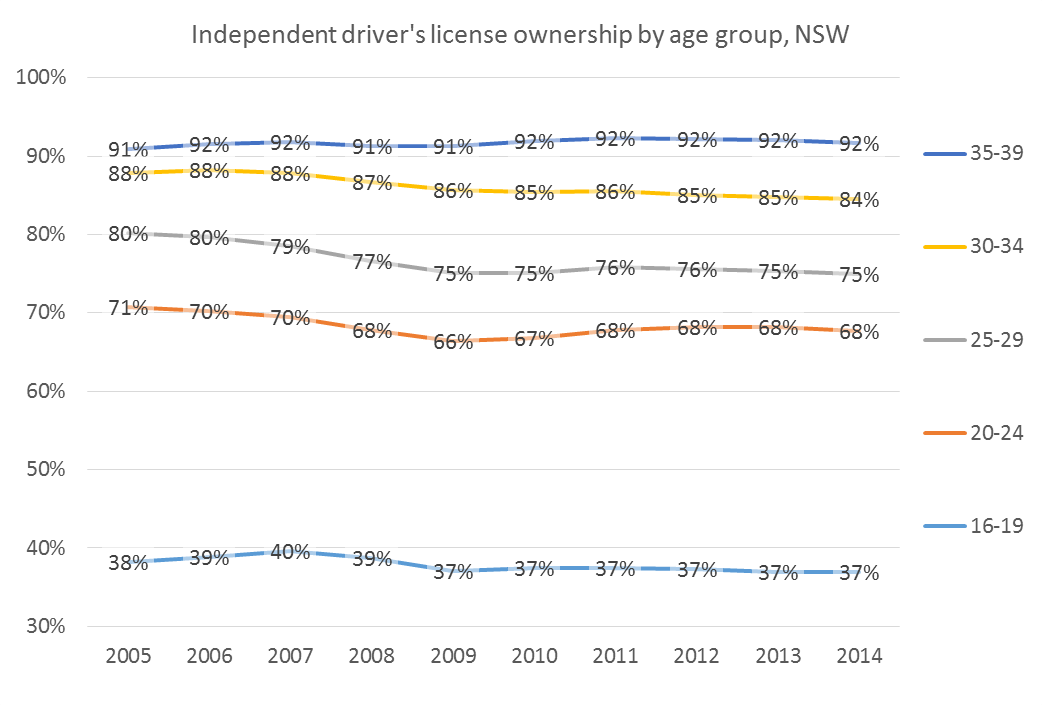
The trends are similar. Independent licence ownership rates have dropped by around 3-5% in the younger age brackets over the nine years. There was a larger dip around 2009, followed by small rises in some age brackets since. Otherwise things look pretty stable, and very different to Victoria (and note that Sydney has had much less public transport patronage growth than Melbourne over the same time).
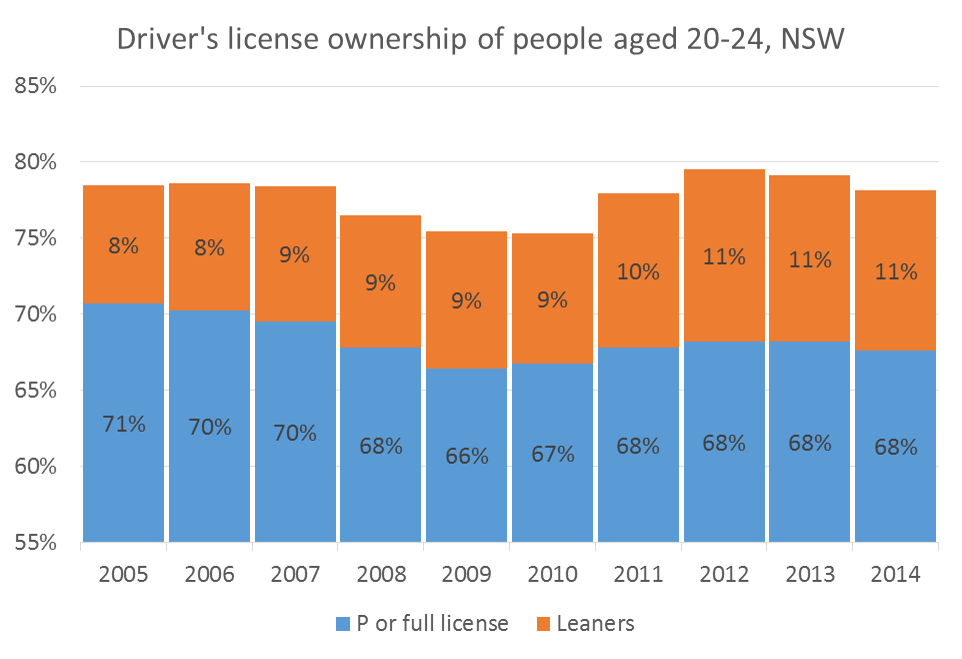
If I put learner’s and independent licences together and look at 20-24 year olds, there is a slightly higher proportion with their learner’s permit in more recent years (8% to 11%). So this suggests people are probably staying on their Ls for slightly longer.
Do the trends in NSW licence ownership correlate with Sydney mass transit mode share?
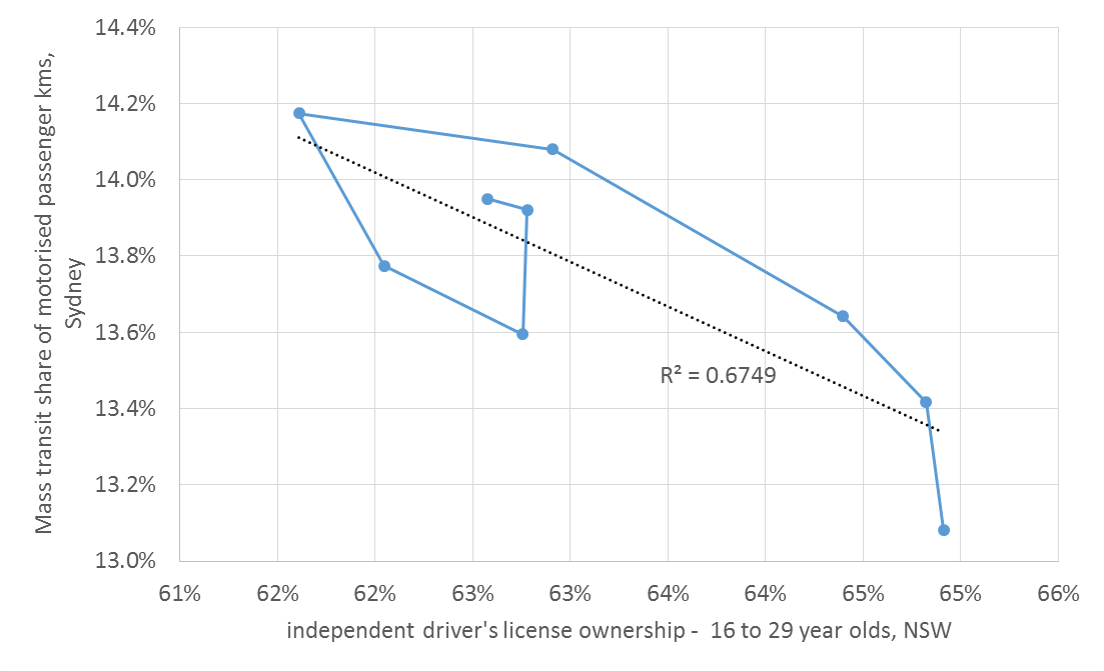
Not nearly as much as for Victoria and Melbourne.
What is interesting in the NSW data is that there appears to be a pattern that varies by birth year. I’ve adjusted the layout of the data tables such that each row represents people in a single birth year (well, birth financial year, if you will). This data includes learner’s permits.
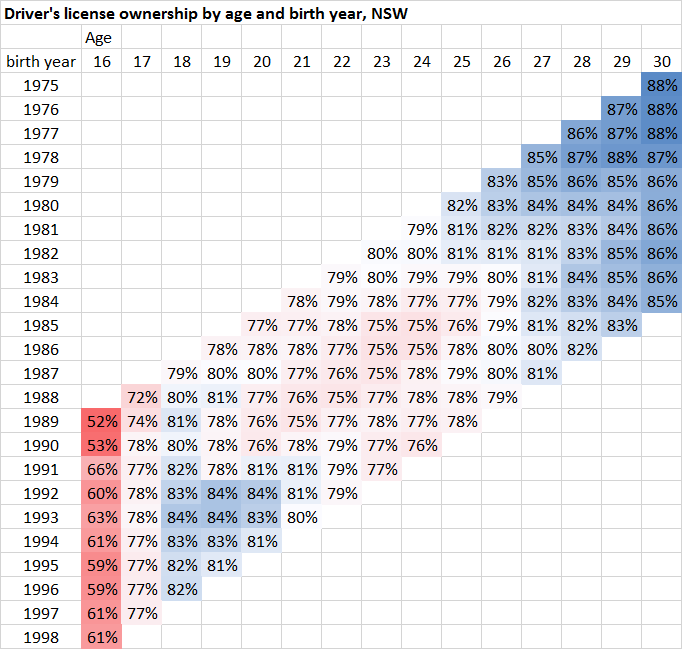
Licence ownership rates were relatively higher for people born 1992 onwards (although curiously they appeared to have declined after age 21, which perhaps might be a result of immigration – not sure). In NSW, the birth years of approximately 1982 to 1991 appear to have had relatively lower rates of licence ownership.
Only six years of data is available for South Australia, but there is a pattern of higher licence ownership for people born from around 1993 onwards (data includes learner’s permits), but it might be trending downwards again from birth years 1996 onwards:
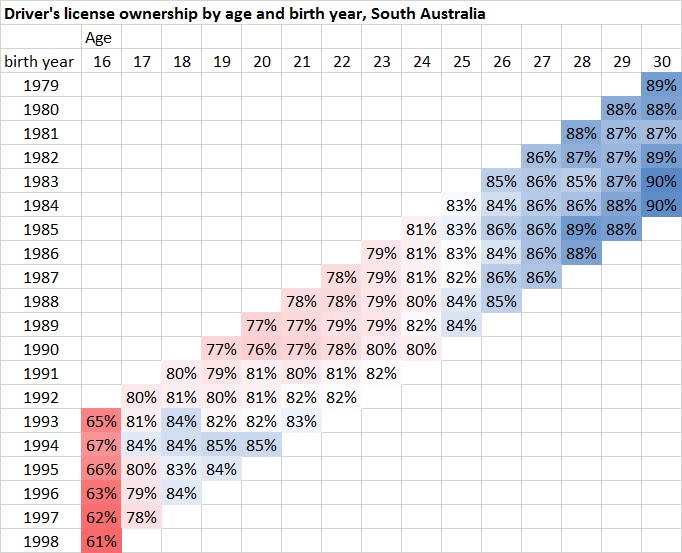
(note: the only available South Australia data for 2010 is for January – I have interpolated to estimate June 2010 numbers. The most recent data is for March 2014 – I have interpolated the population estimate accordingly but in the figure above the bottom numbers in each column are for people born in the 12 months to March 1998, not 12 months to June 1998).
Queensland data only reports single year licence ownership to age 20, but a much longer time series is available:
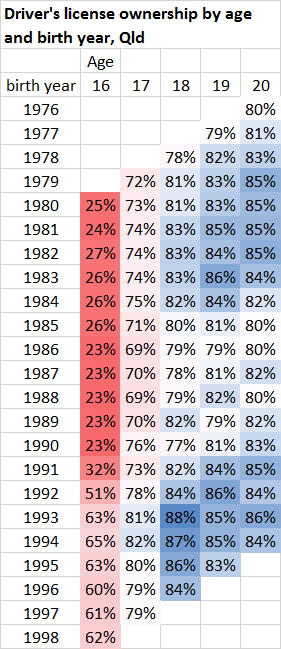
Again, there is a range of birth years from around 1984 to 1990 with relatively lower licence ownership. In July 2007 the minimum age for a learner’s permit dropped to 16, which would explain the massive increase in learner’s permit ownership for 16 year olds. This seems to correspond to increased licensing rates for birth years 1993 onwards.
Although Victoria hasn’t had a bounce in licence ownership rates for young people, the birth year trends do show the downward trend finishing with births around 1990. In fact, from that birth year the rate of licence ownership at age 21 went up slightly, which might reflect that it is easier to obtain a probationary licence from that age (as a learner logbook is no longer required). The decline in licensing rates seemed to begin around birth year 1980.
The following table summaries the birth years of lower licence ownership in each state, and compares these birth years with the first birth year impacted by graduated by graduated licensing (assuming people obtain their learner’s permit at age 16):
| Lower licence
ownership birth years |
Graduated licensing started | |||
| Start | End | Start | First birth year | |
| New South Wales | 1982 | 1991 | 2000 | 1984 |
| Victoria | 1980 | 1990 | 2007 | 1991 |
| South Australia | ? | 1993 | 2005 | 1989 |
| Queensland | 1985 | 1990 | 2007 | 1991 |
There appears to be a fairly consistent cohort of people born between around 1980-5 and 1990-3 who have been less likely to get their licence at a younger age. In Victoria and Queensland they weren’t faced with the new graduated licensing system if they got their learner’s permit at age 16. In fact, licensing rates stopping declining in the birth years first fully subjected to graduated licensing in Queensland and Victoria – the opposite of what you might expect!
Dr Alexa Delbosc at Monash University has led much interesting research into reasons for the downwards trend of licence ownership in Australia (amongst others). Perhaps this new evidence of a reversal/stabilisation of the trend might explain some things further, or need a new explanation in itself.
What about licence ownership of older people?
First up, Victoria:
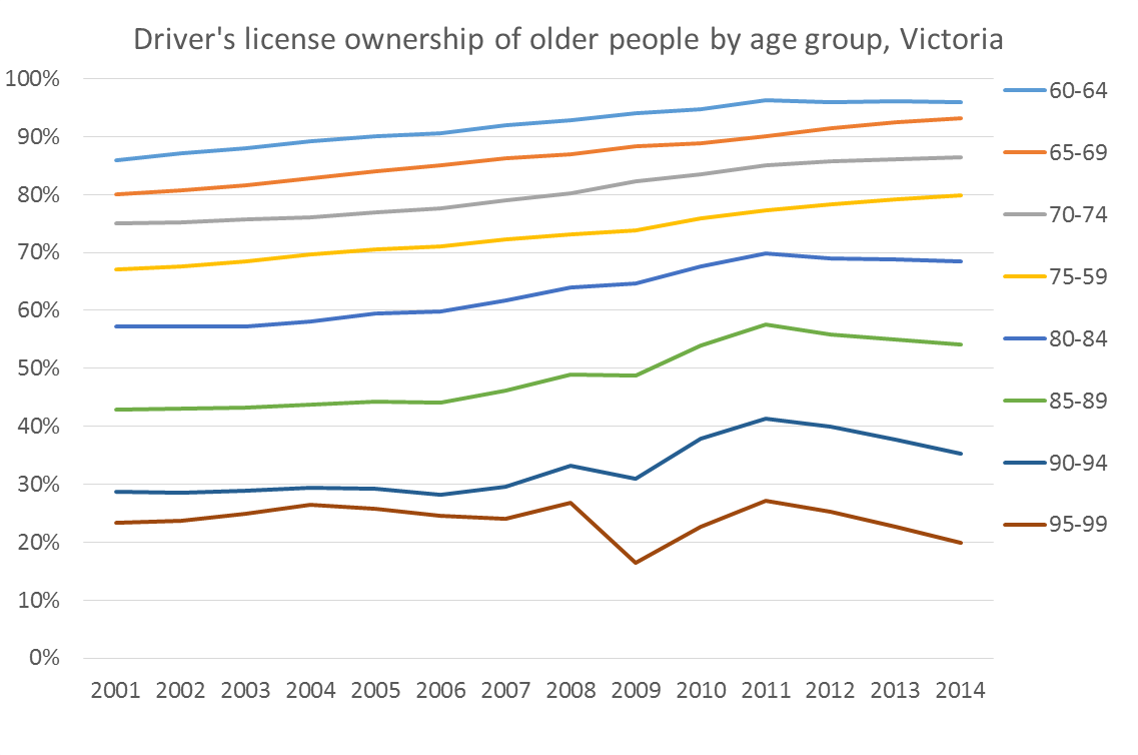
Licence ownership rates increased in Victoria until 2011 in most age groups, probably reflecting people living healthier for longer. However licence ownership rates fell from 2011 onwards for those over 80 (despite Victoria not having mandatory testing for older drivers). It might be explained by a change to a 3 year licence renewal period for those over 75, but I cannot confirm when that change was implemented. I’m also at a loss to explain the blips in the 2009 data for those 90+.
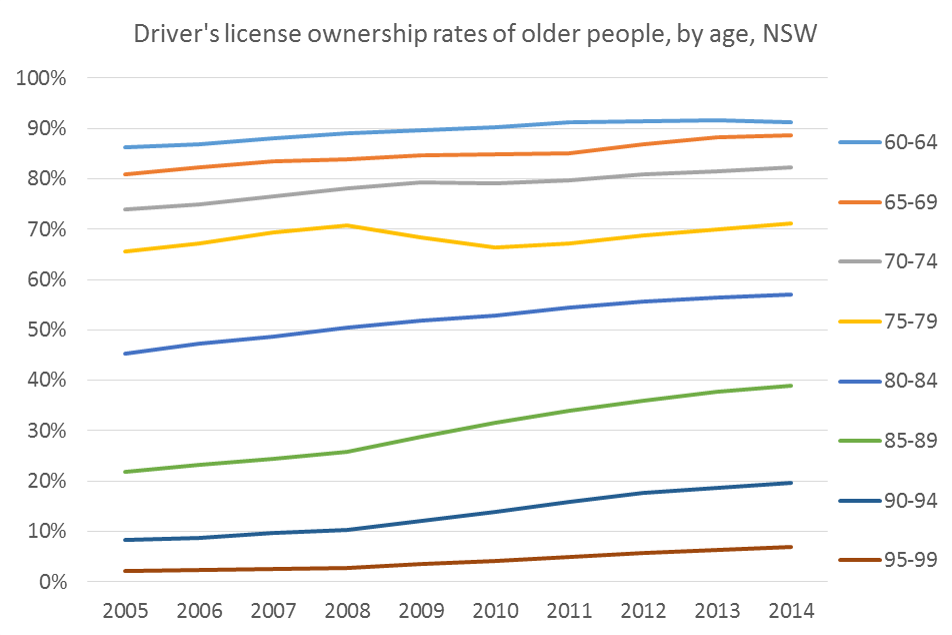
Here’s the same for New South Wales, where car drivers need to have an annual medical review from age 75, and have to pass a practical test to keep an unrestricted licence from age 85. For those 75+, licensing rates are considerably lower than in Victoria.
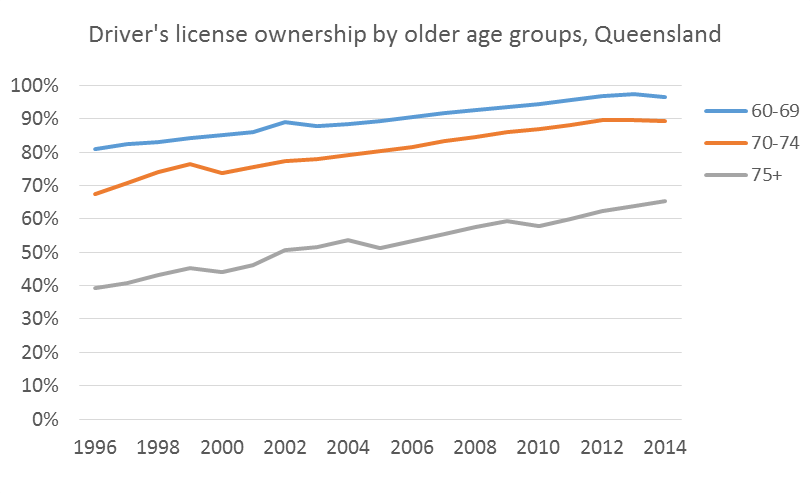
While the Queensland data provides less resolution of age groups, it shows the trend of increasing licence ownership over a longer period of time, although with a levelling out for those 60-74 from around 2013.
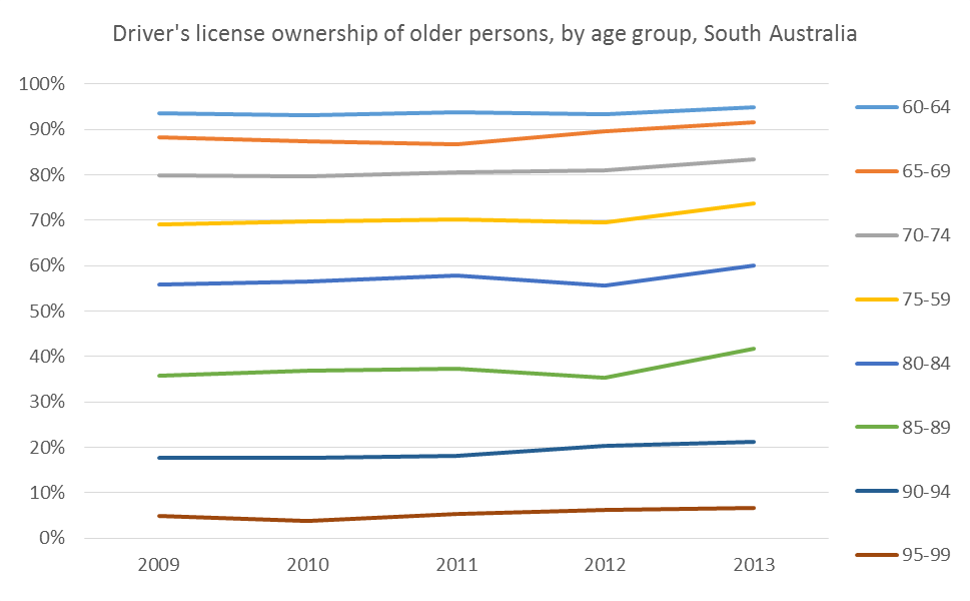
And for completeness, here is five year’s worth of data available for South Australia, not showing any dramatic trends:
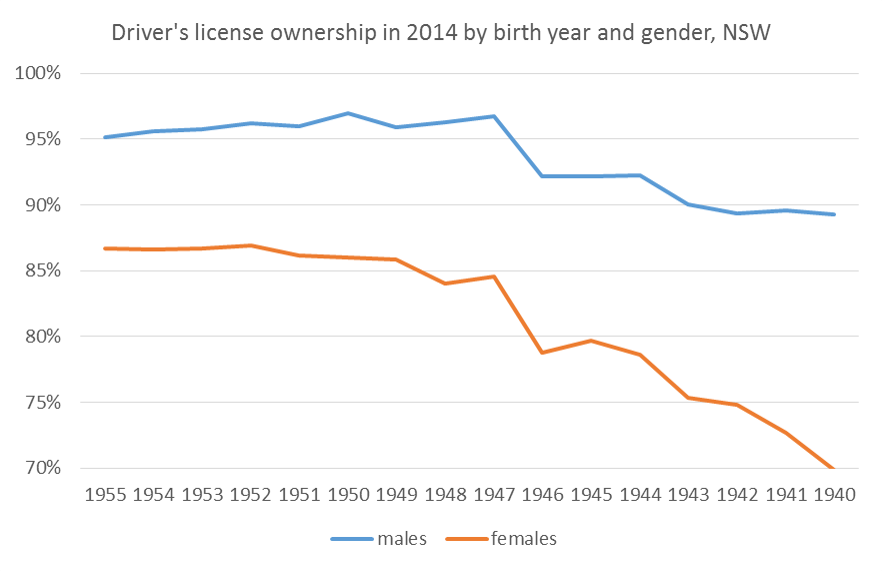
Finally, you might have spotted a blip in the first chart of this post around age 68 (you were looking at it carefully, right?). Zooming in and changing the X axis to birth year we see an interesting anomaly:
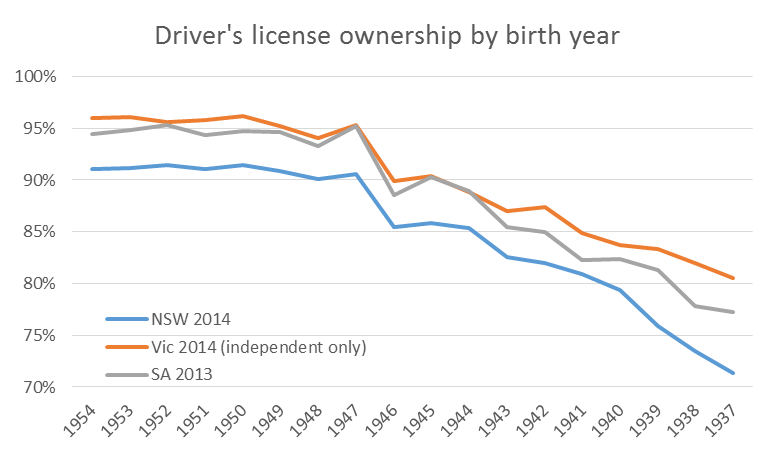
Years on the X axis are actually financial years (ending June). People born in 1946/7 are 10% more likely to have their driver’s licence than people born in 1945/6, and this is consistent across three states!
This year of relatively lower licence ownership is for people born immediately after World War II, and who around 19 years of age when Australia sent troops to the Vietnam War (although many men in the next birth year would also have gone to Vietnam). I wondered if it might be related to the Vietnam War, but then the trend applies more so to women than men, as shown in this NSW data:
I then thought it might be to do with being born whilst Australia was recovering from the war and healthy food and good medical care might have been less available, resulting in a mini-generation of people less likely to be able to get their driver’s licences later in life.
The census provides one indicator of disability in terms of people recorder as “need assistance with core activities”. While people born between 1945 and 1949 seem to be slightly more likely to have a disability (compared to the general pattern across ages, supporting the post-war lower health hypothesis), the 1946 age year doesn’t stand out as much different to neighbouring years.
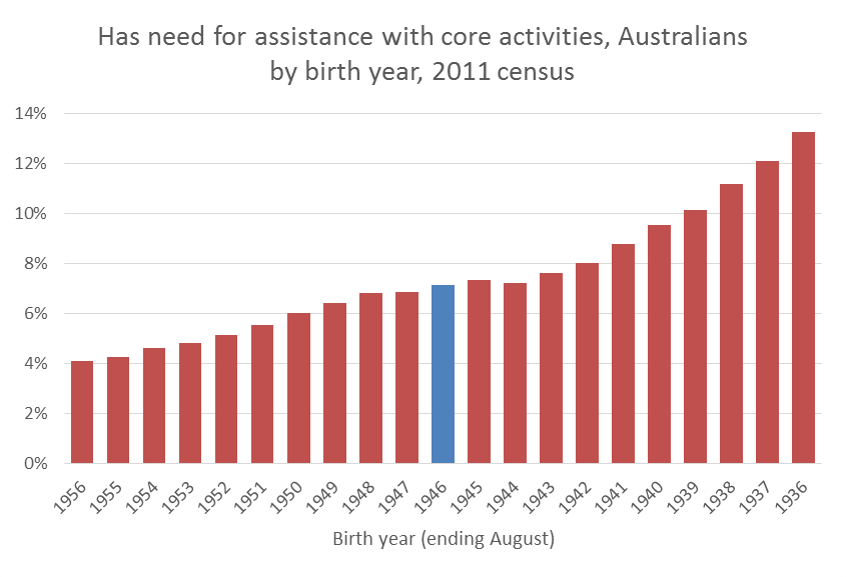
Another explanation might be that ABS have inaccurately estimated the population born in that year.
Can anyone else shed more light on this anomaly?


So why has the trend towards lower license ownership of younger people stopped in Victoria? Other researchers might have to answer that question.
I wonder whether the increased use of car share in recent years may partly address that question. Still require a licence, but not necessarily a car. Would be interesting to compare car ownership rates with licence ownership rates to see if the extent of departure has increased.
Regards,
Cameron
[RPS]
Cameron Hoffmann
Principal – Planning
RPS Australia Asia Pacific
18/455 Brunswick Street, Fortitude Valley, QLD, Australia, 4006
PO Box 1559, Fortitude Valley, QLD 4006.
Dir: +61 7 3124 9366
Tel: +61 7 3237 8899
Fax: +61 7 3237 8833
Mobile: +61 407 927 626
Email: cameron.hoffmann@rpsgroup.com.au
www: http://rpsgroup.com.au
This e-mail message and any attached file is the property of the sender and is sent in confidence to the addressee only.
Internet communications are not secure and RPS is not responsible for their abuse by third parties, any alteration or corruption in transmission or for any loss or damage caused by a virus or by any other means.
LikeLike
“There is a peak of license ownership at age 18 in (June) 2009 – these people will have turned 16 in the financial year 2006-07 and so probably escaped the new licensing regime (I suspect this cohort made more effort to get their learner’s permit before 1 July 2007).”
Yep, I got my learner permit on 15 June 2007, thus narrowly avoiding having to complete 120 hours in a log book.
LikeLike
I cannot find a figure (estimate) for number of licences held in Australia – current estimate if possible, please.
LikeLike
I have been trying to determine when “Provisional licences” – P Plates were introduced. It seems in the ACT for instance, it might have been around 1963 http://trove.nla.gov.au/newspaper/article/109895802?searchTerm=“driver licence” age&searchLimits=l-decade=196|||sortby=dateAsc|||l-year=1963|||l-category=Article. This article also suggests that other regulations (e.g. a minimum of 12 hours driver instructions) might have become more stringent and another article on Trove suggests that proof of age became more stringent around 1964 http://trove.nla.gov.au/newspaper/article/105838142?searchTerm=“driver licence” age&searchLimits=l-decade=196
LikeLike
Awesome work – thanks for shareing – very helpful to have some decent data. Good work.
LikeLike
[…] also an older post on driver’s licence ownership for more detailed […]
LikeLike