Updated November 2025 with data up to January 2025.
Data source: BITRE data of registered road vehicles (collected at the end of January each year)
Note: I’ve used EV as shorthand for battery electric and fuel cell vehicles (the vast majority will be battery), and hybrid EV describes vehicles with battery and another energy source (usually petrol or diesel).
Share of registered fleet
Here’s the motive power share of registered vehicles by vehicle type across Australia over the last five years:
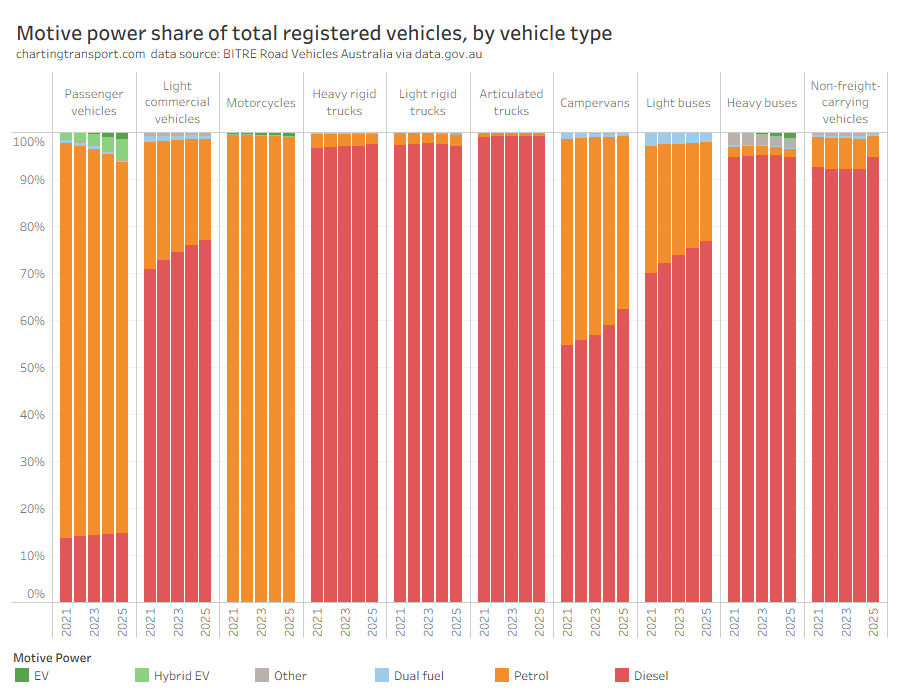
If you look carefully you’ll see growing slithers of EV (dark green) within passenger vehicles, motorcycles, and heavy buses, plus an increasing share of hybrid EVs in the passenger vehicle segment. Apart from motorcycles, diesel is the increasingly dominant motive power for most other vehicle types. EVs are extremely rare in the commercial vehicle space so far.
You might be wondering about “Non-freight carrying vehicles” – these are special vehicles like ambulances, fire trucks, tow trucks, hearses, etc.
Here’s a closer look the national electric vehicle share by vehicle type:
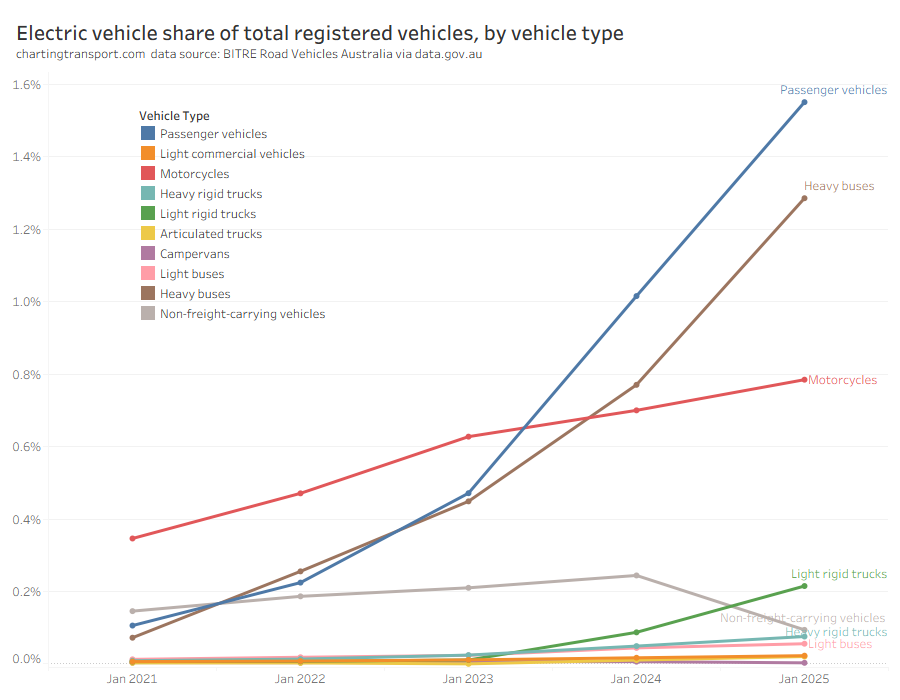
EVs are making inroads into passenger vehicles, heavy buses, and more recently light rigid trucks (especially in the ACT). The penetration in motorcycles is slowing down. Uptake is still tiny in other vehicle categories.
Here’s a breakdown of those selected vehicle types by state/territory:
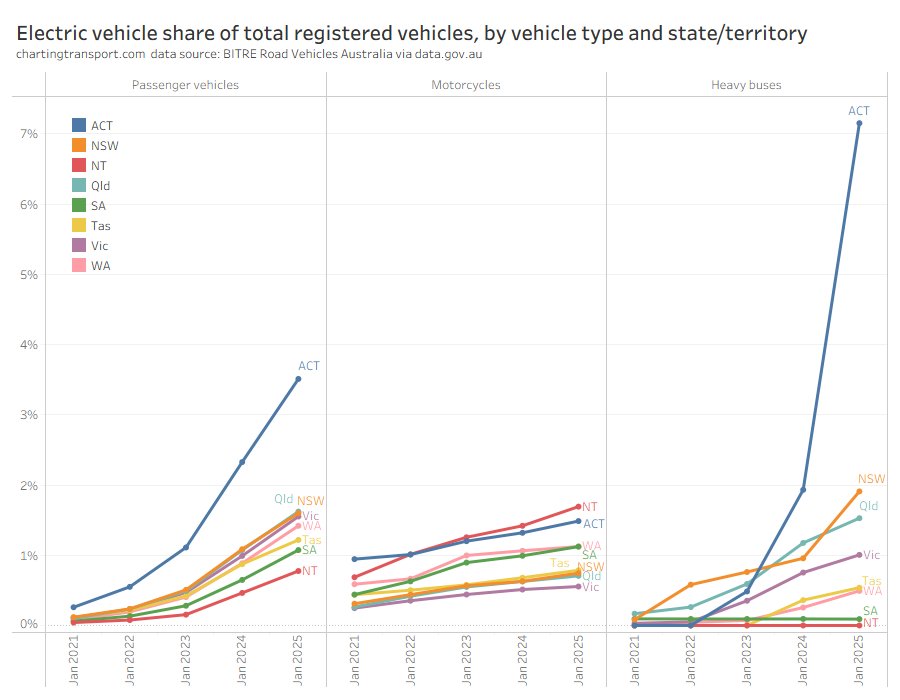
The ACT has blown out the Y-axis on this chart in 2025 with a surge in electric buses. The ACT is also far ahead on EV share of passenger vehicles.
So electric vehicles are still a tiny share of the total fleet, but do they make up more of the growth in the fleet?
Share of the net change in registered vehicles
Here I’m looking at the difference in registered vehicles between Januarys of consecutive years. Note that this analysis is different to analysing vehicle sales as it effectively accounts for deregistered vehicles as well as new vehicles.
The following chart shows the motive power share of net new registered vehicles of each vehicle type. Each column adds to 100%, but the chart will extend below 0% and above 100% when one motive power has a net reduction in registered vehicles, offset by gains in other motive powers (it’s a bit confusing, but I hope you get the idea).

The mix of net new passenger vehicles (mostly cars) is quickly skewing to Hybrids and EVs, with hybrids taking a much larger share than pure EVs more recently.
EVs are also taking an increasing share of net new heavy buses, but a relatively flat share of net new motorbikes.
Diesel is continuing to replacing petrol for Light commercial vehicles, heavy rigid trucks, campervans, and light buses.
Many vehicles remain registered for 20+ years, so it takes a long time before the trends in new vehicles influence the overall fleet mix.
Passenger vehicles
The passenger vehicle story is even more interesting if you drill down to state/territory level:

(sorry I’ve had to exclude the NT because it blows the Y-axis out too much).
EVs and hybrids now account for the majority of the net increase in passenger vehicles in all states. Victoria and WA are the laggards with the highest remaining petrol and diesel share of net new vehicles.
Petrol passenger vehicles are in net decline in ACT, NSW, and Tasmania, and diesel passenger vehicles are now also in decline in the ACT. That’s not to say that there weren’t new petrol and diesel passenger vehicles in these states, they were just outnumbered by deregistered vehicles.
Buses
Here’s the volume change in registered heavy buses by state/territory:
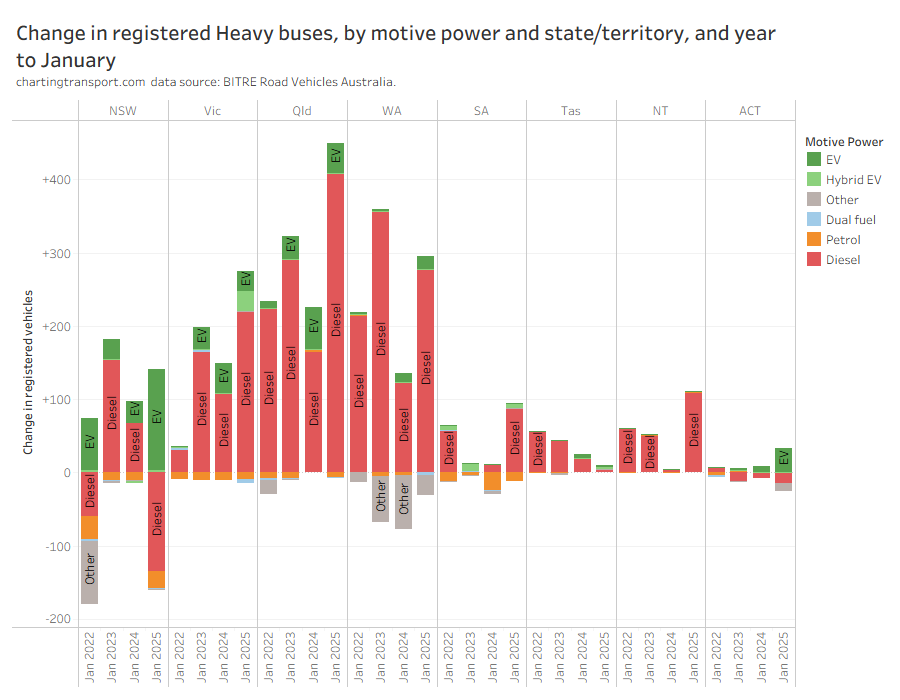
In the 12 months to January 2025, Queensland added the largest number of heavy buses, with most of them diesel. New South Wales had the biggest increase in electric buses (138), together with a net decline in diesel and petrol heavy buses. Queensland added 41 electric buses, ACT 33, Victoria 28, WA 18, Tasmania 3. There has been no net increase in electric buses in SA since at least 2021 (still just 3) and the Northern Territory is/was yet to get it’s first electric bus.
For further analysis see, How fast is Australia moving towards electric vehicles?

