Updated December 2025 with data to 2024-25 (excluding city per-capita metrics).
Data sources:
- BITRE Australian Infrastructure and Transport Statistics Yearbook 2025.
- ABS National, State and Territory population
- ABS Regional population (latest data released March 2025 for June 2024)
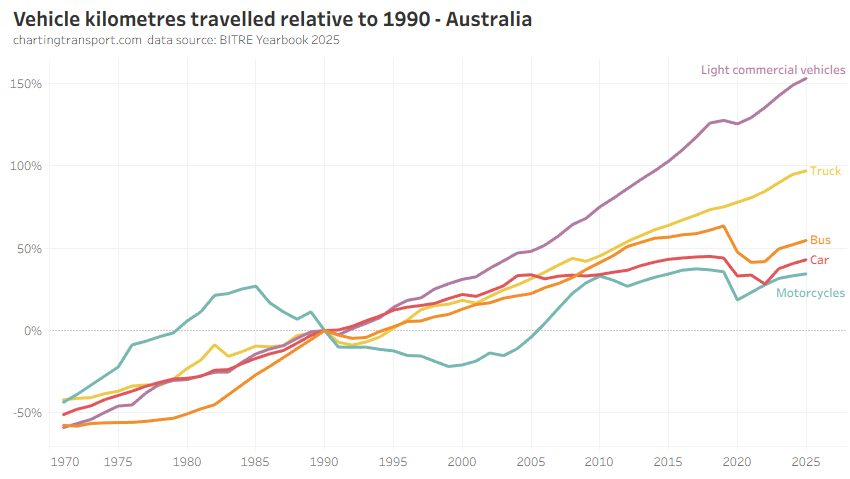
Total vehicle kilometres for 2024-25 were a record high:
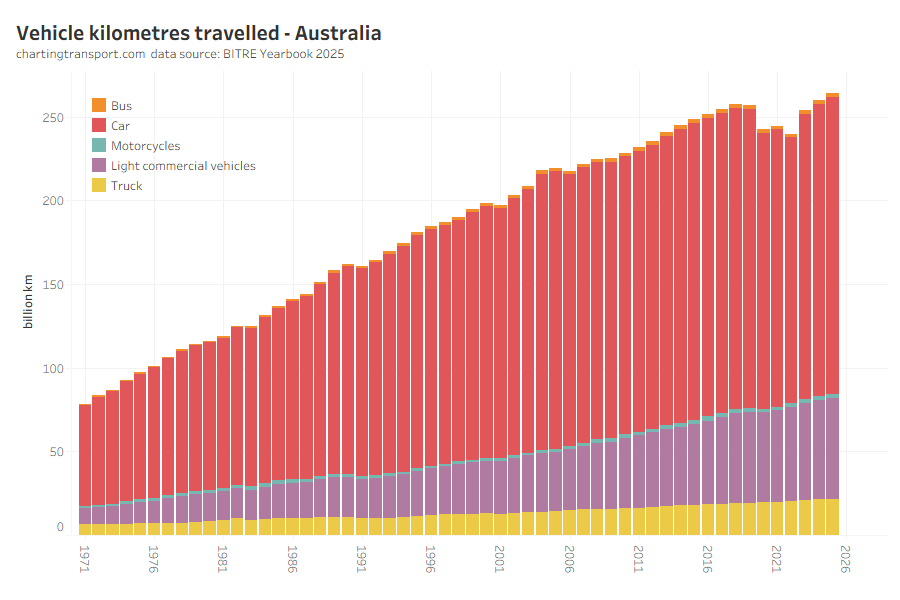
The biggest pandemic-related declines in vehicle kilometres were in cars, motorcycles, and buses:
Technical note: Financial year population calculated as average of mid-quarter population estimates.
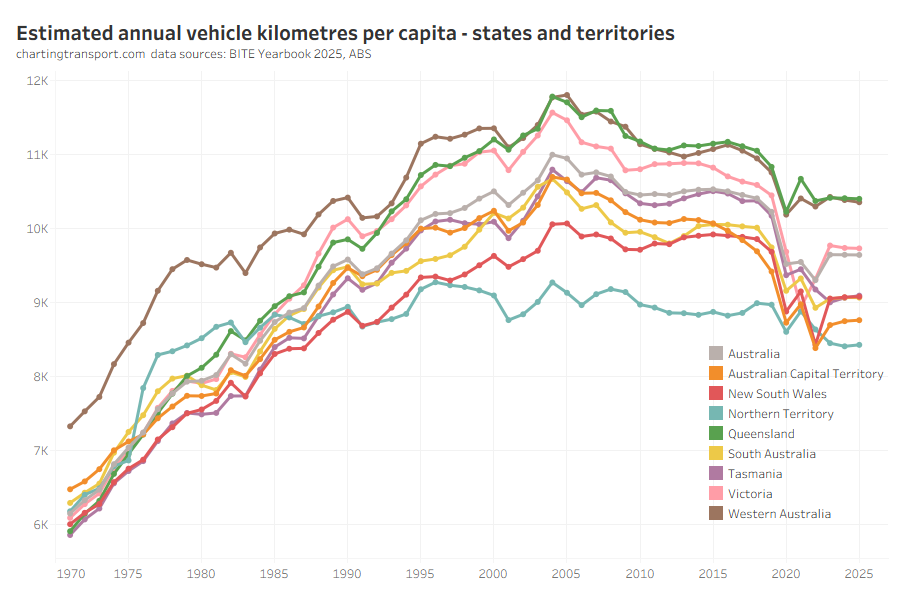
Vehicle kilometres per capita peaked around 2004-05 and were starting to flatline in some states before the pandemic hit with obvious impacts. In 2024-25 vehicle kilometres per capita was pretty stable in all states and territories, at lower than pre-pandemic levels.

Technical note: Financial year population calculated as average of population at start and end of FY.
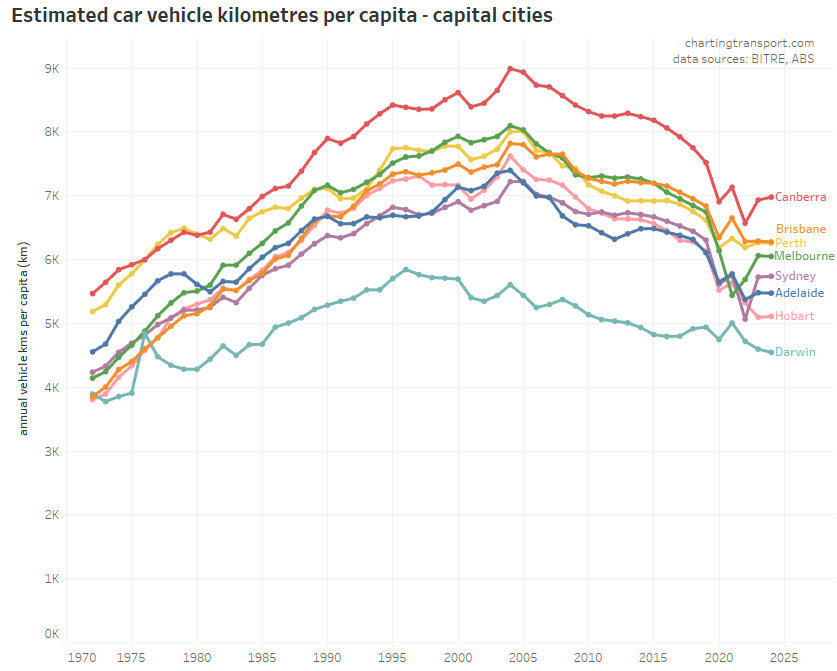
Vehicle kilometres per capita were flat in most cities in 2023-24, except for a small rise in Canberra. This follows a post-COVID rebound to 2022-23 in the heavily locked-down cities of Sydney, Melbourne, and Canberra.
All large cities are still well below 2018-19 levels, consistent with a pre-COVID long-term downwards trend.
Canberra has dramatically reduced vehicle kilometres per capita since around 2014 leaving Brisbane as the top city (it’s not clear to me why this is the case).