This is the second post in a series that explores why younger adults are more likely to use public transport (PT) than older adults, with a focus on the types of places where people live and work, including proximity to train stations, population density, job density, motor vehicle ownership and driver’s licence ownership.
In the first post, we found younger adults in Melbourne were more likely to live and work close to the CBD, but this didn’t fully explain why they were more likely to use public transport.
This analysis uses 2016 ABS census data for Melbourne, and data for the years 2012-18 from Melbourne’s household travel survey (VISTA) – all being pre-COVID19. See the first post for more background on the data.
Proximity to train stations
Melbourne’s train network is the core mass rapid transit network of the city offering relatively car-competitive travel times, particularly for radial travel. It’s not Melbourne’s only high quality public transport, but for the want of a better metric, I’m going to use distance from train stations as a proxy for public transport modal competitiveness, as it is simple and easy to calculate.
In 2016 younger adults (and curiously the elderly) were more likely to live near train stations:

Almost 40% of people in their 20s lived within one km of a station. Could this partly explain why they were more likely to use public transport?
Well, maybe partly, but public transport mode shares of journeys to work were quite different between younger and older adults at all distances from train stations:

Public transport mode shares fell away with distance from stations, and age above 20 (the 15-19 age band being an exception).
With VISTA data we can look at general travel mode share by home distance from a train station:
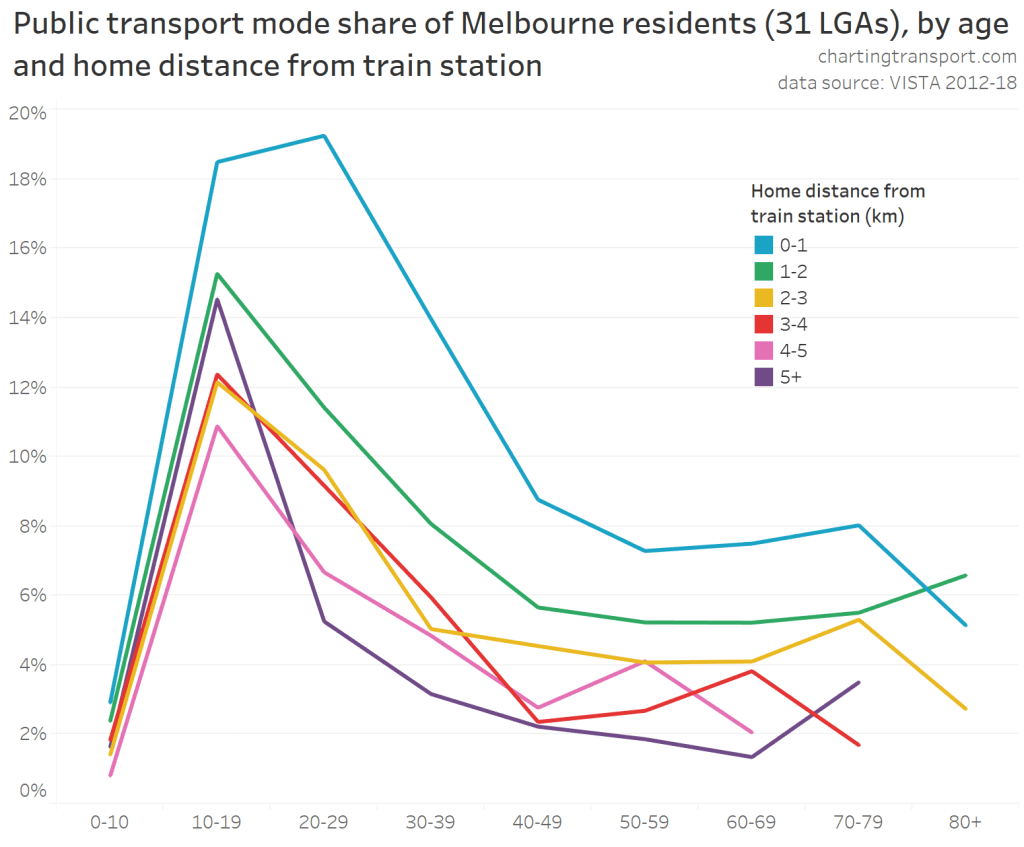
There’s clearly a relationship between PT mode share and proximity to stations, but there’s also a strong relationship between age and PT use, at all home distance bands from train stations.
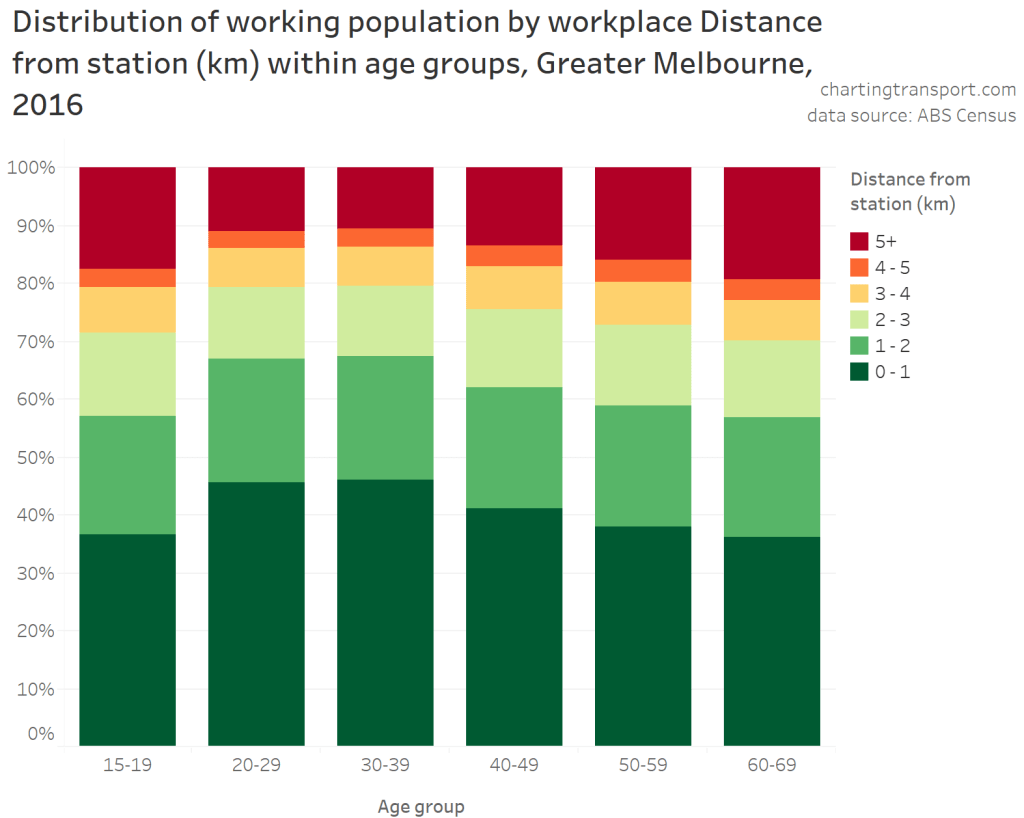
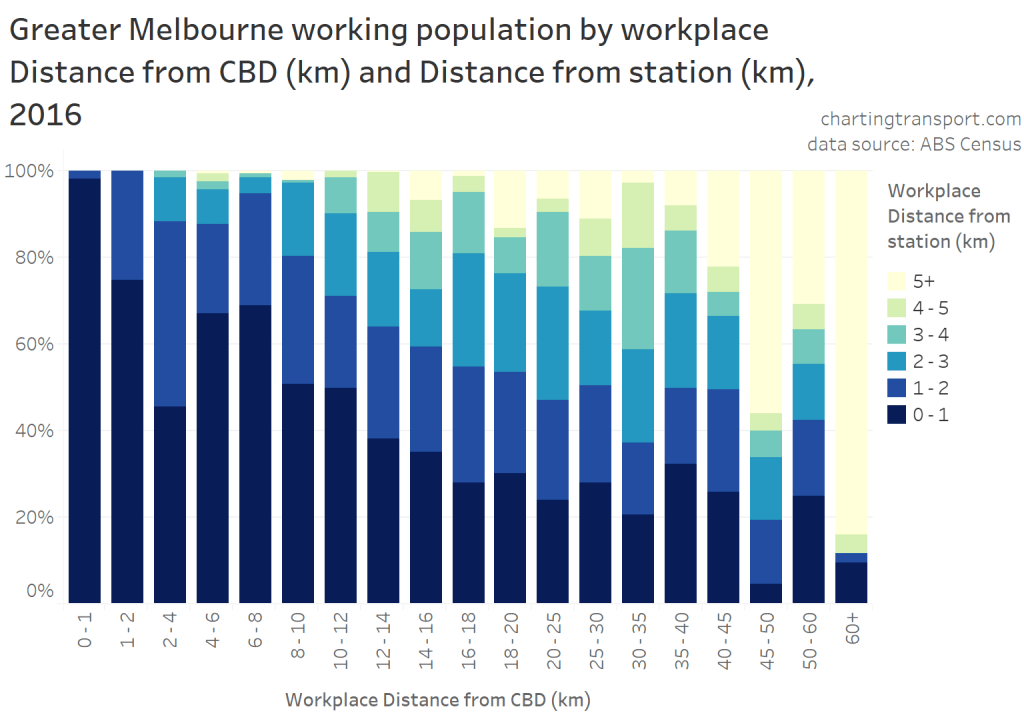
Younger adults were also more likely to work close to a train station. Indeed 46% of them worked within about 1 km of a station:
And unsurprisingly people who work near train stations are also more likely to live near train stations:
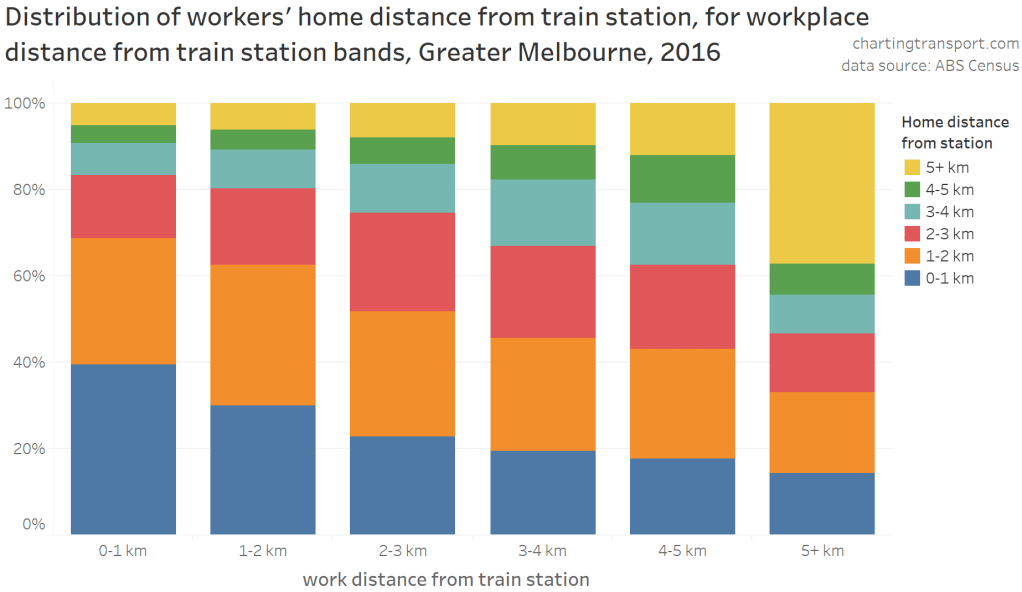
The chart shows around 70% of people who worked within 1 km of a station lived within 2 km of a station. Also, 37% of people who worked more than 5 km from a station, also lived more than 5 km from a station.
But again, journey to work PT mode shares varied by both age and workplace distance from a train station:

For completeness, here is another matrix-of-worms chart looking at journey to work PT mode shares by age for both work and home distances from train stations:
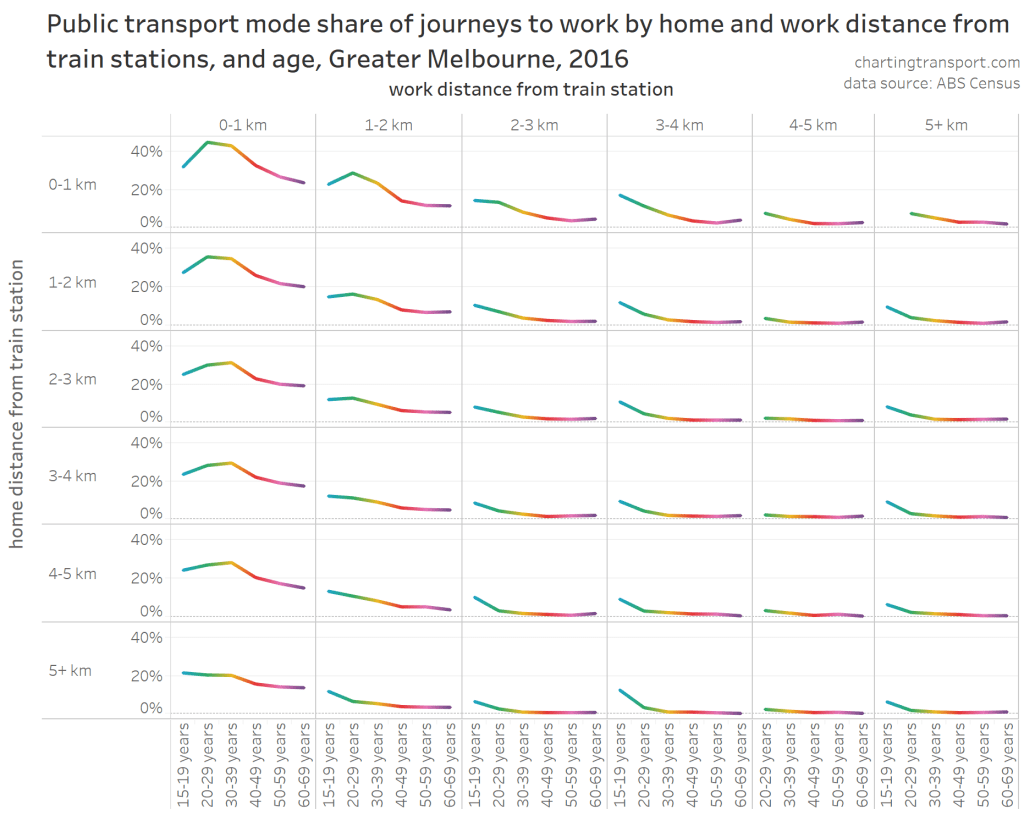
PT mode share declined with age for most distance combinations, but this wasn’t true for the 15-19 age band, particularly where both home and work were within a couple of kms of a station. We know from part one that teenagers are much less likely to work in the city centre, so this might represent teenagers who happen to live near a station, but work locally and can easily walk or cycle to work.
If we take age out for a moment, here is the relationship between PT mode share of journeys to work and both home and work distance from train stations:

The relationship between PT mode share and work distance from a train station is much stronger than for home distance from a station.
So while home and work proximity to train stations influenced mode shares, it doesn’t fully explain the variations across ages. So what if we combine…
Work distance from the CBD, home distance from a train station
Work distance from a station is strongly related to work distance from the CBD, as the CBD and inner city has a higher density of train stations:
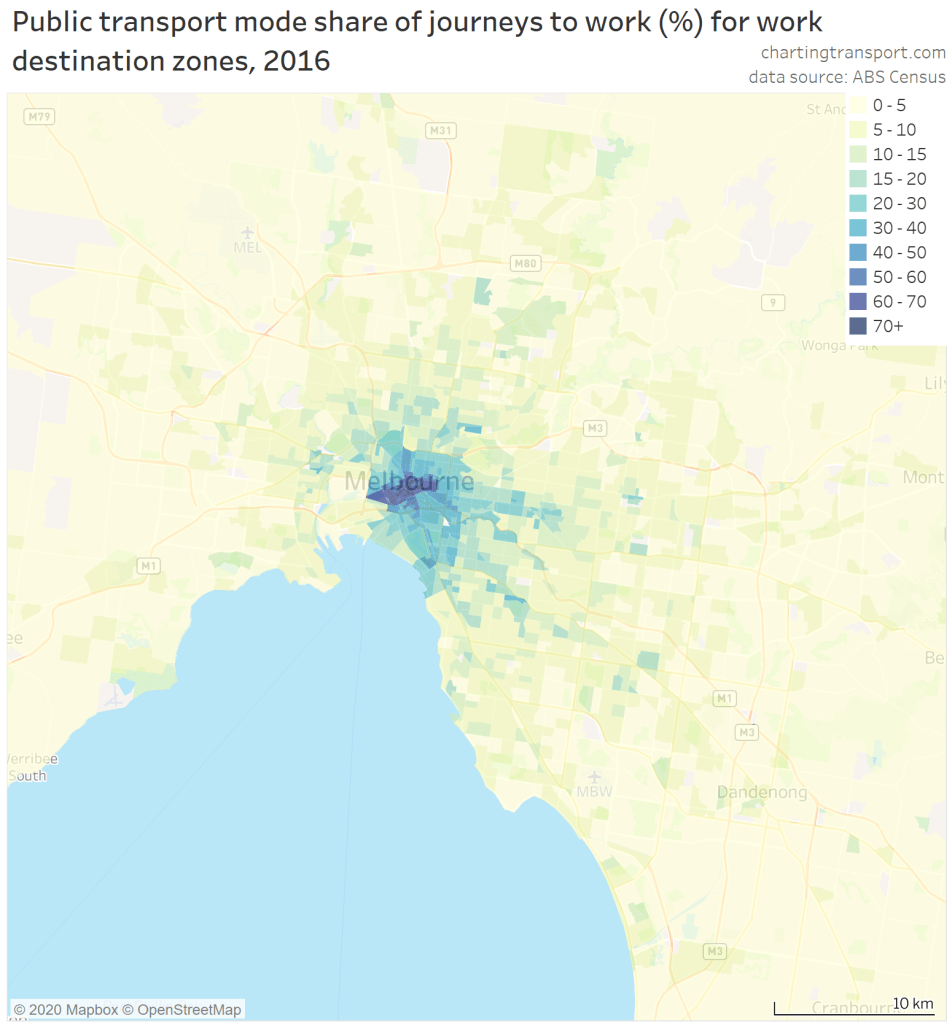
I expect workplace proximity to a train station to be a weaker predictor of mode share when compared workplace distance from CBD. That’s pretty evident when looking at journey to work PT mode share by place of work on a map:
And even more evident when you look at PT mode shares for both factors (regardless of age):

So perhaps work distance from the CBD, and home distance from a train station might be two strong factors for mode share? If we control for these factors, is there still a difference in PT mode shares across ages?
Time for another matrix of worms:

The chart shows that even when you control for both home distance from a station, and work distance from the CBD, there is still a relationship with age (generally declining PT mode share with age, with teenagers sometimes an exception). So there must be other factors at play.
Population density
Consistent with proximity to train stations and the CBD, younger adults are more likely to live in denser residential areas:
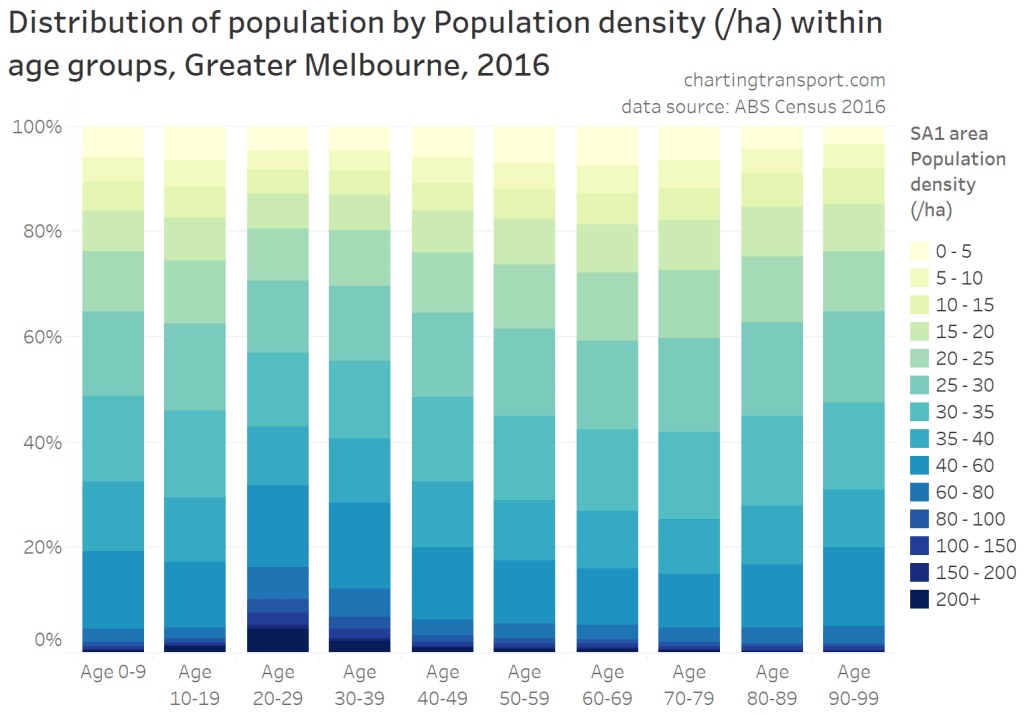
Higher residential density often comes with proximity to higher quality public transport. Indeed, here is the distribution of population densities for people living at different distances from train stations:

The next chart shows the relationship between residential density and mode shares – split between adults aged 20-39 and those aged 40-69:
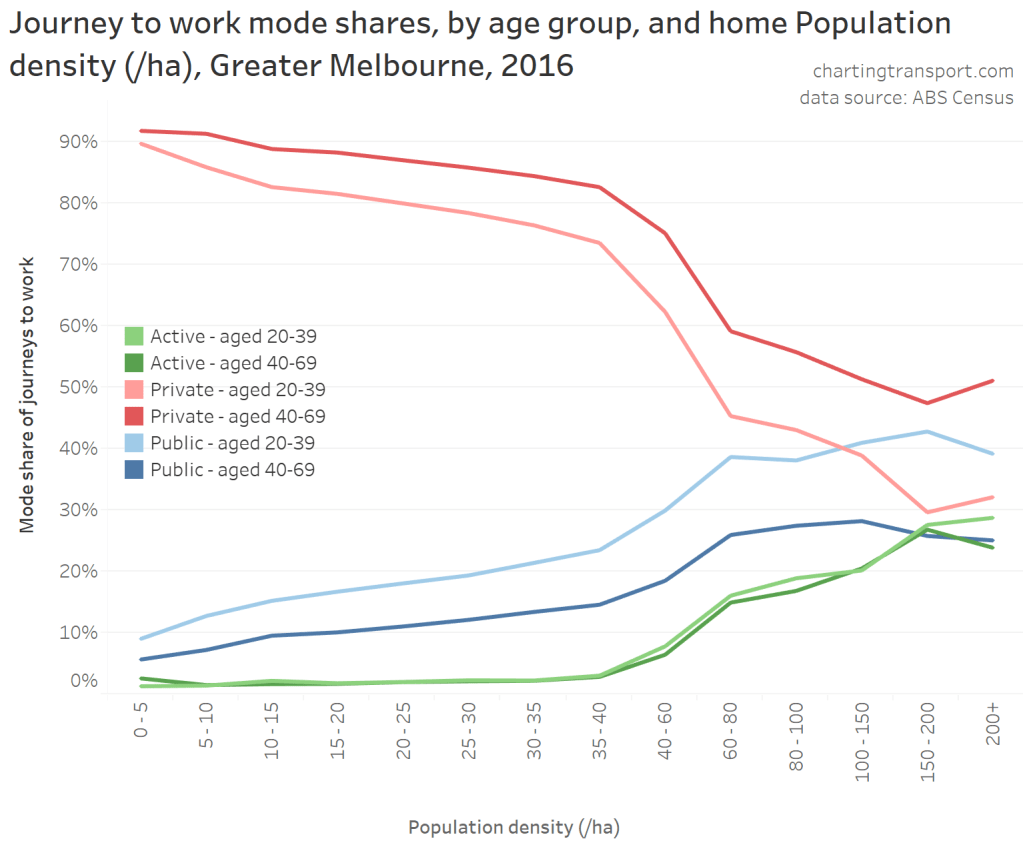
The chart shows that both age and residential density are factors for journey to work mode shares. Younger adults had higher public transport mode shares for journeys to work at all residential density bands.
Similarly, VISTA data also shows PT mode shares vary significantly by both age and population density for general travel:
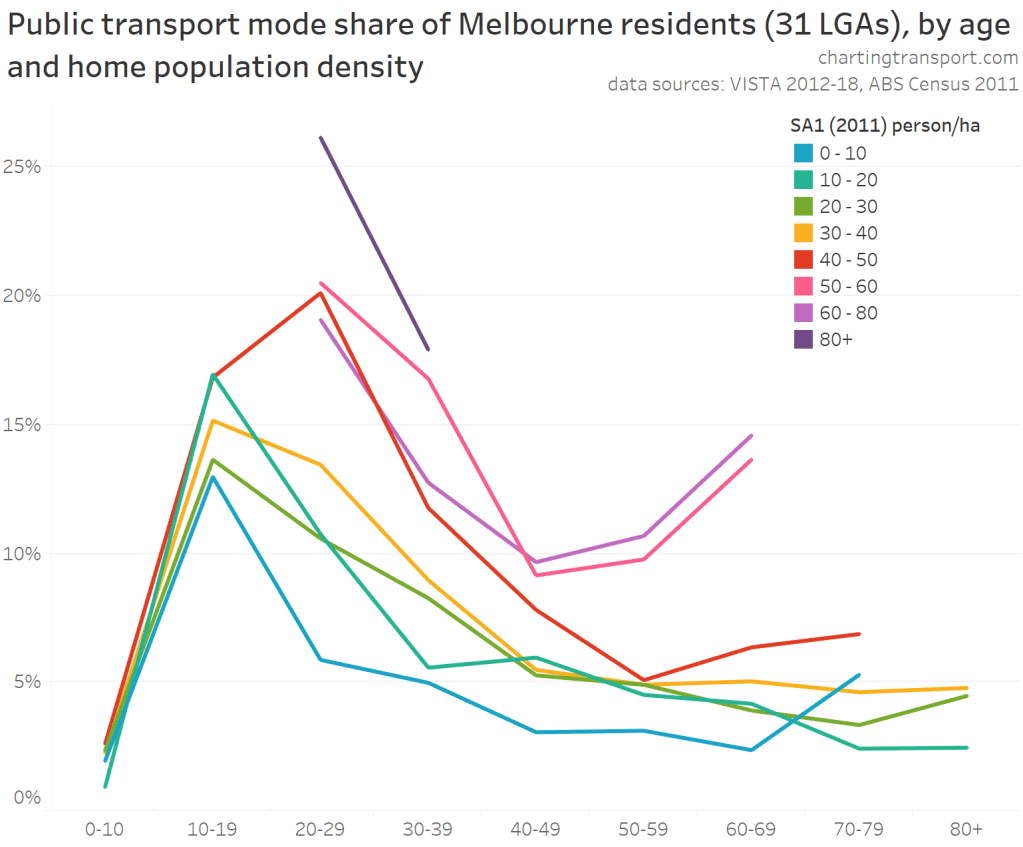
Technical note: data only shown where age band and density combination had at least 400 trips in the survey.
Curiously, people in their 60s living in areas with densities of 50-80 persons/ha were more likely to use public transport to get to work than those in their 40s and 50s living in the same densities (maybe due the presence of children?). For lower densities, PT mode share generally declined with increasing age (from 20s onward).
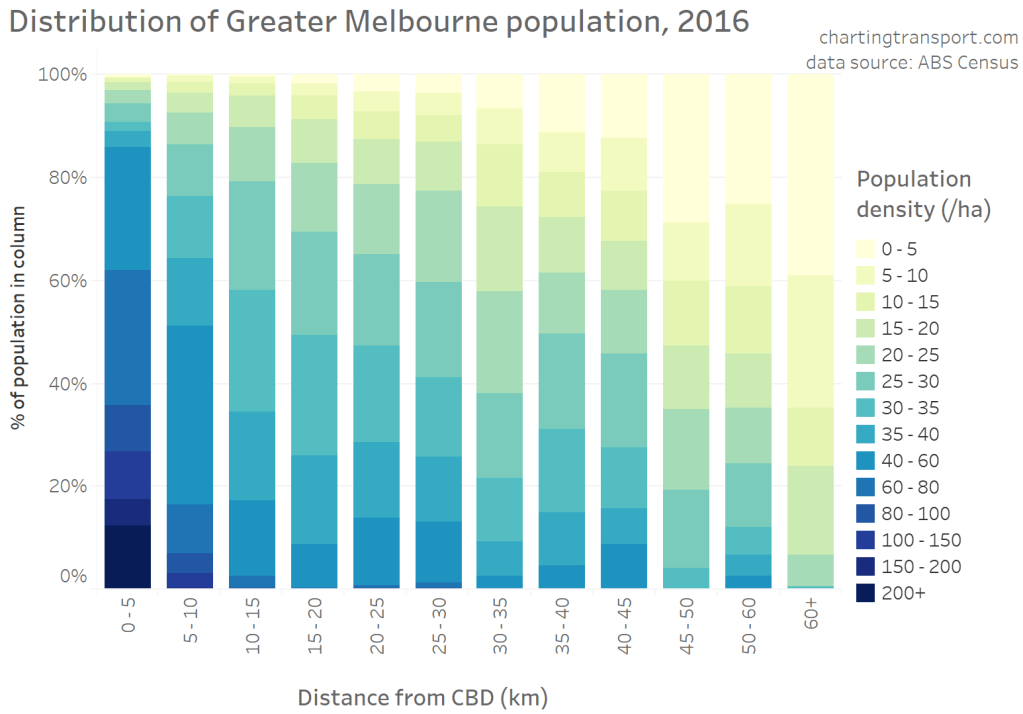
Population density is also generally related to distance from the CBD:
And here is a chart showing how PT mode share of journeys to work varied across both:
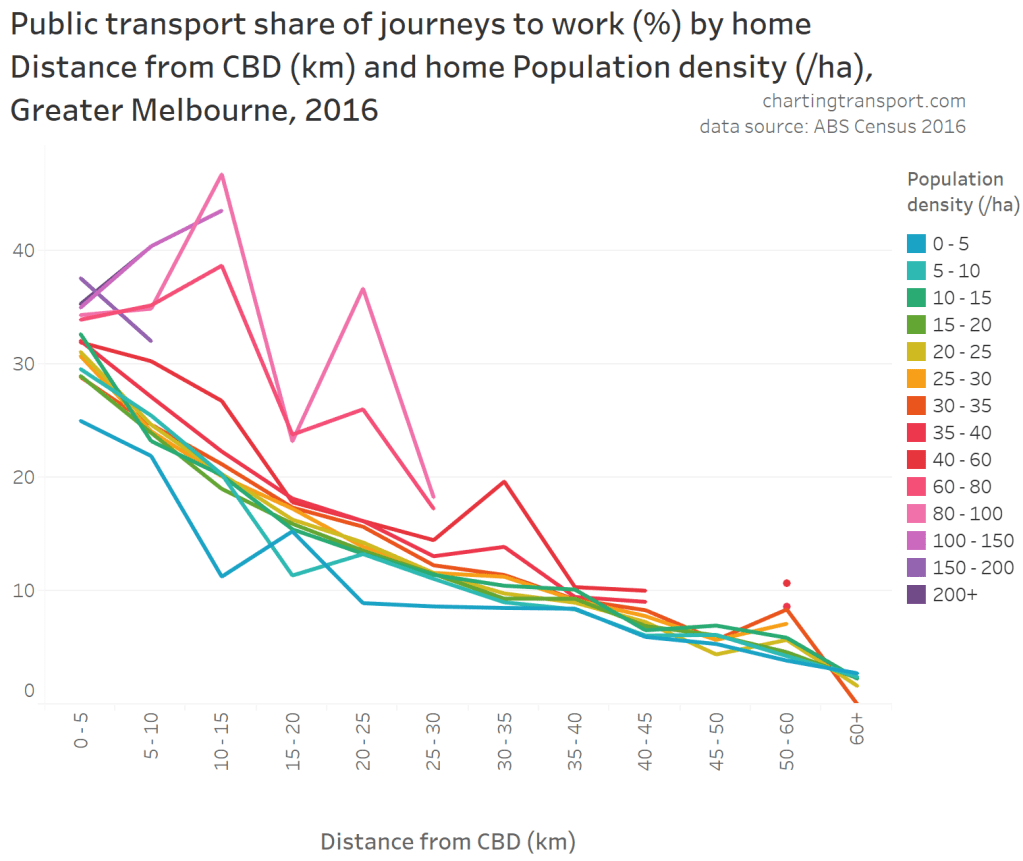
The chart shows home distance from the CBD had a larger impact on mode shares than population density. Indeed population density only seemed to have a secondary impact for densities above 40 persons/ha. However, as we saw in the first post, people living closer to the CBD were more likely to work in the city centre, and therefore more likely to use public transport in their journey to work.
Job density
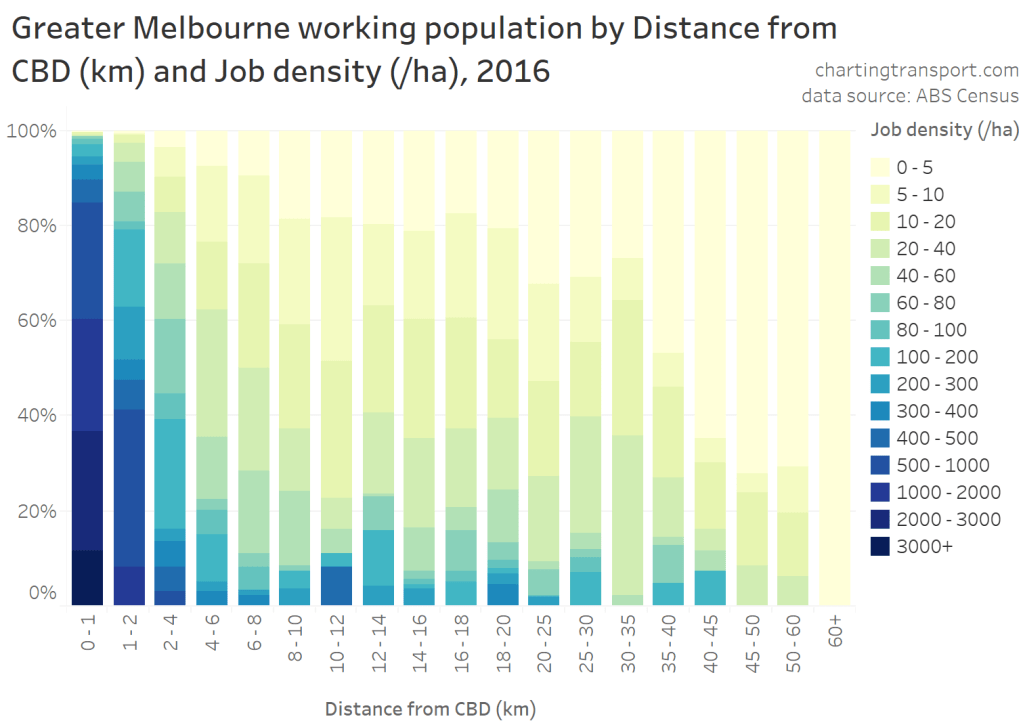
Young adults were more likely to work in higher density employment areas in 2016, where public transport is generally more competitive (with more expensive car parking):

But yet again, there is a difference in mode shares between age groups regardless of work location job density:
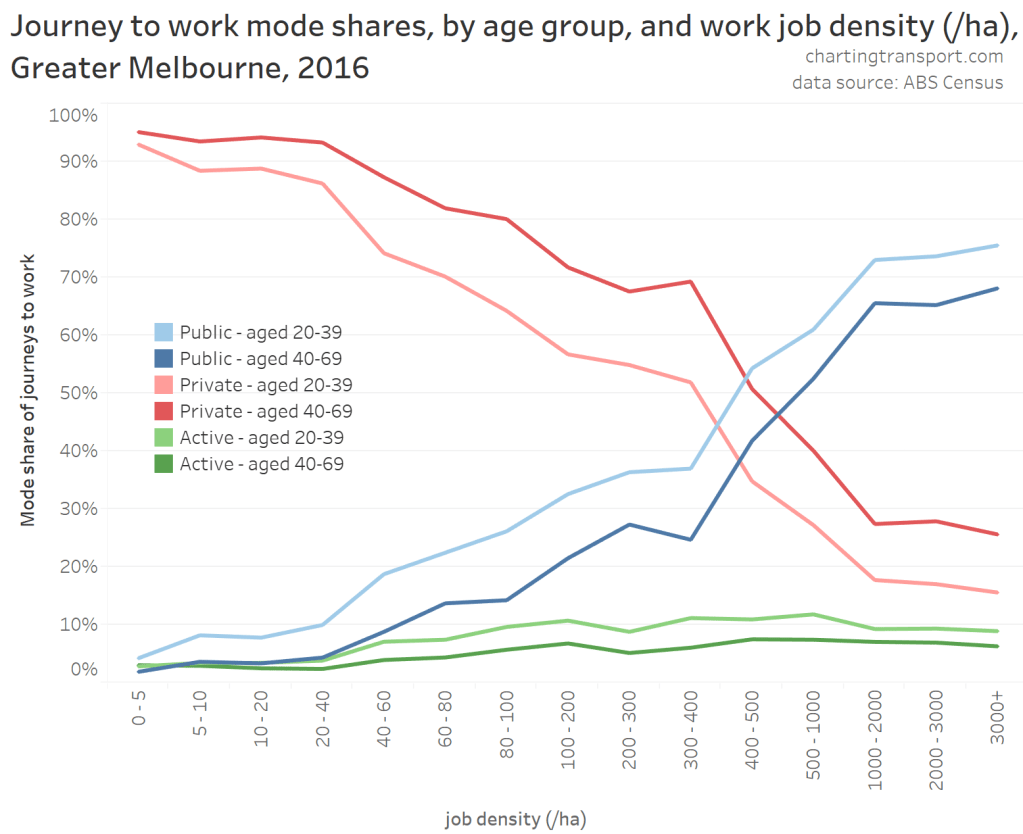
So job density doesn’t fully explain the difference in PT mode shares across age groups.
I should add that job density is also strongly related to workplace distance from the CBD:
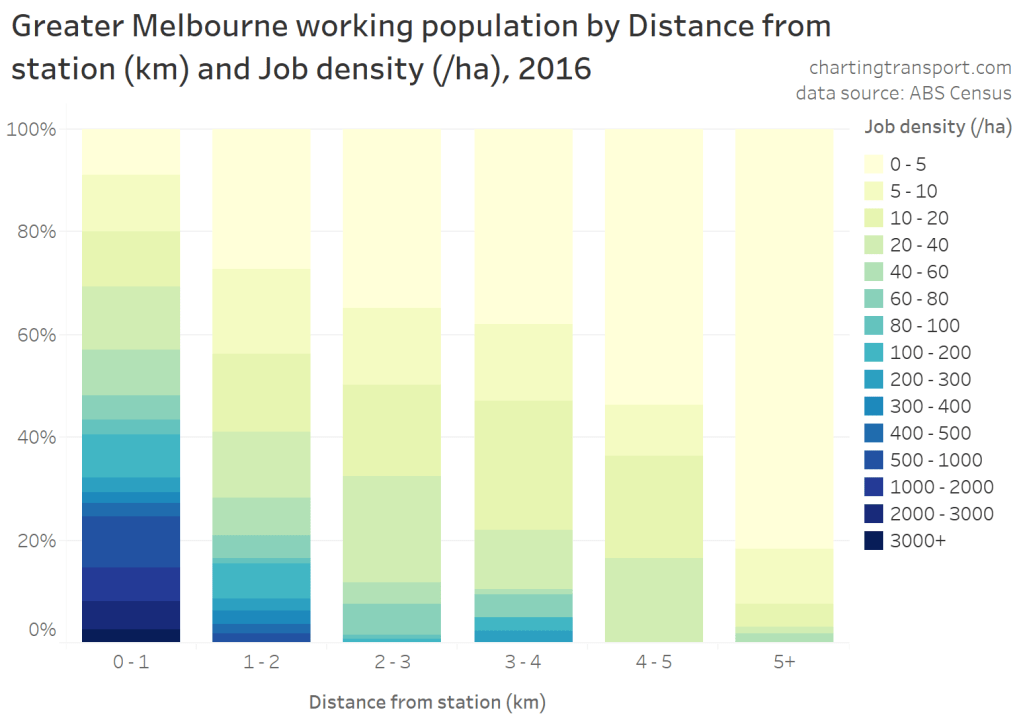
and workplace distance from train stations:
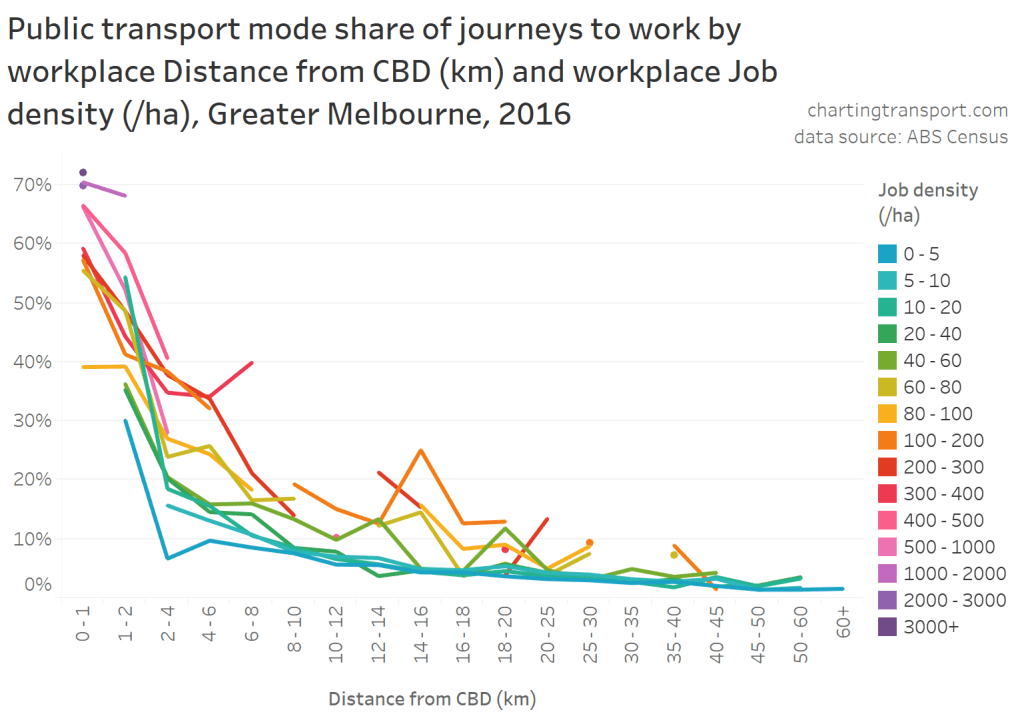
And putting aside age, PT mode shares for journeys to work are related to both workplace distance from the CBD and job density:
PT mode shares are also related to both job density and workplace distance from stations:
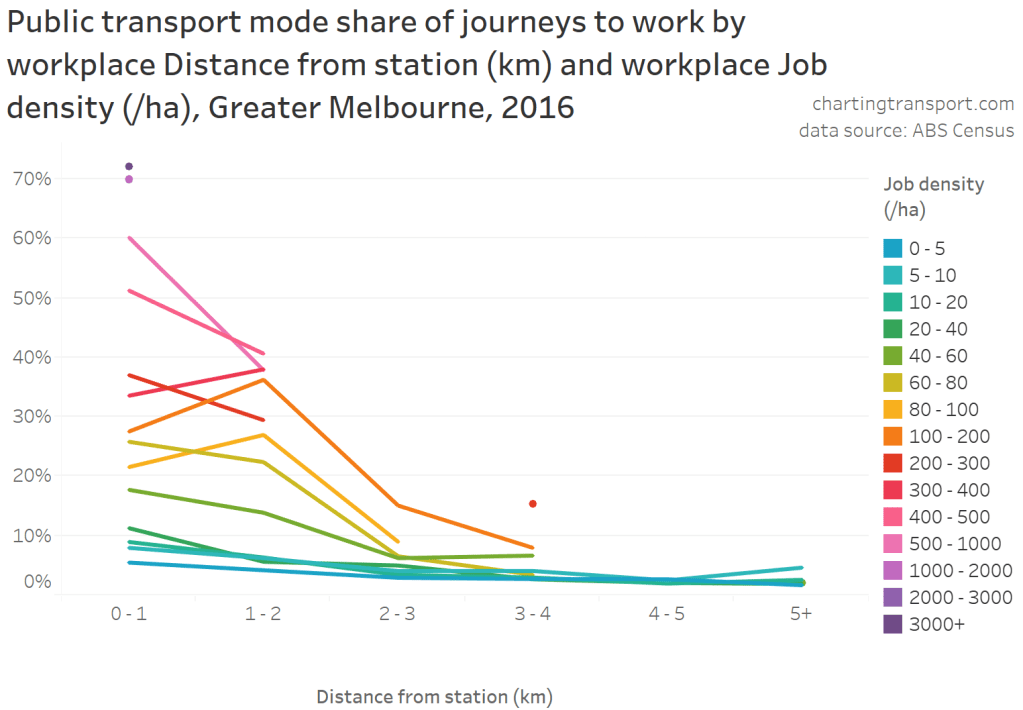
You might be wondering about the dot of higher job density (200-300 workers/ha) that is between 3 and 4 km from a train station. It’s one destination zone that covers Doncaster Westfield shopping centre – a large shopping centre on a relatively small piece of land (almost all of the car parking is multistory – see Google Maps)
Motor vehicle ownership
Are younger adults more likely to use public transport because they are less likely to own motor vehicles?
With census data, it is possible to measure motor vehicle ownership on an SA1 area basis by adding up household motor vehicles and persons aged 18-84 (as an approximation of driving aged people) and calculating the ratio. Of course individual households within these areas will have different levels of motor vehicle ownership.
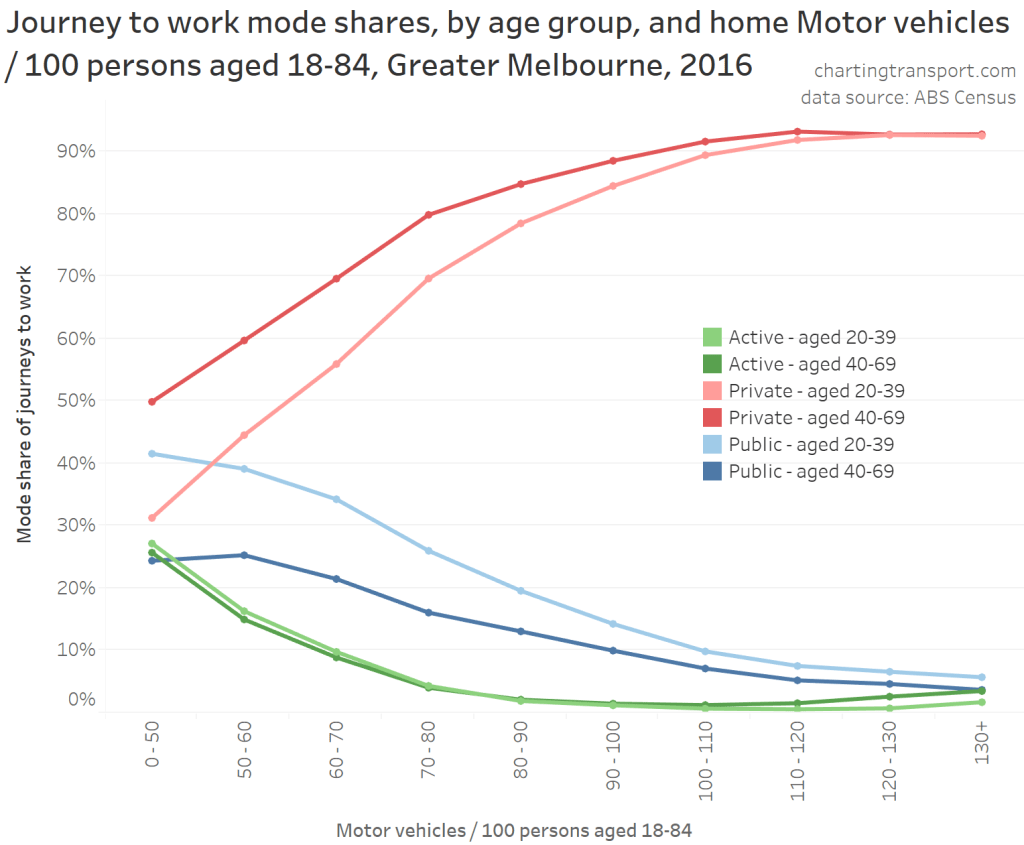
Using this metric, young adults were indeed more likely to live in areas which have lower levels of motor vehicle ownership (in 2016):

But yet again, the PT journey to work mode shares varied between younger and older adults regardless of the levels of motor vehicle ownership of the area (SA1) in which they live:
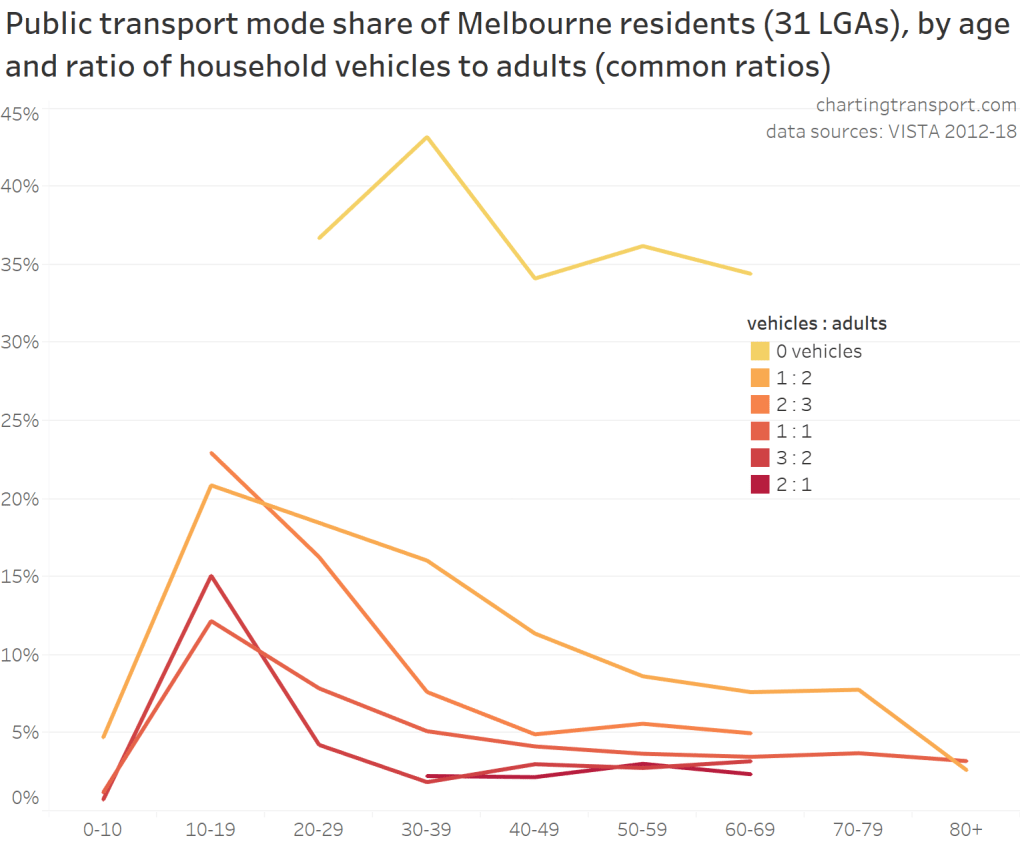
Using VISTA data, we can calculate motor vehicle ownership at a household level. I’ve classified households by the ratio of motor vehicles to adults.
VISTA data shows PT mode shares strongly related to both age and motor vehicle ownership (I’ve shown the most common ratios):
You might be wondering why I didn’t calculate motor vehicle ownership at the household level for census data. Unfortunately it’s not possible for me to calculate the ratio of household motor vehicles to number of adults because ABS TableBuilder doesn’t let me combine the relevant data fields (for some reason).
The best I can do is the ratio of household motor vehicles to the usual number of residents (of any age). The usual residents may or may not include children under driving age – we just don’t know.
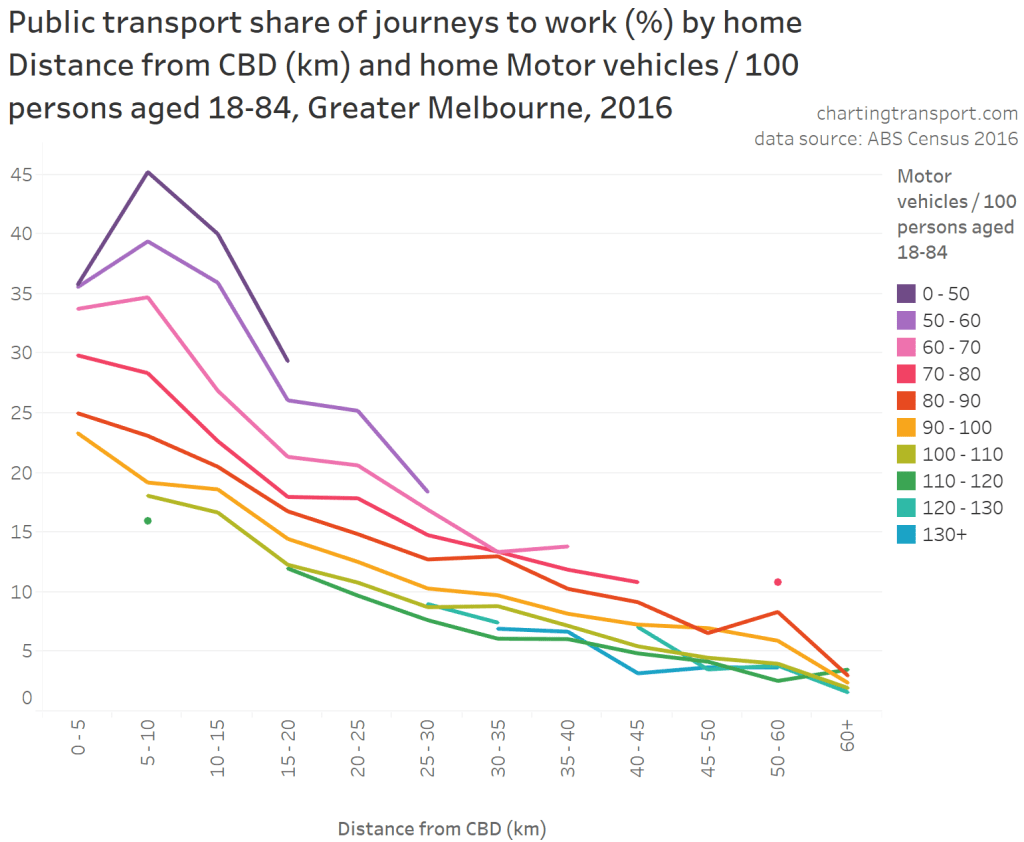
Nevertheless the data is still interesting. Here is how public transport mode shares of journeys to work varied across different vehicle : occupant combinations for households in Greater Melbourne:

Yes that’s a lot of squiggly lines – but for most combinations (excluding those with zero motor vehicles) there was a peak of PT mode share in the early 20s, and then a decline with increasing age.
The lines with green and yellow shades – where the ratio is around 1:2 or 1:3 – show a sharp drop around the mid 20s. I expect these lines are actually a mix of working parents with younger children, and working adult children living with their (older) parents. The high mode shares for those in their early 20s could represent many adult children living with their parents (but without their own car), while those in their 30s and 40s are more likely to be parents of children under the driving age. So the sharp drop is probably more to do with a change in household age composition.
If we want to escape the issue of children, the highest pink line is for households with one motor vehicle and one person (so no issues about the age of children because there are none present) – and that line has a peak in PT mode share in the mid 30s and then declines with age, suggesting other age-related factors must be in play.
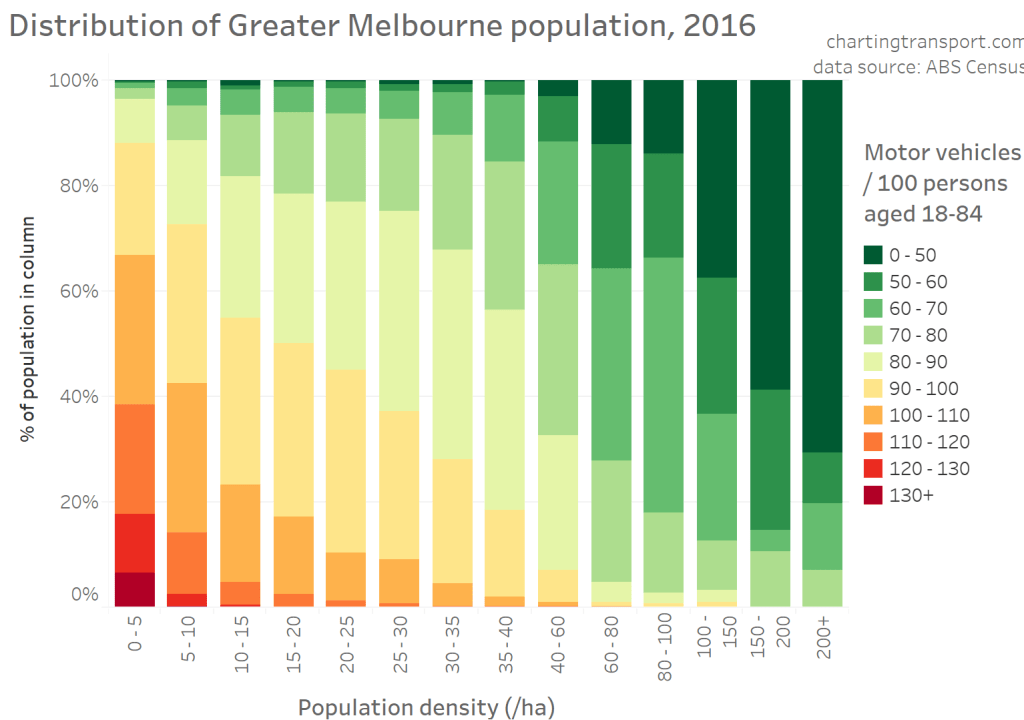
But motor vehicle ownership levels aren’t only related to age. They are strongly related to population density,
..home distance from the CBD,

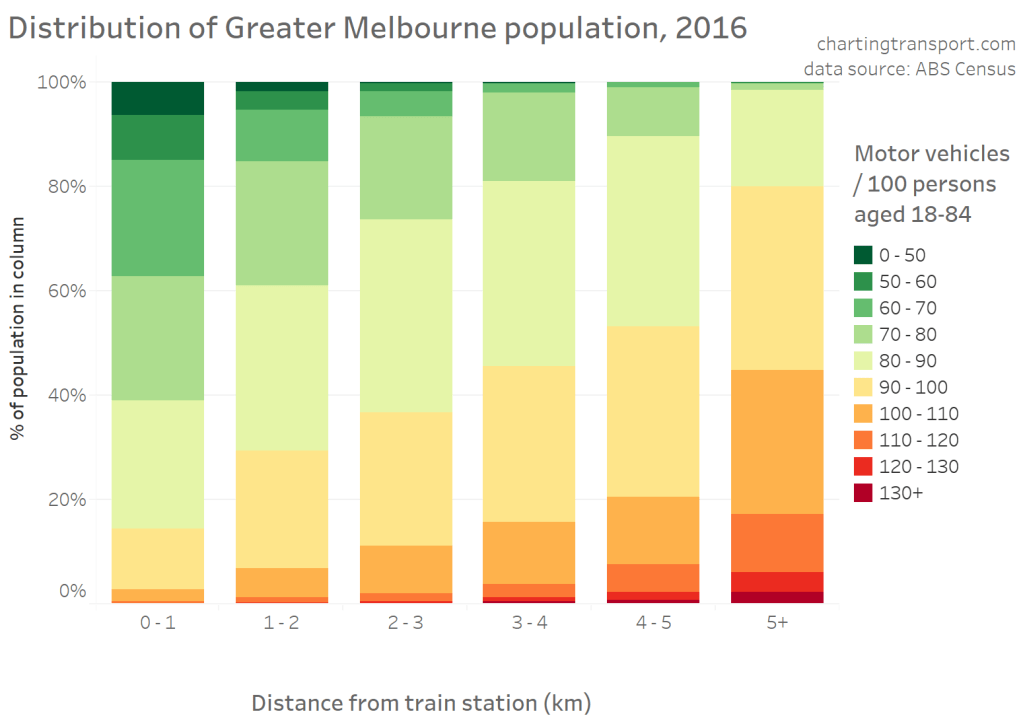
..and home distance from train stations:
And public transport mode shares are related to both motor vehicle ownership rates and population density (with motor vehicle ownership probably being the stronger factor):

Technical note: for these charts I’ve excluded data points with fewer than 5 qualifying SA1s to remove anomalous exceptions.
Public transport mode shares are also related to both motor vehicle ownership and home distance from the CBD:
And shares are also related to both motor vehicle ownership and home distance from a train station:
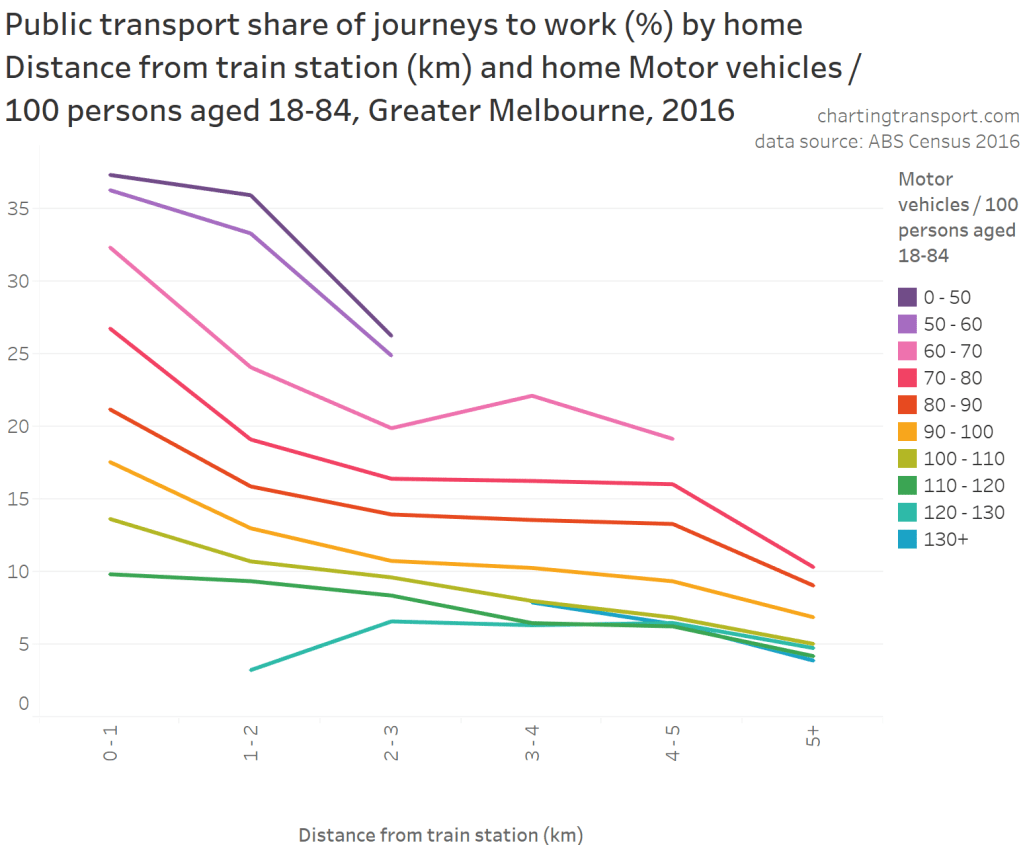
In all three cases, PT mode shares fell with increasing levels of motor vehicle ownership, but this effect mostly stopped once there were more motor vehicles than persons aged 18-84.
Drivers licence ownership
I’ve previously shown on this blog that people without a full car driver’s licence are much more likely to use public transport, which will surprise no one. So are younger adults less likely to have a driver’s licence?
VISTA data shows us that younger adults are indeed less likely to have a car driver’s licence, with licence ownership peaking around 97% for those in their late 40s and early 50s, and only dropping to 91% by age 75 (there is a little noise in the data):
So the lack of a driver’s licence by many young adults will no doubt partly explain why they are more likely to use public transport.
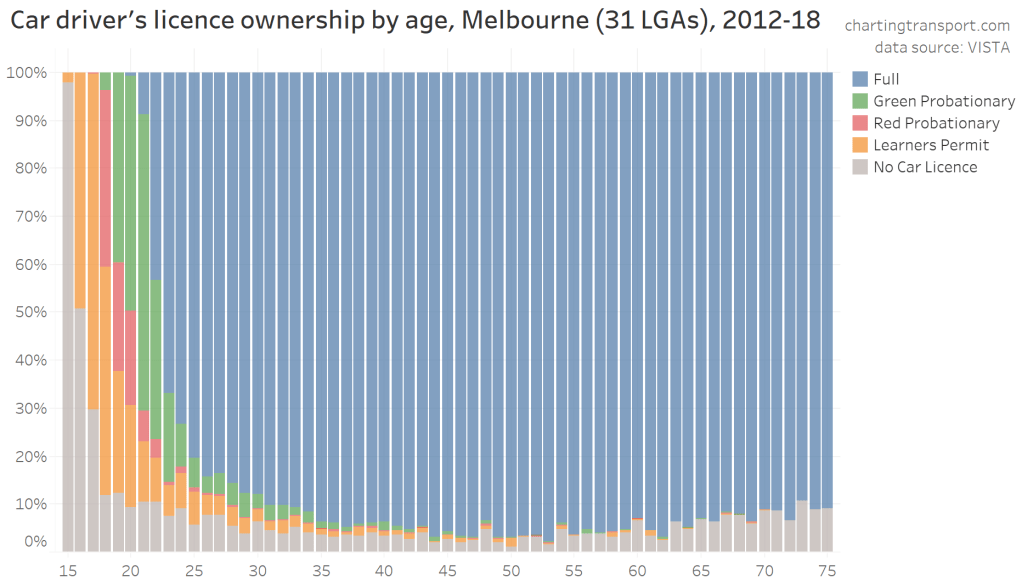
Consistent with VISTA, data from the BITRE yearbooks also shows that younger adults have become less likely to own a licence over time:
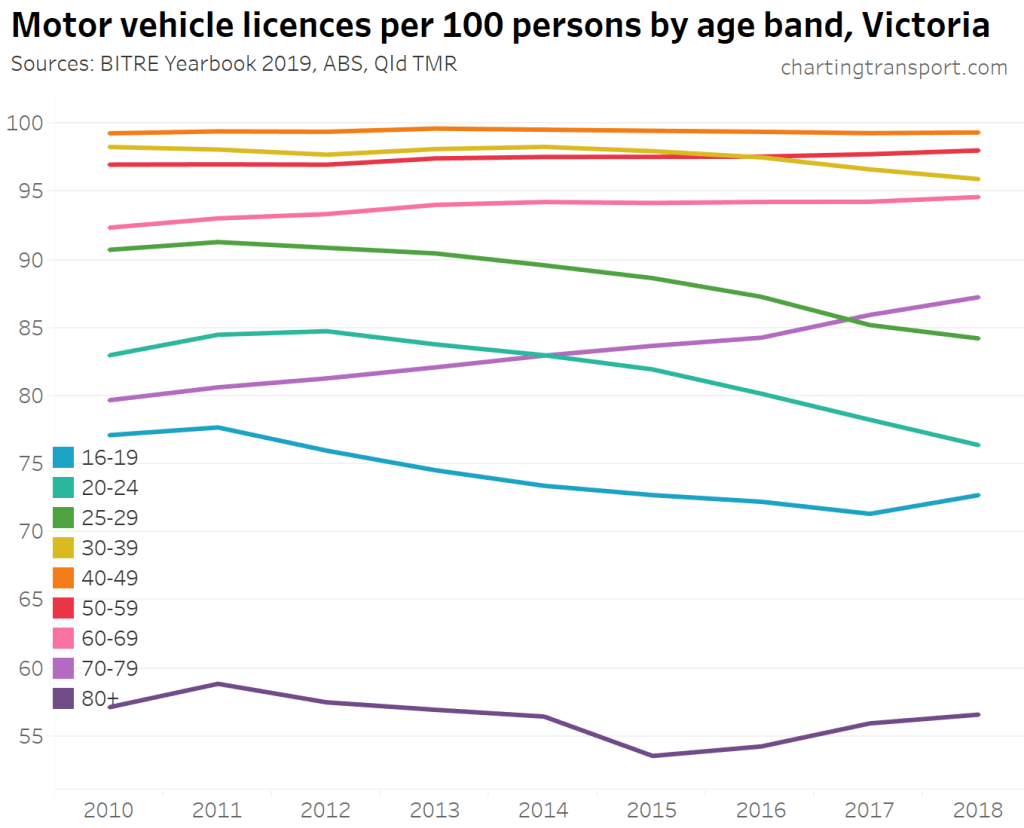
At the same time, those aged 60-79 have been more likely to own a licence over time.
But do public transport mode shares vary by age, even for those with a solo driver’s licence? (by solo, I mean full or probationary licence). The following chart shows public transport mode shares for age bands and licence ownership levels (data points only shown where 400+ trips exist in the survey data).
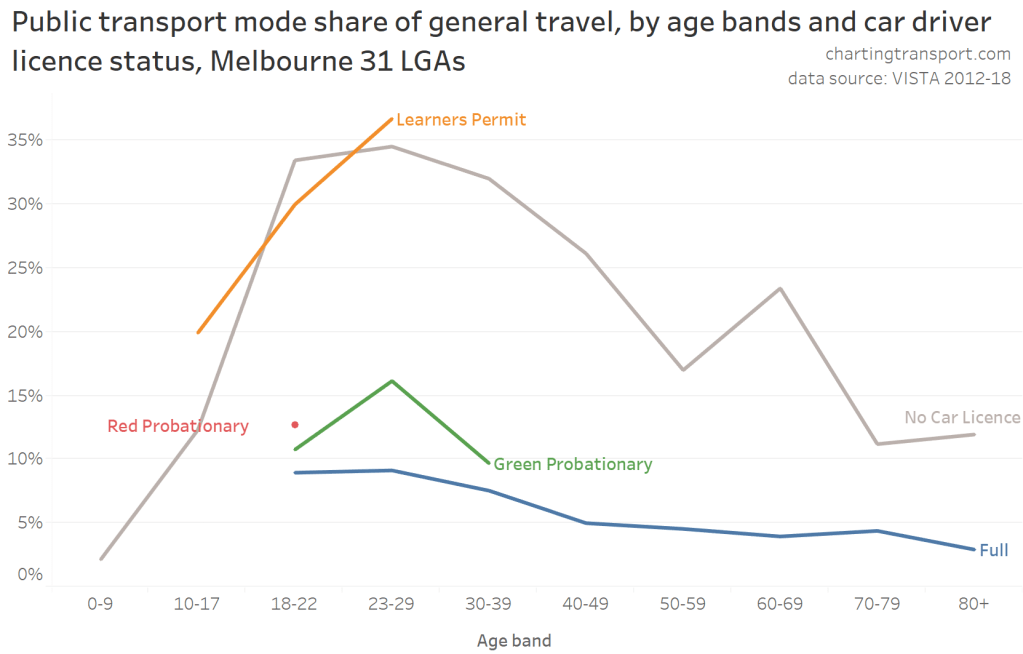
PT mode shares peaked for age band 23-29 for most licence ownership levels, including no licence ownership (there isn’t enough survey data for people older than 22 with red probationary licences – the licence you have for your first year of solo driving).
As an aside, there is a curious increase in public transport mode share for those aged over 60 without a drivers licence – this may be related to these people being eligible for concession fares and occasional free travel with a Seniors Card (if they work less than 35 hours per week).
So even younger adults who own a driver’s licence are more likely to use public transport.
But is this because they don’t necessarily have a car available to them? Let’s put the two together…
Motor vehicle and driver’s licence ownership
For the following chart I’ve classified households as:
- “Limited MVs” if there were more licensed drivers than motor vehicles attached to the household,
- “Saturated MVs” if there was at least as many motor vehicles as licensed drivers, and
- “No MVs” if there were no motor vehicles associated with the household.
If there were any household motor vehicles I’ve further disaggregated by individuals with a solo licence and those without a solo licence (the latter may have a learner’s permit). I’ve only shown data points with at least 400 trip records in the category to avoid small sample noise (I am reliant on VISTA survey data).
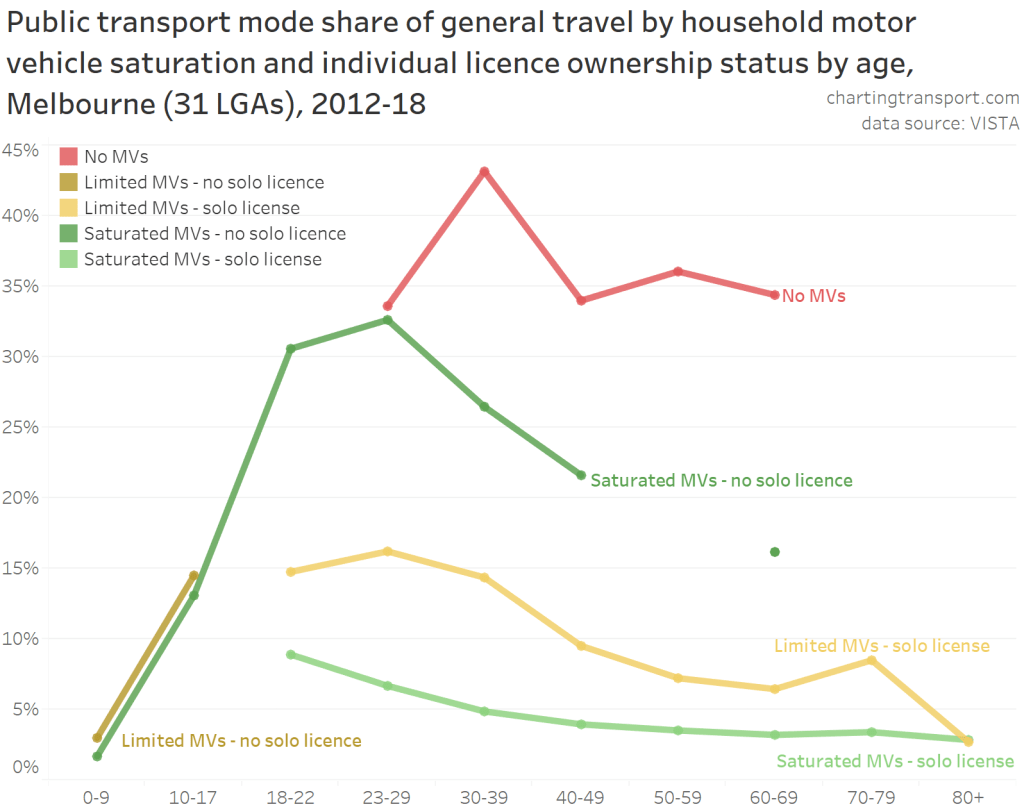
Except for households with no motor vehicles, public transport mode share peaked for age band 18-22 or 23-29 and then declined with increasing age. So again there must be other age-related factors. However the impact of age is smaller than that of motor vehicle ownership and licence ownership.
Unfortunately driver’s licence ownership data is not collected by the census, so it is not possible to combine it with other demographic variables from the census.
Summary
So, what have we learnt in part two:
- Younger adults are more likely to work and live near train stations, but that only partly explains why younger adults are more likely to use public transport.
- Workplace distance from the CBD has a much bigger impact on public transport mode shares for journeys to work than home distance from a train station.
- Younger adults are more likely to live in areas with higher residential density, but this only partly explains why they are more likely to use public transport.
- Younger adults are more likely to work in areas with higher job density but this is highly correlated with workplace distance from the CBD, which is a stronger factor influencing mode shares.
- Younger adults are more likely to live in areas with lower motor vehicle ownership (these areas are generally also have higher residential density and are closer to the city centre and to train stations), but this again only partly explains why they are more likely to use public transport. Motor vehicle ownership appears to be a stronger factor influencing mode shares than population density, distance from stations, or distance from the city.
- Younger adults are less likely to have a driver’s licence, but again this only partly explains why they are more likely to use public transport.
While this analysis confirms younger adults tend to align with known factors correlating with higher public transport use, we are yet to uncover a factor or combination of factors that mostly explain the differences in public transport use between younger and older adults. That is, when we control for these factors we still see differences in public transport use between ages.
The next post in this series will explore the impacts on public transport use of parenting responsibilities, generational factors (birth years), and year of immigration to Australia.


Hi, some completely unscientific comments: observing friends and relatives I think many of the 40ish generation just don’t know how to get around on PT, they were driven to school etc and it’s their normal way of life. Whereas over 60s have used PT in their youth. Some people have also been brought up to think PT is beneath them, and others just find it a weird choice. On the other hand for inner city youth it’s now a normal and socially acceptable way of getting around. Proportion of younger people on PT outside commuting times has totally changed over last 30 years. Thank you for interesting articles!
LikeLike