I’ve been exploring data to explain why younger adults are more likely to use public transport (PT) than older adults in Melbourne. This third post in a series looks at the relationship between public transport mode share and parenthood, the year in which people were born, whether people were born in Australia or overseas, and how recently immigrants arrived in Australia.
I’m using VISTA household travel survey data (all travel) and ABS Census data (journey to work only). For more detail about the data, see the first post in the series.
Parenthood
Are younger adults more likely to use public transport because they don’t (yet) have dependent children?
Consistent with previous analysis on this blog, there is a relationship between PT mode share and whether people are parents within family households. Here’s the data for general travel from VISTA 2012-18:

Parents were much less likely to use public transport than non-parents of the same age, with mums between 35 and 55 having a lower mode share (on average) than dads in the same age range.
The census tells us whether a worker did unpaid child care for a child of their own in the two weeks prior to the census, which I am using to distinguish parents and non-parents.
The following chart shows the proportion of working men and women who were parents, animated over censuses 2006 to 2016.
Parenting peaked around age 40 for male and female workers, and the proportion of workers who were parenting went up between 2006 and 2016.
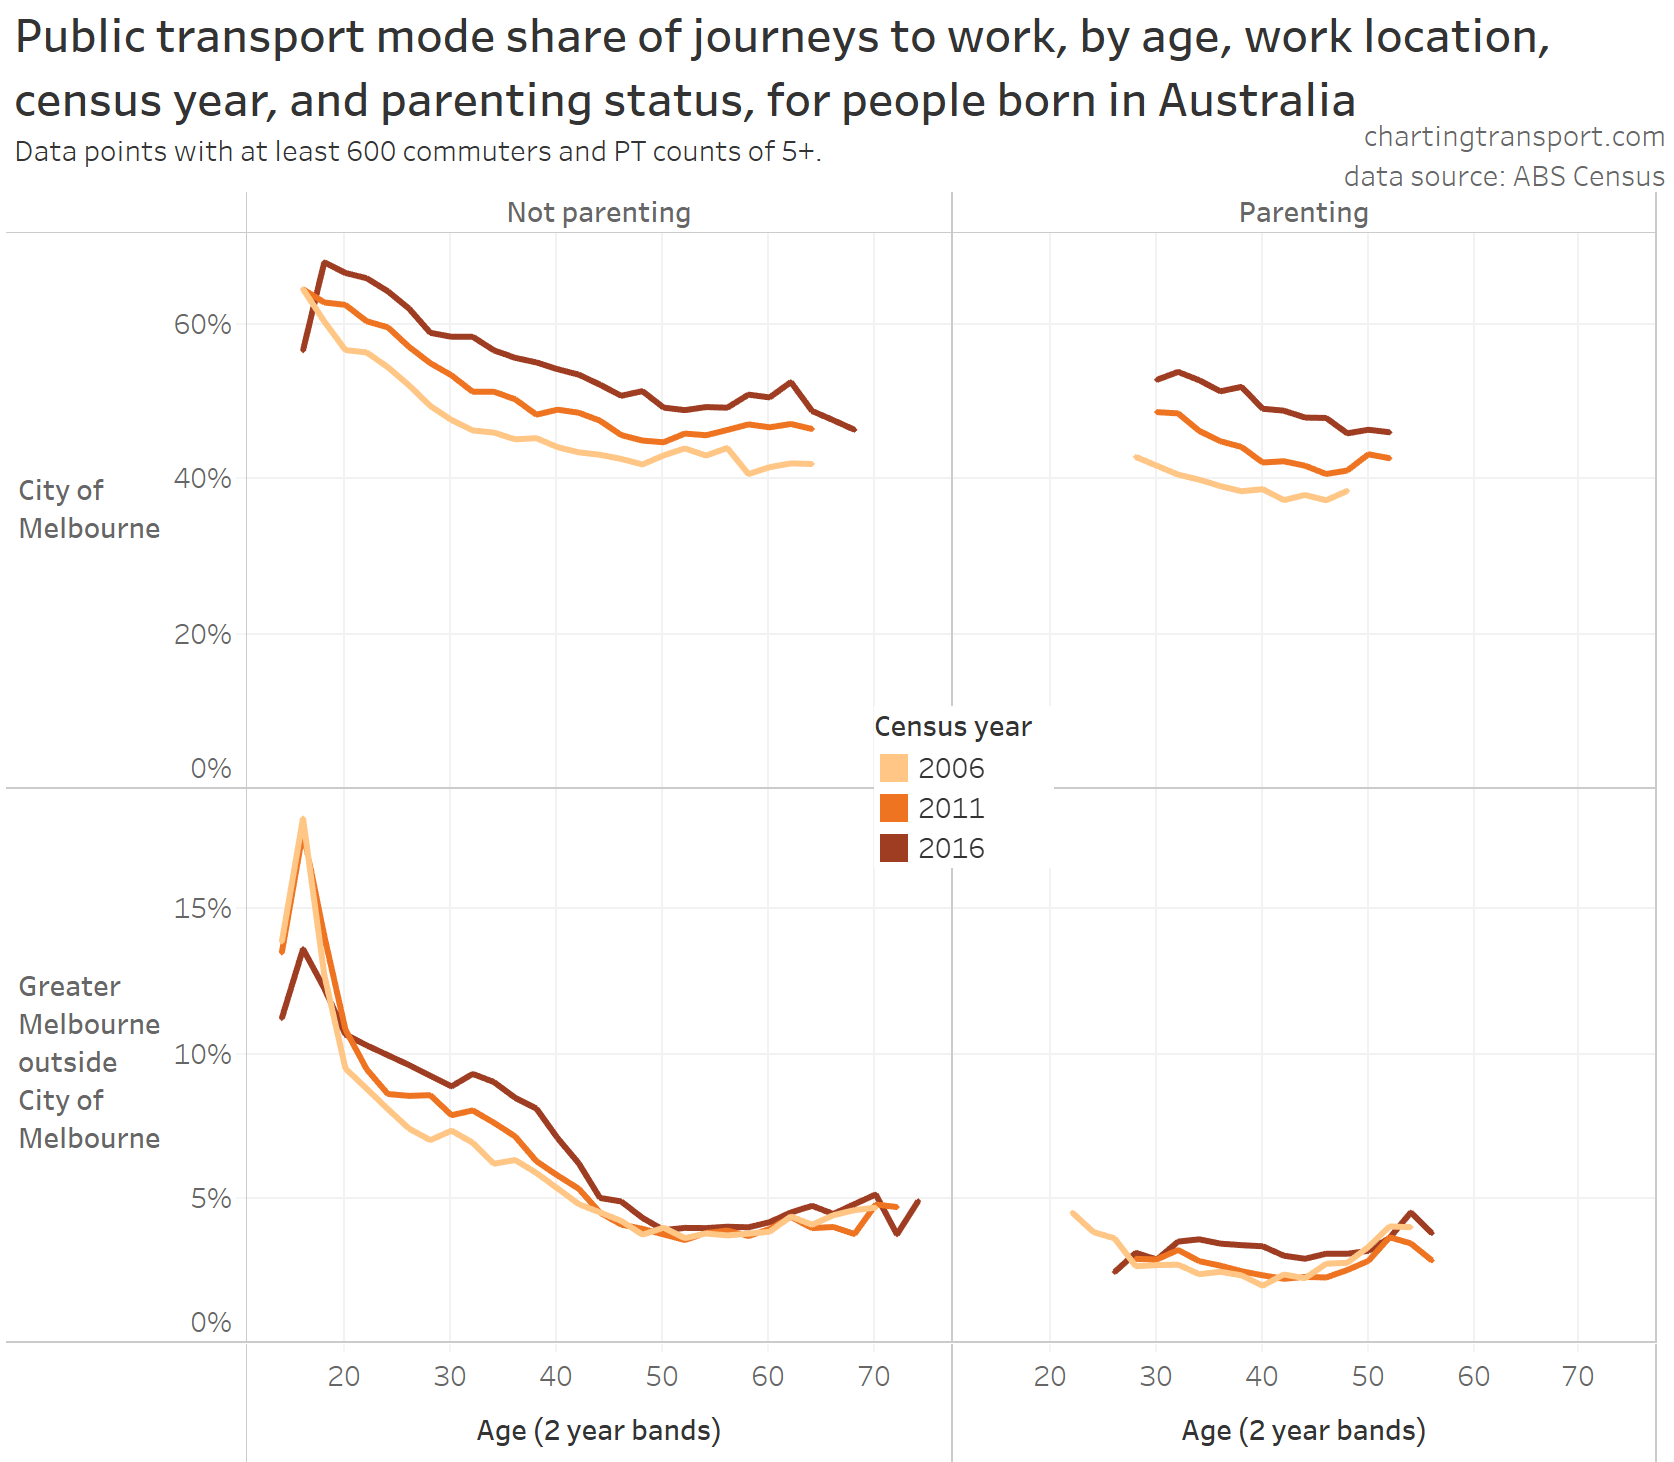
So how do public transport mode shares vary by age if we separate out parents and non-parents? The following chart answers this, and also separates workers by whether or not they worked in the City of Melbourne local government area (a known major factor influencing mode shares), animating results over 2006, 2011, and 2016:
Note there is a different Y-axis scale for City of Melbourne and elsewhere.
There are a few really interesting take-aways here:
- Parenting workers mostly had lower public transport mode shares than non-parenting workers of the same age, except for:
- dads over 30 who worked in the City of Melbourne,
- mums in their early 30s who worked in the City of Melbourne in 2016, and
- mums and dads in their 50s who worked outside the City of Melbourne (who had low PT mode shares around 4-5%, similar to non-parenting workers of the same age)
- Public transport mode shares increased over time for almost all age bands, work locations, and for parenting and non-parenting workers.
- Public transport mode shares for journeys to work in the City of Melbourne mostly declined with increasing age between 20 and 50, regardless of parenting responsibilities. Other age-related factors must be at play.
- For people who worked outside the City of Melbourne, the mode share profile across age changed significantly over time for young adults. In 2006 there was a steady decline with age, but in 2011 PT mode shares were generally flat for those in their 20s, and in 2016 PT mode shares peaked for women in their late 20s (and also had a quite new pattern for dads in their 20s).
- For parenting workers who work outside the City of Melbourne there was actually a slightly higher PT mode share for those over the age of 50. Parents over 50 might have older children who are more independent and therefore less reliant on their parents for transport. This might make it easier for the parents to use public transport. However this trend did not hold for dads in 2016.
- PT mode shares for non-parenting women increased slightly beyond age 55 for all work locations. This will include women who were never parents, as well mums with non-dependent children so might again reflect a small return to public transport once children become independent. It may also be influenced by discounted PT “Seniors” fares available to people over 60 who are not working 35+ hours per week.
Lower public transport mode shares for parents is not surprising – they may be more time-poor and need more transport flexibility to link trips – eg dropping kids at childcare on the way to work can be more difficult with public transport (although it doesn’t seem to impact men travelling to the city centre nearly as much as women – I suspect because women are more likely to be working part time and doing childcare drop-offs and pick-ups). Parents may decide that time saving and convenience moving children is more important to them than lower transport costs from using PT.
However, addition of parenting responsibilities does not fully explain why public transport mode share generally declined with increasing age, particularly for non-parenting workers.
But I’m curious about the changing profile of mode share by age over time. Could it be influenced by…
Birth year / generations
Does public transport mode share vary by age and/or does it vary by when people were born, with different mode choices by different generations? To answer this I’m going to look at mode shares by both age and birth year.
For this analysis, I want to compare mode shares of birth year cohorts over time. The exact composition of these cohorts will change over time as there are deaths, new immigrants, and people who move overseas. I can only easily control for immigrants using census data – so for this section of my analysis I’m going to remove people not born in Australia (I will return to look at mode shares of immigrants shortly). Of course some people born in Australia who worked in Melbourne in 2016 may have spent a significant time living outside Australia before a census so this isn’t perfect.
Firstly, here’s a chart of journey to work PT mode shares by age, work location, and parenting status across 2006, 2011, and 2016 for people born in Australia:
Technical note: I’ve excluded data points where there was a small number of commuters, or a small number of public transport journeys where calculations are impacted by ABS randomisation to protect privacy.
You can see the general shape of the census year curves are similar within each quadrant (with a little noise at the extremes of age probably due to smaller volumes), suggesting a similar relationship between PT mode share and age holds over time.
We can clearly see how mode shares have increased over time for age bands, including:
- those who work in the City of Melbourne (top row),
- non-parenting younger adults who worked outside the City of Melbourne (bottom-left), and
- to a smaller extent parents in their 30s and 40s who worked outside the City of Melbourne (bottom-right).
There were PT mode share spikes at age band 16-17 (at least for people working outside the City of Melbourne), which is just before people can gain independent licences. Those aged 18-19 working outside the City of Melbourne had a much lower PT mode share than those aged 16-17, and PT mode shares were lower again for those aged 15 who are perhaps more likely to work locally or be driven to work by parents.
So is this a general mode shift over time, or is it something intrinsic to birth years or “generations”? The next chart is similar to the previous, but the X-axis is notional birth year (approximated by census year – age at census time, which will be within a year of actual birth years).
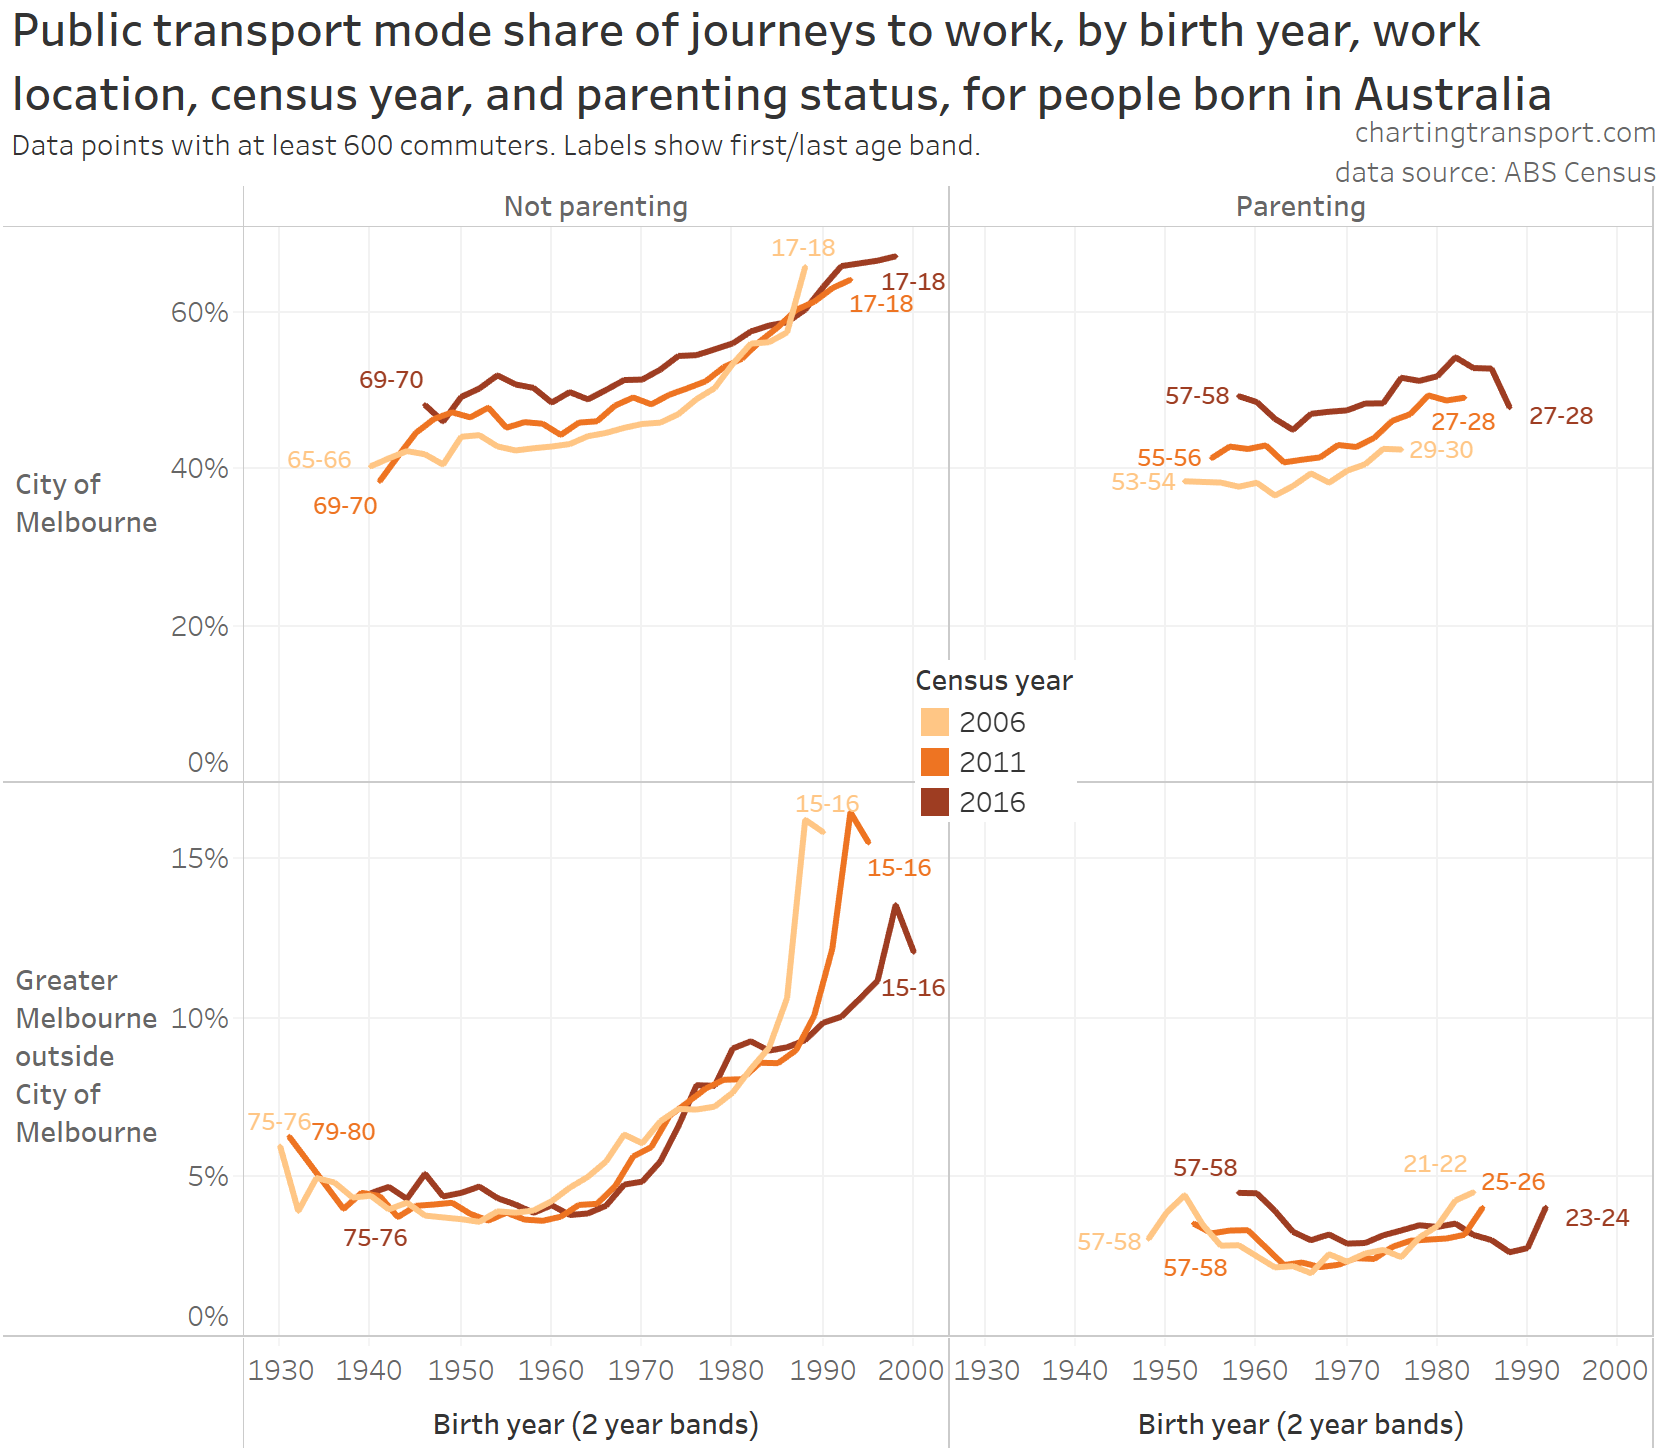
Technical notes: For this chart I’ve calculated the 2 year birth year bands so that the youngest birth band is for ages 15-16 in all census years.
Let’s walk through the quadrants:
- Non-parenting, City of Melbourne (top-left): PT mode shares have increased over time for those born between the 1940s and mid-1980s, despite these commuters getting older (assuming the same people still work within the City of Melbourne). This suggests general mode shift to PT over time has been stronger than any mode shift away from PT due to aging.
- Parenting, City of Melbourne (top-right): PT mode shares have increased over time for almost all birth years, despite getting older (although the membership of this cohort will change as people acquire and lose parenting responsibilities). This is the same as non-parenting workers in the City of Melbourne.
- Non-parenting, outside City of Melbourne (bottom-left): Ignoring those aged 15-22, mode shifts are generally smaller and not all in the same direction. If there was a negative relationships between age and PT mode share, you’d expect to see a shift away from PT between 2006 and 2016 for all cohorts. But for those born between around 1975 and 1985 (younger generation X and older millennials) and those born between 1940 and 1958 (mostly Baby Boomers) there was a small shift towards PT over time, despite them getting older. However these mode shifts were in the order of only 1-2%. Those born between 1960 and 1974 (mostly Gen X) shifted away from PT over time.
- Parenting, outside City of Melbourne (bottom-right): For people born between around 1955 and 1980 (baby boomers and gen X) there was a shift towards PT between census years 2011 and 2016, despite people ageing. However in this quadrant mode shares were pretty flat and low over most ages (except at the young and old extremes of the cohort).
Of course many people will move from the left column to the right column as they start families, and then perhaps back to left column when they have adult children who no longer need care, so this analysis isn’t perfect.
So are there generational effects on PT mode share? Between 2006 and 2016 there was a significant shift towards PT in Melbourne for most birth years, parenting statuses and work locations, with only non-parenting workers born between 1960 and 1974 and working outside the City of Melbourne shifting away from PT. So the answer is no – any impact from birth year appears to be very small, and was generally swamped by an overall mode shift towards public transport.
That analysis was for for people born in Australia, but what about immigrants?
Immigrants to Australia
Are people who immigrated into Australia more recently, more likely to use PT to get to work? The next chart provides a clear “yes” answer to that question. I’ve included parenting status and work location as known significant factors, and animated the chart over censuses 2006, 2011 and 2016.
While the lines appear to shift left, they are really shifting up or down (people’s birth year doesn’t change), and are growing on the left with new younger workers entering the labour market, and falling away on the right as people leave the workforce.
Time of immigration had a big impact on PT mode shares – with people who arrived in Australia in the five years before a census most likely to use PT to get to work. The biggest difference in PT mode shares was for recent non-parenting immigrants working outside the City of Melbourne (bottom-left quadrant). Perhaps if public transport quality was boosted in areas with many recent immigrants there might be less loss of mode share over time. Or the drop in mode share might reflect people moving to areas with lower quality public transport.
For those working outside the City of Melbourne, PT mode share quickly fell after arrival into Australia, and after around 20 years living in Australia immigrant’s mode shares are similar to those who have been in Australia longer (or were born in Australia).
The chart also shows that there are age-related factors at play (beyond parenting and work location), regardless of whether people were born in Australia or immigrated – although much less so if they are parenting.
So could it be that recent immigrants make up a greater share of young adults, and might this explain the overall average mode shares across age groups?
The next chart shows the distribution of working population in five-year age bands by year of immigration / those born in Australia. I’ve animated this over 2006 to 2016. While the chart appears to animate with vertical movements, people actually shift one column to the right between census years.
If you watch the chart you’ll see that the immigrant share of the working population under 45 years increased between 2006 and 2016, with strong surges in immigration after 2006. This will undoubtedly impact the overall mode share for younger adults, but it doesn’t explain all of the mode share variance by age. The previous chart showed age-related factors influencing PT mode shares, regardless of when people moved to Australia.
I will explore potential reasons why recent immigrants were more likely to use public transport to get to work in an upcoming post.
Can we now explain why young adults are more likely to use public transport?
So far we’ve established that the following factors appear to have a strong impact on public transport mode shares:
- Workplace distance from the CBD
- Recency of immigration to Australia
- Parenting status
- Age
If the first three of these factors are the most important, and age or other age-related factors were not important, then we would expect flat mode shares across ages when you control for the other three factors.
The following matrix-of-worms chart combines all four factors. But please note that the Y axis within each row has a different scale and doesn’t necessarily start at zero. I am really looking at the slope of the line within each matrix cell, so I’m not too concerned about the actual values. I’ve only shown data points that included at least 400 commuters, and I’ve removed some columns and rows where data was too sparse to show meaningful trends.
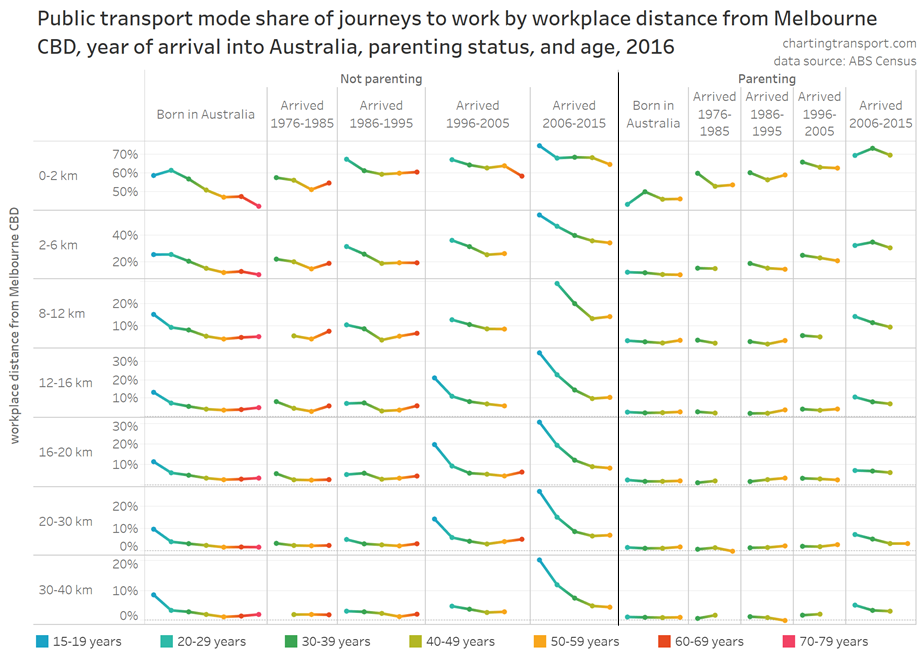
How to make sense of this chart? Well, if the factors of parenting, arrival year and work distance from the CBD explained all the differences between age groups, then you would expect these lines to be flat within each matrix cell.
On the parenting (right) side of the chart, many of the worm lines are indeed quite flat, with the exception of those who arrived between 2006 and 2015 and those who worked within 2 km of the Melbourne CBD. Even though many of these matrix cells only have two or three data points, most data points include thousands of commuters so I don’t expect much false “noise” in the chart.
Within non-parenting commuters:
- There is generally either a relationship with age, or a very low and flat PT mode share across ages, suggesting age itself, or some other age-related factors were at play.
- The relationship with age appears to be strongest for more recent immigrants. The Born in Australia column also shows a strong relationship with age but this also has the widest age range. The columns for those who arrived between 1976 and 1995 only contain 3 to 5 age bands (all 30+), which will partly explain why there is less of an evident slope in the line.
- Age band 60-69 is often an outlier to the trend, particularly for those born in Australia or who arrived between 1976 and 1985, again perhaps related to discounted “Seniors” public transport fares.
So I haven’t been able to fully explain variations in PT use by age. Age itself may be a factor, there may be other age-relevant factors that are important, or more likely there are lots of complex interactions between factors that are hard to unpick.
The next post in this series will look at the impact of income, socio-economic advantage/disadvantage, and occupation on PT mode shares across ages.

