[last updated 8 July 2020]
Consistent with reductions in vehicle and cycling traffic, central city pedestrian volumes measured by the the City of Melbourne also dropped considerably during the pandemic.
How much have volumes reduced? How has this varied by day types, locations, and times of day? Join me as I dive into the data.
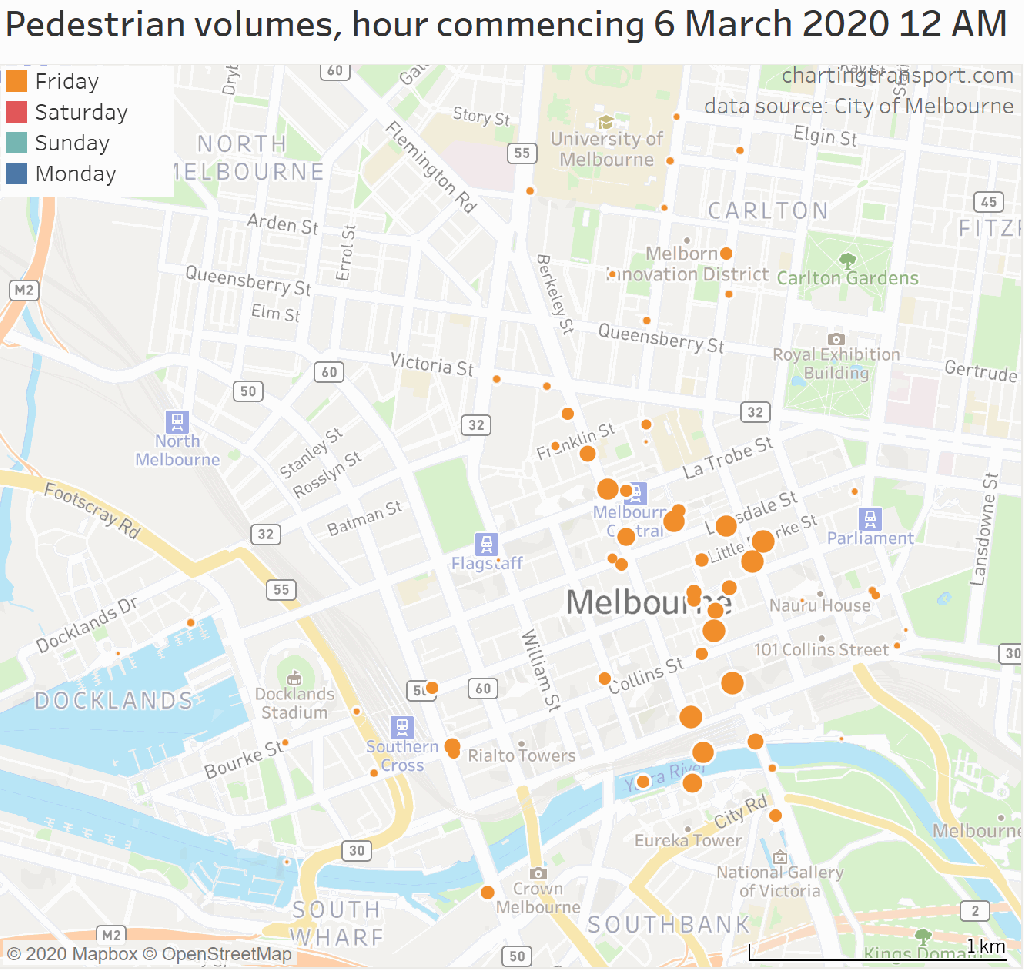
The City of Melbourne have installed 64 pedestrian counters in and around the CBD. Here’s a map of the sites and some (arbitrary) groups (which I’ll use later):
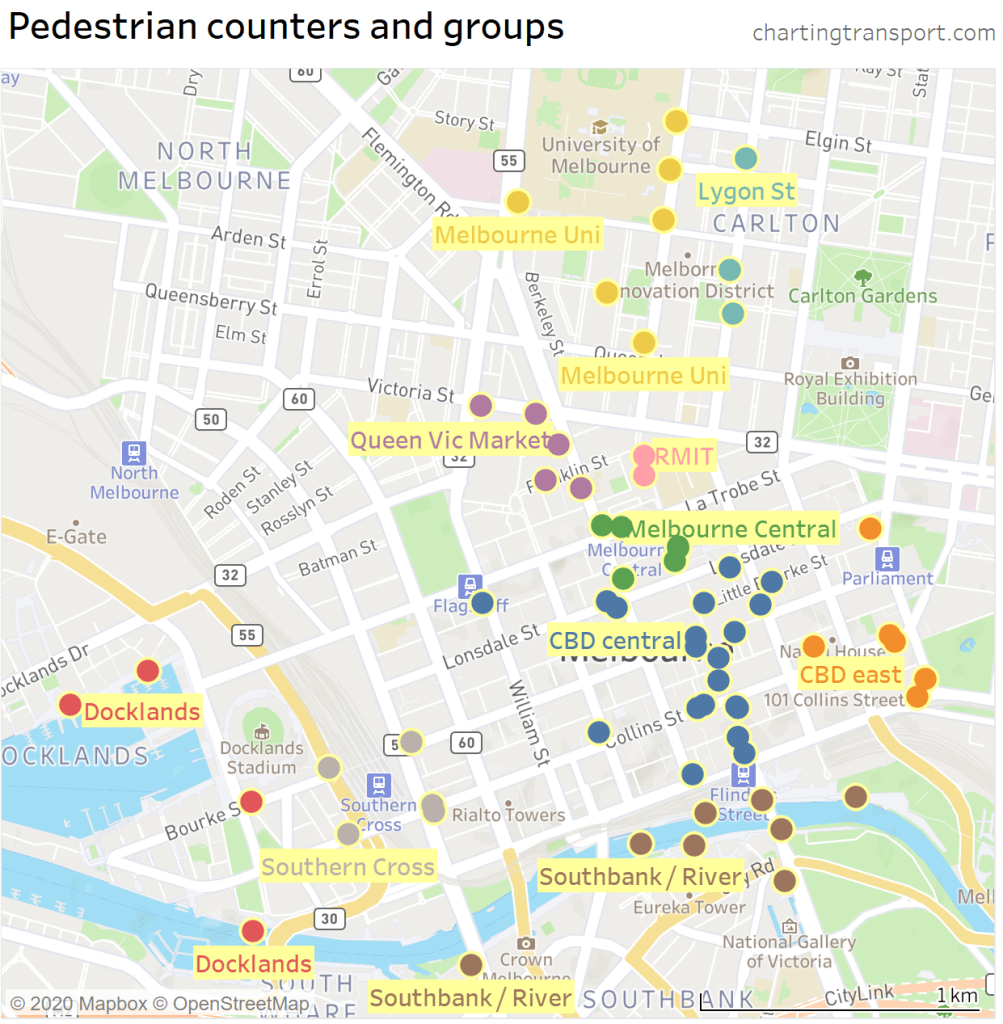
The sensors are not evenly distributed over the city, with a bias towards the central retail core, so they are unlikely to be perfectly representative of central city pedestrian activity, but the data is available and is interesting.
Of course sensors fail from time to time, so we don’t have a complete time series for all sites for all days. There have also been many more sensors added over time. Here is a chart showing the sensors reporting for each day since counting began in 2009:
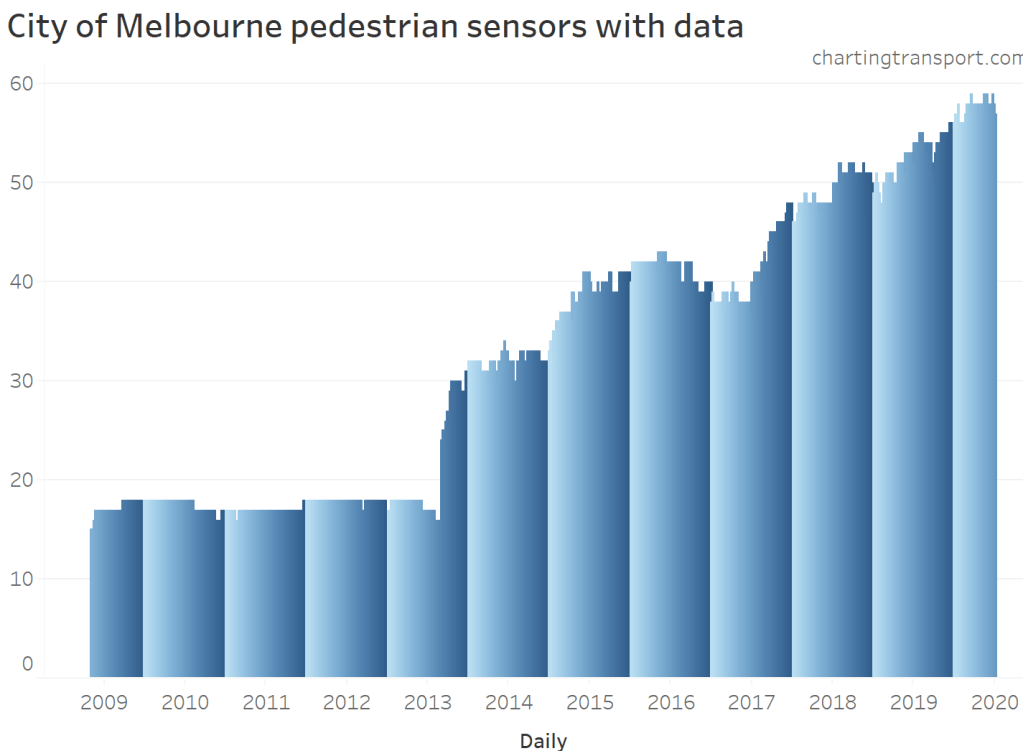
To get a reasonable comparison, the following chart aggregates data from 44 measuring sites that have complete or near-complete data for 2019 and 2020 (so far):

The gaps in the lines are due to public holidays, which have been excluded (I have not coded Easter Saturday as a public holiday).
You can see volumes drop significantly from around week 12 onward in 2020 (starts Sunday 15 March), as restrictions were introduced.
You can also see significant week to week variations in volumes in 2019, so when measuring the decline I’m going to compare volumes with those in the first two weeks of March (when universities had commenced on-campus teaching).
Here are daily volumes relative to the average of the first two weeks in March:

You can see volumes down over 80% by early April, followed by some small growth until late June when things went back into decline as the number of COVID-19 cases reports in Victoria rose.
The reductions were fairly consistent across all day types, until May when Saturday volumes grew faster. The variation between consecutive days in February reduced dramatically, suggesting perhaps there was a lot less discretionary pedestrian activity during the lock down.
During the first recovery phase there have been a few outliers:
- Thursday 9 April was the day before Good Friday when most retail trading is restricted.
- Wednesday 29 April was a very wet day (23.6 mm of rain)
- Saturday 16 May was the first Saturday after restrictions were eased (also a fine sunny day of maximum 18 degrees).
- Monday 1 June was cold and wet.
While the Sunday decline appears to be the largest, Sunday 8 March was during the Moomba festival on a long weekend, so there were many more people in the city than normal that night, inflating the baseline.
Likewise the first two Saturdays in March had quite different volumes, which may be related to special events as well. So I would suggest not getting carried away with the exact decline percentages.
How have volumes changed in different parts of the city?
Of course the pedestrian volume reductions have not been uniform by place or day of the week. Here are the reductions on weekdays for week 14 (29 March – 4 April), when overall volumes bottomed:
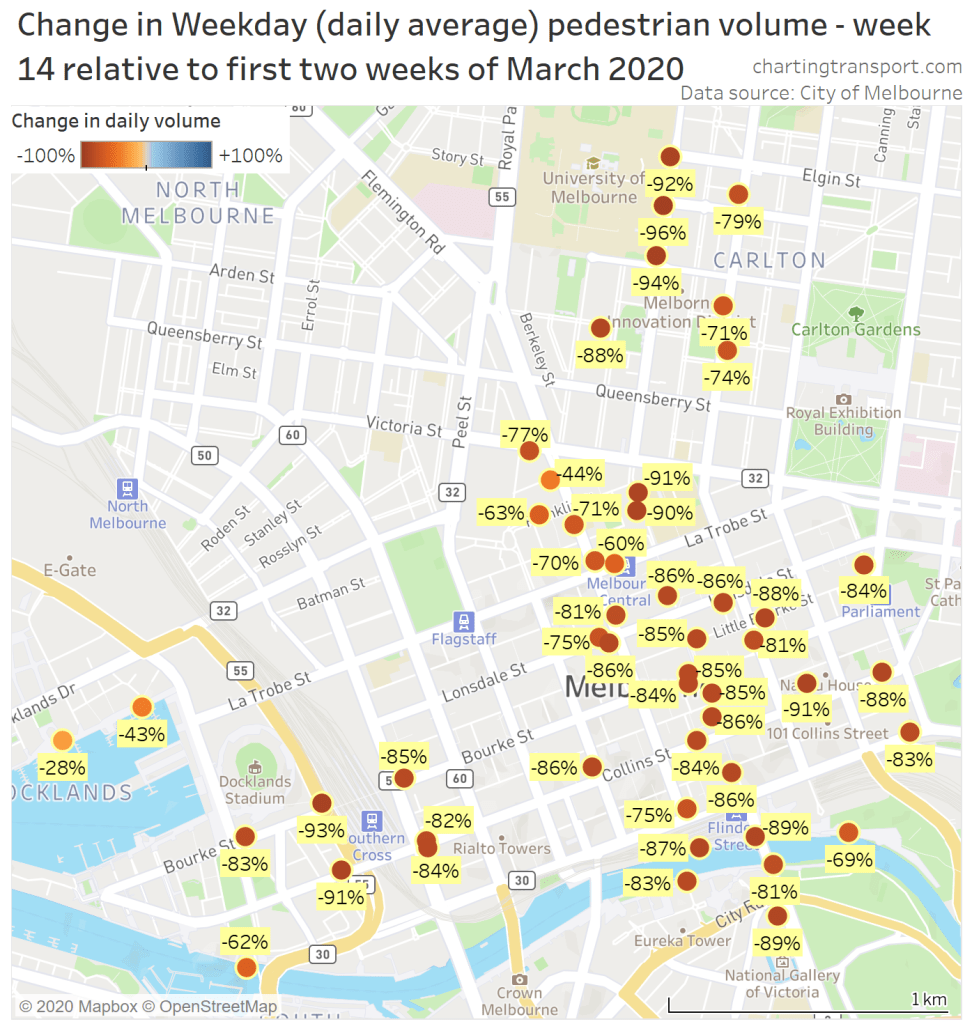
Volumes were down the most around Melbourne University, and reductions of around 85% were typical in the CBD grid. There were smaller reductions in Docklands (which might reflect many pedestrians being residents), and around Queen Victoria Market (one site only down 44%).
Here’s the same again for Saturday 4 April:

The largest reductions around the arts precinct in Southbank, the retail core of the CBD, and around Melbourne University. Lesser declines are again in Docklands and around Queen Victoria Market.
And here is Sunday 5 April:

Patterns are similar again.
What are the trends in different parts of the city?
The next chart looks at the volumes trends for my sensor groups over time for weekdays:
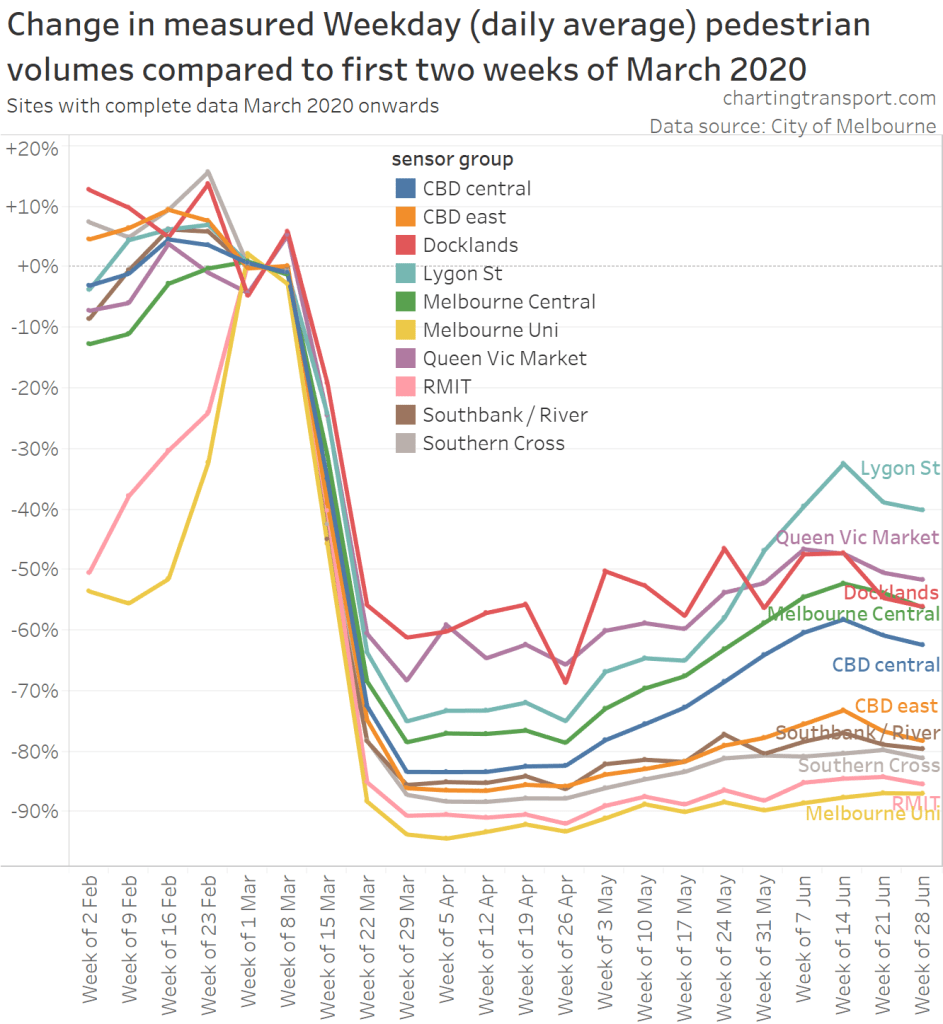
The relative decline was initially fairly consistent across the groups over the weeks, with the university sites showing the biggest declines, and the residential and retail sites showing the least decline. The retail precincts of Lygon Street, CBD central, and Melbourne Central (around the station) have shown the most growth since May, as cafe restrictions were listed.
The story is quite different on Saturdays:
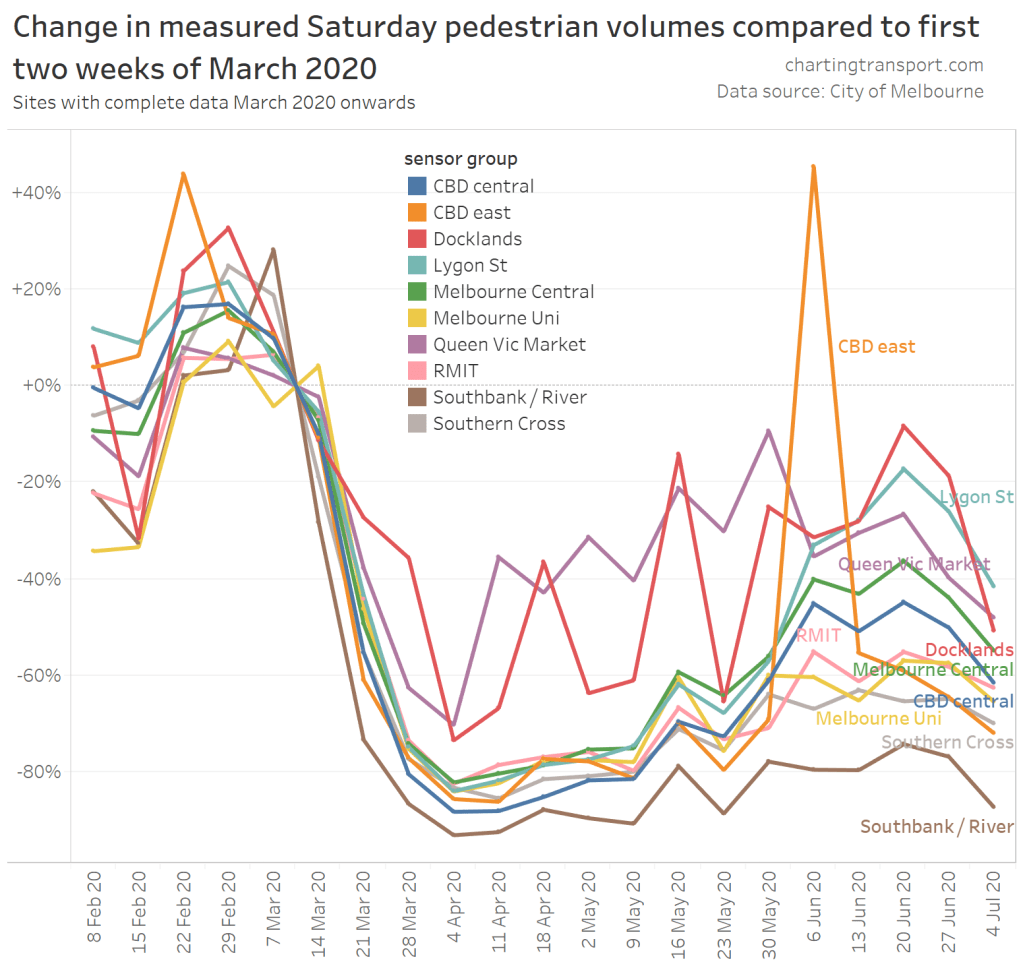
There is historically a lot more week to week variation, and the numbers for Docklands have bounced around a fair bit – with 16 May close to normal levels of pedestrian activity (a dry day with maximum 18 degrees, lower days had rain). Saturday 23 May was a fairly wet day, so might have discouraged travel.
Queen Victoria Market has also shown considerable growth since early April – with volumes within the bounds of regular volumes.
The spike for CBD east on 7 June was due to the Black Lives Matter protest.
Saturday pedestrian volumes have declined from late June as concern rose about a second wave.
Sundays are similar:
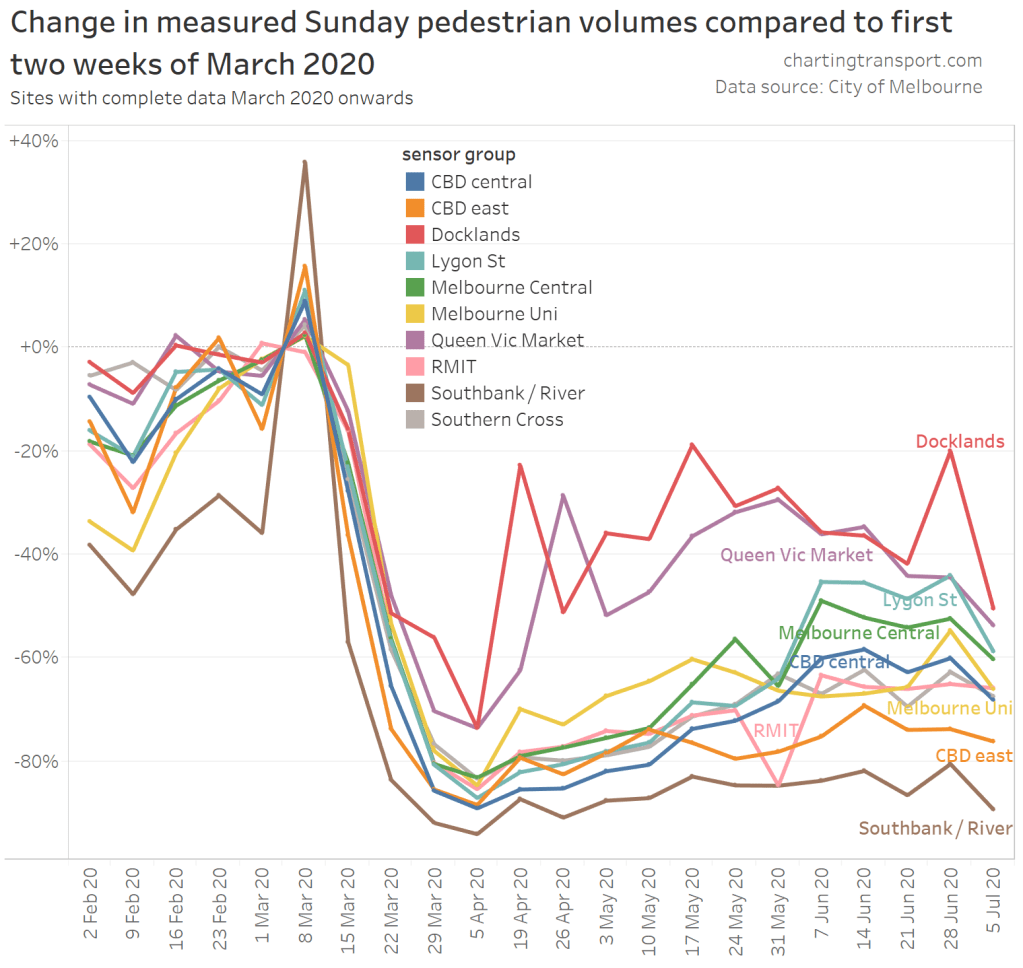
Docklands, Queen Victoria Market and Melbourne Central all increased on Sundays during May (all with little or no rain).
The fact that the Southbank / River group has shown the largest decline is probably related to it having a high base – with the Moomba festival causing a spike in pedestrian volumes on 8 March.
How have volumes changed by time of day?
Here’s the profile of hourly volumes for sites with complete data for 2020 on weekdays:
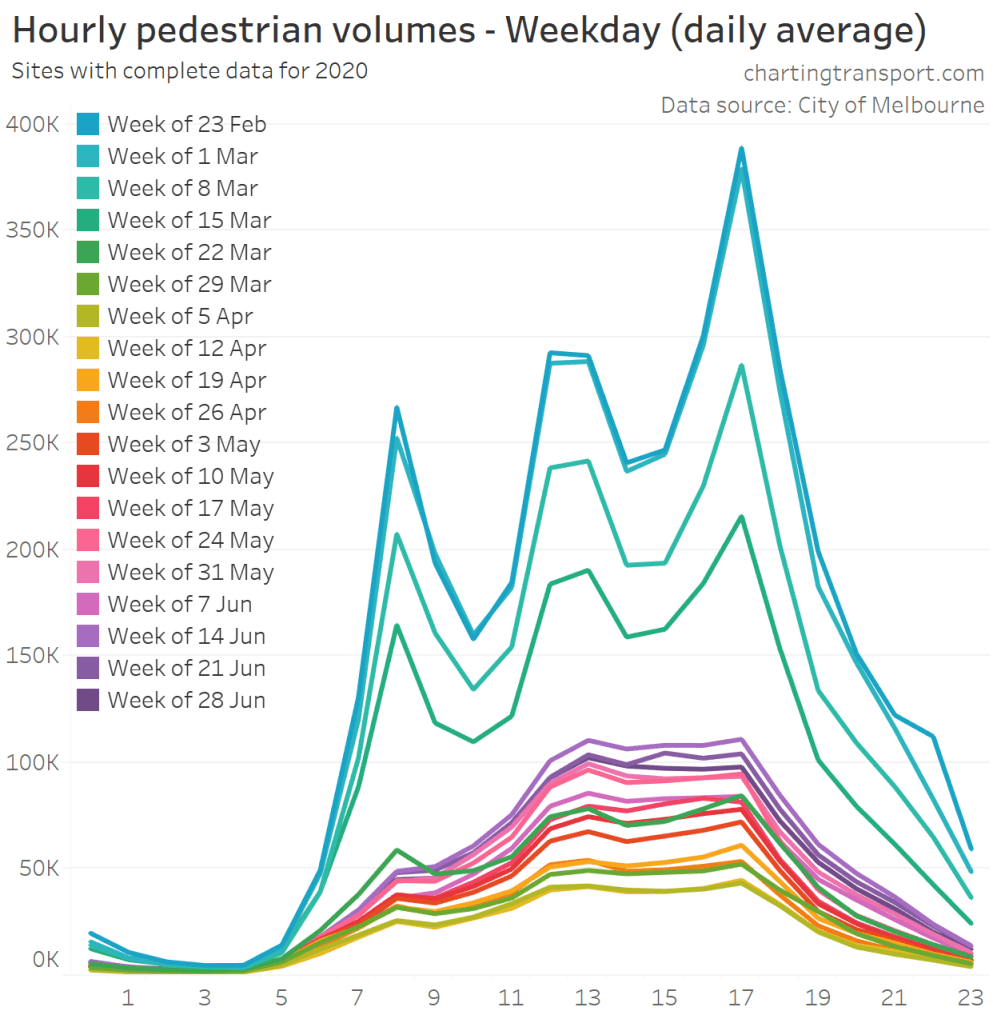
You can see the normal AM peak, lunchtime peak, and PM peak, which have been largely flattened since the pandemic hit. Weekdays are now busiest in the afternoons – which is a profile much more like a normal weekend day (more on that in a moment).
If you follow the colours carefully you can see the rapid decline in late March, followed by slow growth, peaking in the week of 14 June, then declining again.
Here are hourly volumes relative to the first two weeks of March:
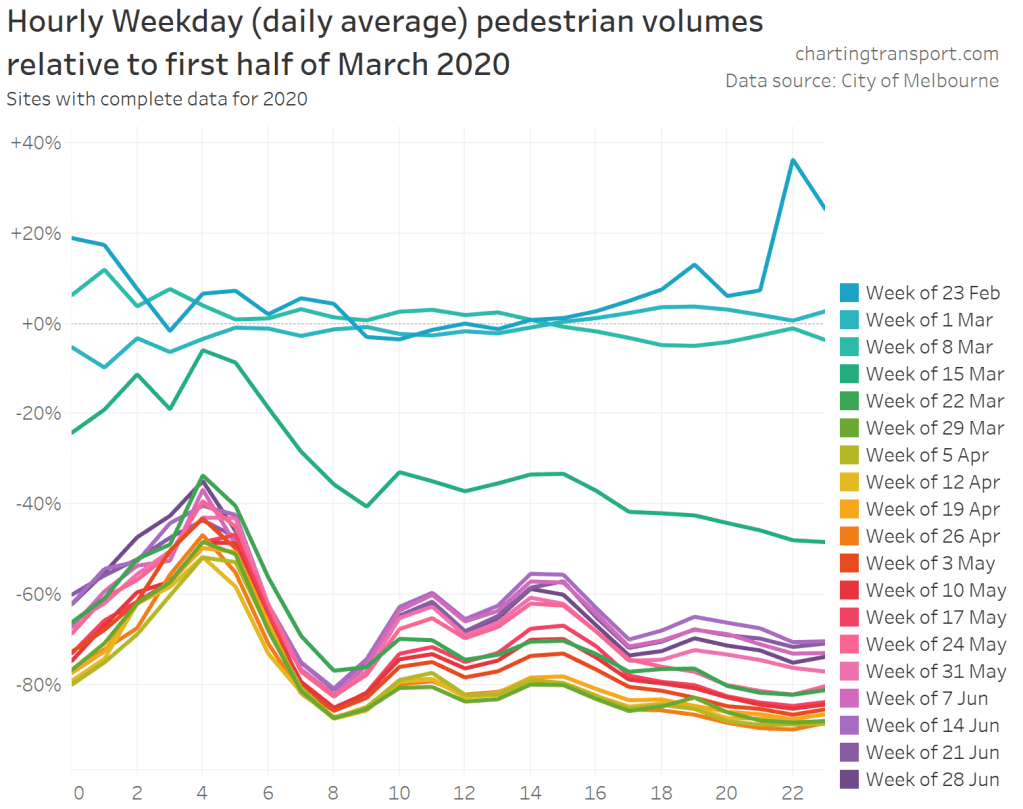
The biggest reductions have been in the AM peak and evenings, which reflects a reduction in commuters and hospitality activity. The reductions are slightly smaller mid-morning and mid-afternoon (between the regular peaks) reflecting a flattening of the profile.
The smallest percentage reductions have been at 4-5am in the morning, off a small base.
Here is Saturdays:
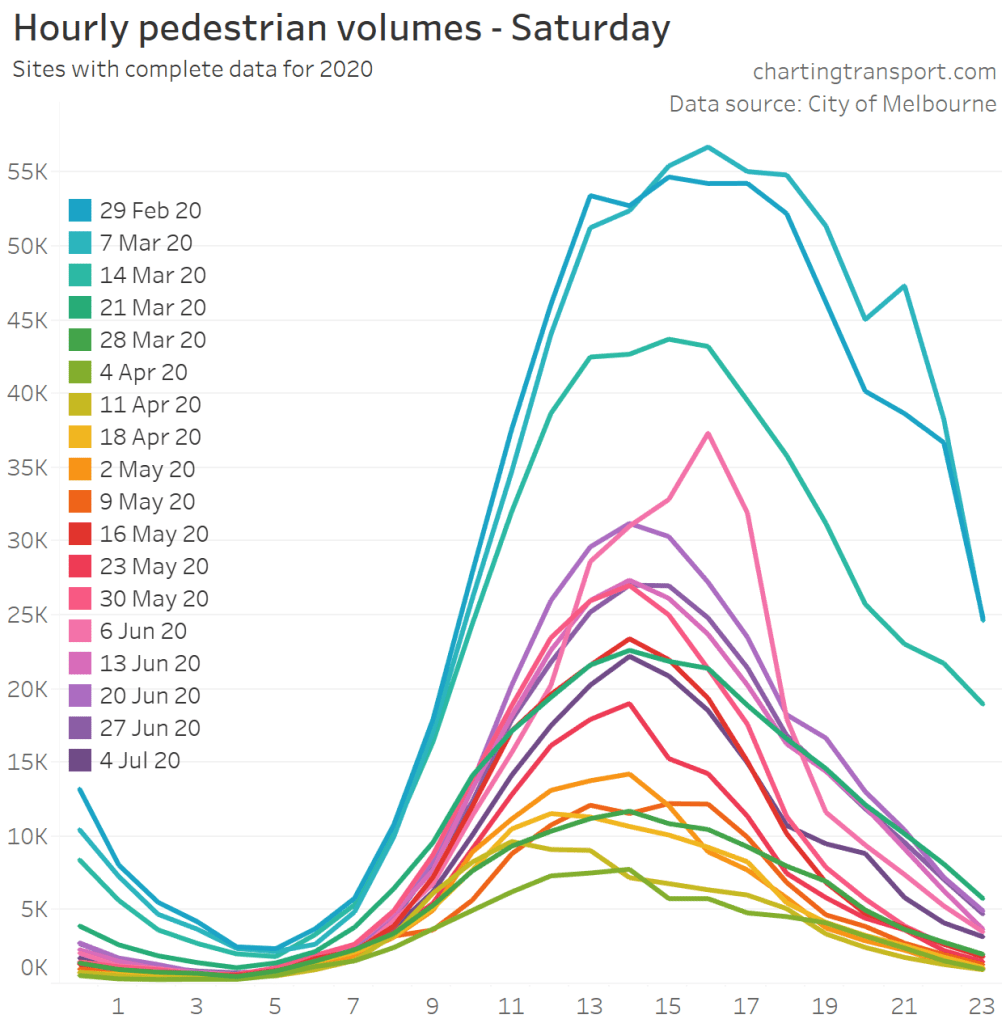
Reductions have again been largest in the evenings, just after midnight (Friday night), and least around dawn. You can see Saturday afternoons showing growth until mid June, but little growth in the evenings as restaurants, bars, and theatres remained closed.
Same again for Sundays:
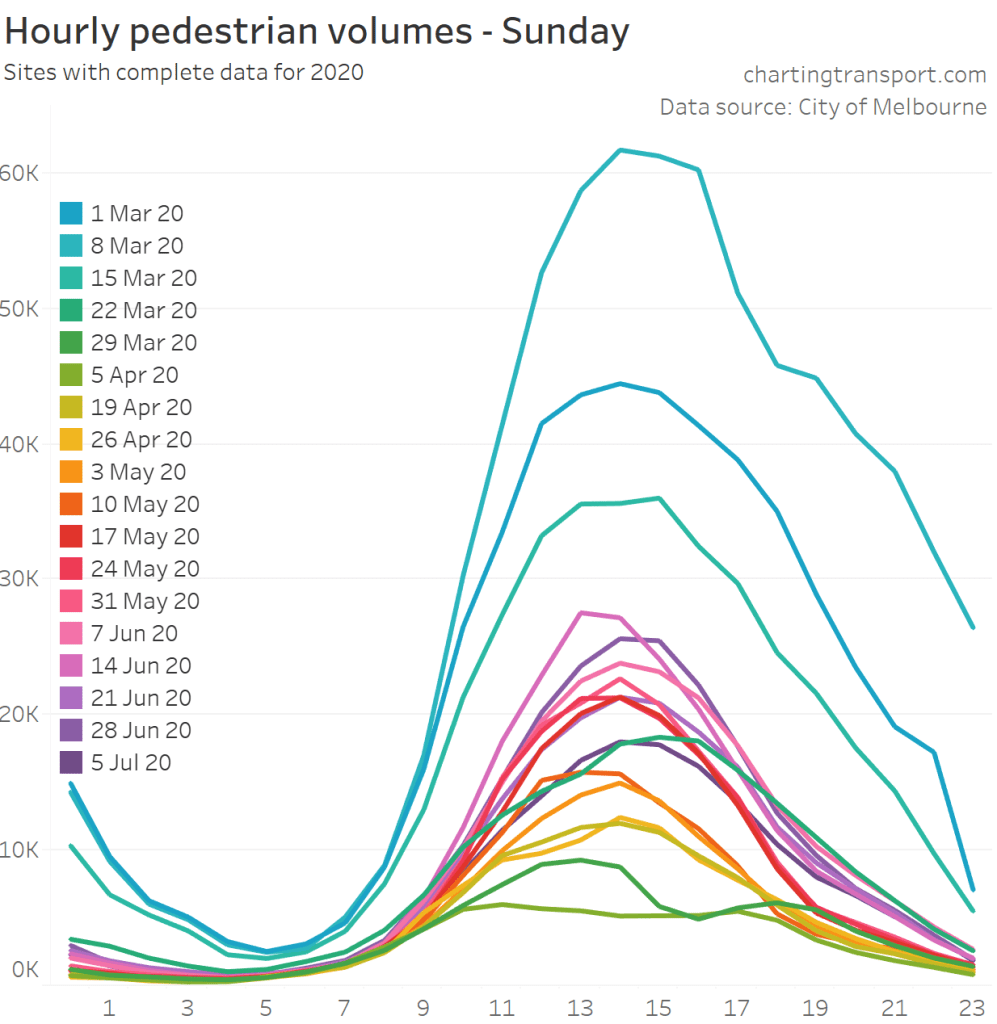
Sunday 8 March is an outlier in the day and evening – with the Moomba festival on, and the following Monday being a public holiday.
Another way to visualise hourly data
Here’s a chart that shows pedestrian volumes for every hour of 2020 up to and including 7 July 2020. The rows are days, and the columns are hours of the day:

You can see how pedestrian activity very quickly became quiet in March. Before the shutdown you can also see the weekly patterns, with weekend activity starting later and finishing later.
The top row is New Years Day, and you can see high volumes in the first few hours from new year celebrations.
May 16th was the first Saturday after restrictions were eased and that shows up as the first spike in the recovery phase.
This can be filtered for locations. For example, here is the data for Queen Victoria Market sensors:

You can see clear stripes for days the market was open (including night markets). The first busy day after the shut down was the Thursday before Good Friday – perhaps people cramming shopping ahead of Good Friday (Easter Saturday was also busy). The market continued to trade throughout this time. Things started to quieten down in late June / early July.
I will try to periodically update this post during the recovery.
An aside: visualising activity over a long weekend
Nothing to do with the pandemic, but a bit of fun to finish. Here is an animation of pedestrian volumes over the Labour Day long weekend 6-9 March 2020 (Friday to Monday):
If you watch carefully you’ll spot some sudden surges from a Saturday evening event at Docklands Stadium.


 Posted by chrisloader
