Note: Since publishing this post, it has come to my attention that Perth’s Fremantle train line was closed on census day in 2021, which may have impacted mode shares in Perth.
ABS census data tells us that Perth’s CBD experienced a massive 19% jump in the number of private transport commuter trips between 2016 and 2021. That’s over 5000 more journeys – mostly as car drivers – and is quite likely to have made traffic congestion worse.
So how did that happen? Where were these extra commuters travelling to? Were there particular changes in the modal mix in different parts of the CBD? Was this growth enabled by a big increase in car parking capacity? And what has been happening to car park pricing?
This post digs a little deeper following my last post that explored the impact of COVID on journey to mode shares in Australian cities in 2021.
A quick recap of overall changes in journey to work in the Perth CBD
Here’s the volume of Perth CBD commuters by main mode, including working at home in 2011, 2016, and 2021:
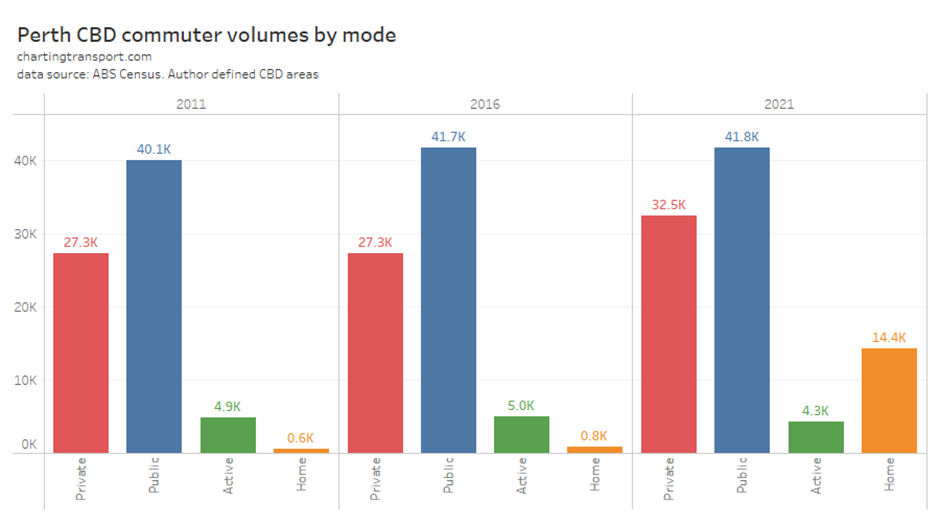
See my last post for my definition of the Perth CBD. A trip involving any public transport is classed as public, a trip that involves only walking or cycling is classed as active, and any other form of travel is classed as private.
At the 2021 census, Perth was COVID-free with relatively few restrictions on intra-state movement or activity.
Total employment in the CBD grew by a massive 26% from 82,214 in 2016 to 103,944 in 2021. Private transport trips increased by 19%, but because this was less growth than overall employment growth there was actually a commuter mode shift away from private transport of 1.6% (from 36.5% to 34.9%).
The biggest increase in CBD worker volumes was in those who worked at home.
Public transport commuting to the CBD increased by only 85 trips between 2016 and 2021, but still accounted for more trips than private transport.
LATE EDIT: It’s just come to my attention that the Fremantle train line was closed on the day of the 2021 census (10 August), which will have suppressed public transport mode share in the western suburbs.
My last post concluded there was likely a significant mode shift from public transport to remote working. There was some mode shift away from public transport and towards remote working and private transport for some middle age groups, although some of this shift is likely to be a normal trend seen as people age (and become parents). I was unable to identify occupations that saw a substantial mode shift from public transport to private transport, although some occupations saw a lot more private transport growth than public transport growth.
This post now takes that analysis a bit further by looking at spatial variations in the modal mix by workplace location.
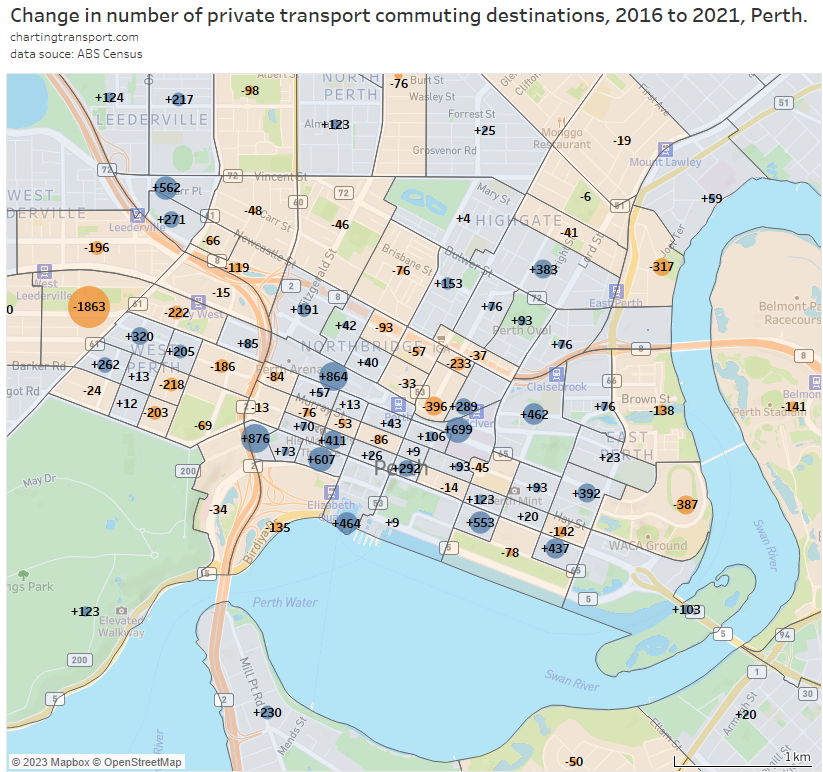
Where were the extra private transport commuters working?
Here’s the change in private commuter trips for each destination zone around the Perth CBD:
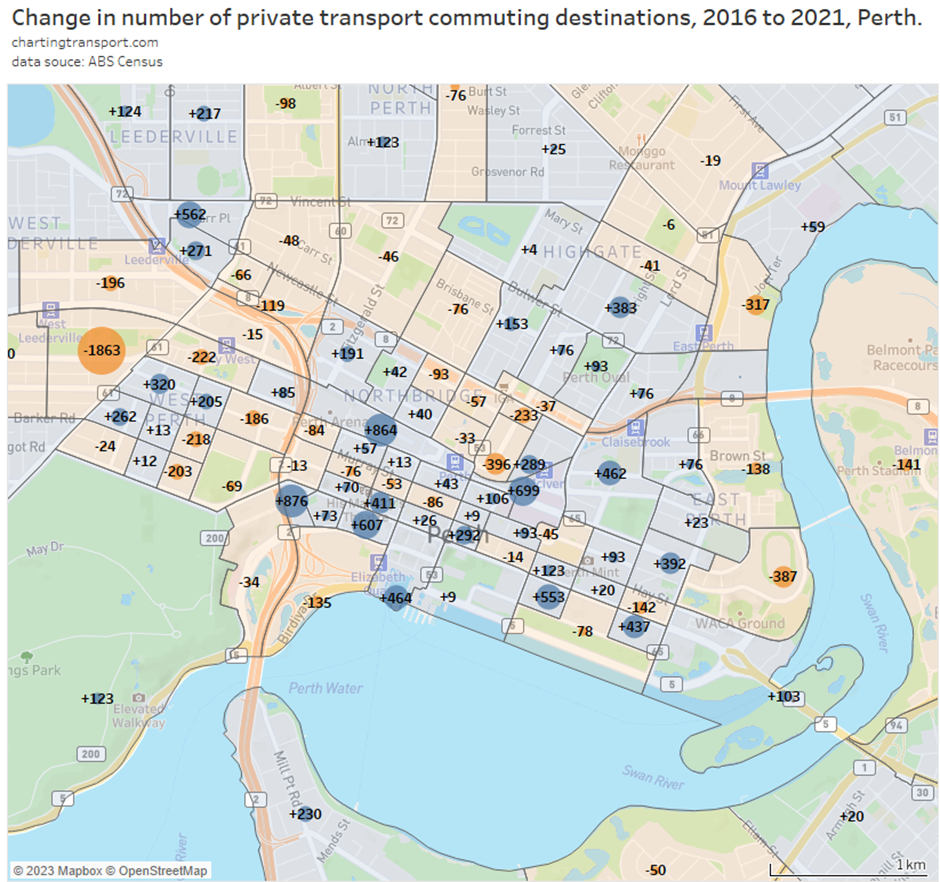
Note: the circles aren’t always drawn in the middle of each destination zone, aren’t intended to highlight any particular location within each zone, and may not be representative of major car park locations.
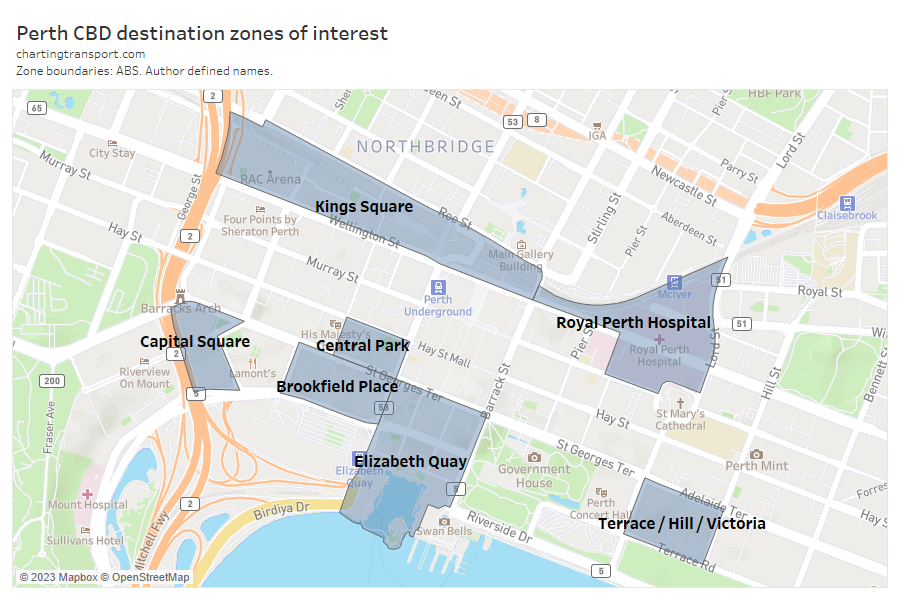
There were both increases and decreases around the CBD. I’m going to focus in more detail on the following high-growth destination zones that I’ve arbitrarily named by a dominant building, precinct, or bordering streets:

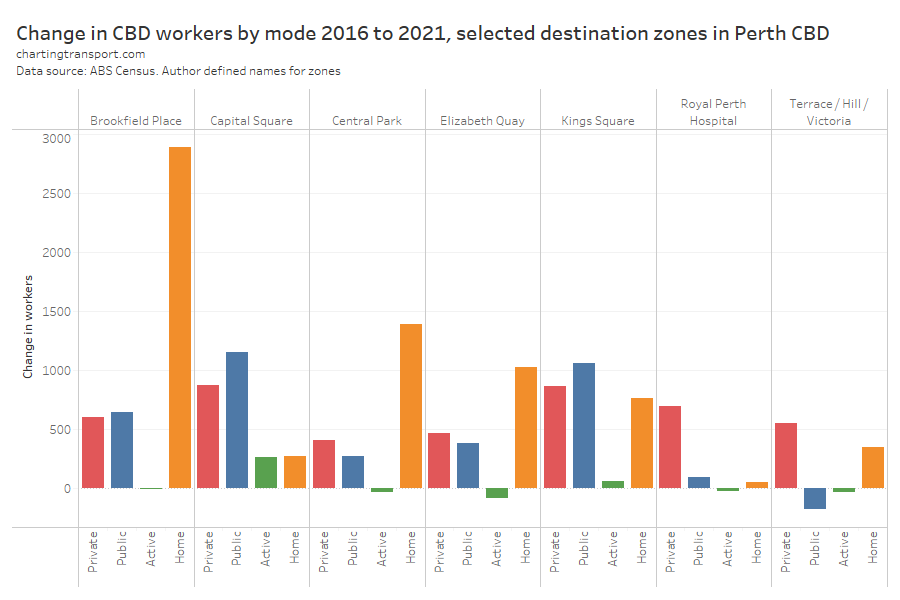
Most of the zones that saw a big increase in private transport commuter trips also saw a big increase in public transport trips.
Capital Square saw jobs more than triple between 2016 and 2021 as a major new development was completed (including the new Woodside headquarters). It had the largest increase in private transport trips, but even more new trips were by public transport. The development includes five levels of car parking on a fairly large site (at least 659 car parks according to some planning documents). It also saw the largest growth in active transport commuter trips of any destination zone in the Perth CBD.
The zone I have labelled Kings Square (which includes Perth Arena and the new Shell and HBF buildings) saw only slightly more new public transport trips than new private transport trips, despite Perth train station being inside the zone.
The Royal Perth Hospital zone had almost all of its net job growth accounted for by private transport, some of which would have been shift workers. This is consistent with my last post that found a large increase in private transport commuters under the “carers and aids” and “health and welfare support” occupation groups. The hospital is directly adjacent to McIver train station, served by multiple train lines.
One mixed-use block between Terrace Road, Victoria Avenue, Adelaide Terrace, and Hill Street had an increase in private trips and a decrease in public trips. It’s difficult to speculate why this occurred due to the diverse mix of land uses.
The Elizabeth Quay zone saw more growth in private trips than public trips, despite being immediately adjacent to Elizabeth Quay train station. I’ve not been able to identify any large new car parks in the area. Car parks immediately north of the development site were offering $25 all-day car parking at the time of writing which I suspect the average employee might not consider particularly affordable.
The Brookfield Place and Central Park zones mostly saw a big increase in the number of remote workers.
Outside the CBD, the biggest decline in private trips was -1863 in a zone near West Leederville station where the Princess Margaret Hospital for Children closed in 2018 (replaced by the Perth Children’s Hospital in Nedlands).
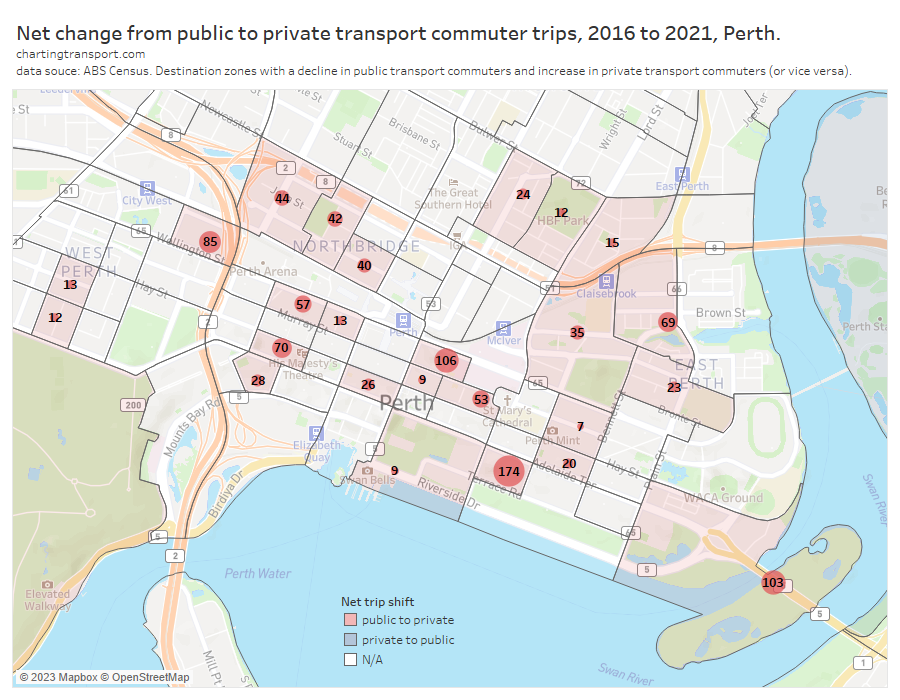
Where was there a shift from public to private transport?
The following map shows destination zones where there was a decline in public transport trips and an increase in private transport trips (no zones showed the opposite flow):

Just under than half of the destination zones around the Perth CBD saw some sort of net shift to private transport, and most of these were very small numbers. In total these zones account for 492 trips within for my definition of the Perth CBD, about 0.5% of all workers. A net shift from public transport explains less than 10% of the total increase in private transport commuter trips.
This is consistent with analysis in my last post (which disaggregated by birth cohorts and occupations) and again suggests the growth in private trips was broadly in line with the overall growth in CBD employment. It also fits with the hypothesis that the biggest mode shift was from public transport to remote working.
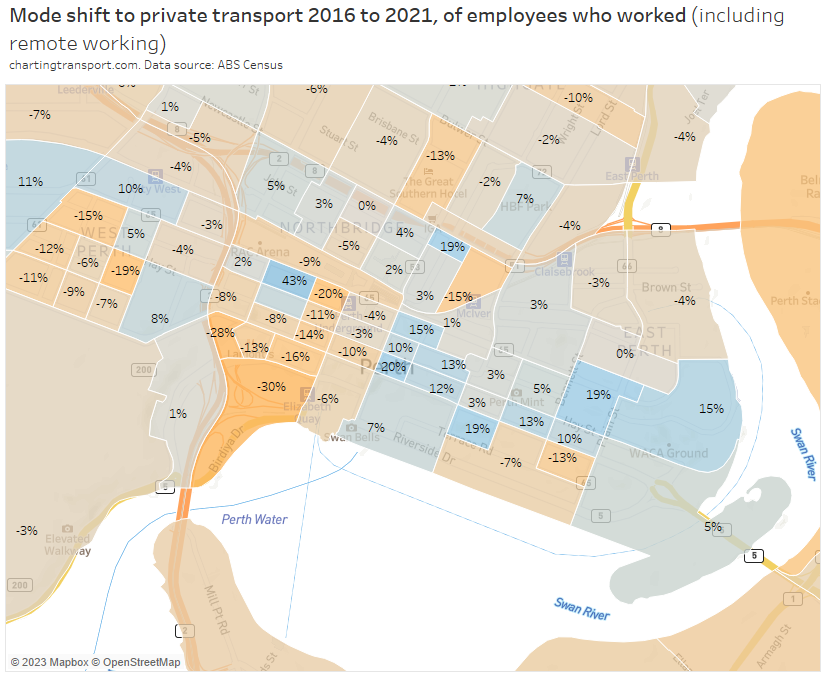
Another way of analysing mode shift is to look the percentage change in private transport mode share by zone:

In the western part of the main CBD area there were many zones with a large mode shift away from private transport, and many of these zones had high employment density.
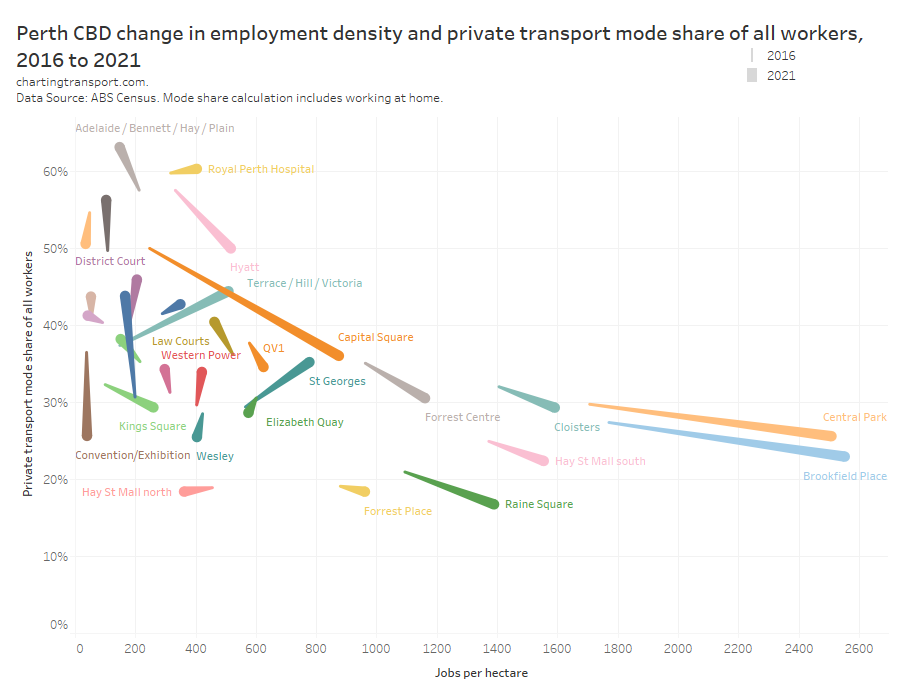
In fact, the next chart shows how employment density and private transport mode share changed between 2016 and 2021 in the Perth CBD, with the thin end of each ‘comet’ being 2016 and the thick end being 2021 (I’ve arbitrarily named several more destination zones based on major landmarks or surrounding streets).

Note: some destination zones include significant land that is not built up (eg parkland, water bodies, and/or freeway interchanges) and these will have understated employment density. This incudes Convention/Exhibition and Elizabeth Quay.
The dominant pattern is that the zones with high and increasing employment density mostly saw declining private transport mode share, although the “Terrace / Hill / Victoria” block was a standout exception having increasing employment density and increasing private mode share.
How did the CBD absorb so many more car commuters?
It’s hard to know for sure but some possible explanations include:
- New car parking supply: I’ve already mentioned the Capital Square development that included five levels of parking. Locals might know of other new large CBD car parks, but I’ve struggled to identify any large car parks on Parkopedia or Google Maps that didn’t already exist in 2016. Many new office buildings don’t appear to include large car parks.
- Perth was in a “mining downturn” in 2016: The Perth CBD only added 1.7k jobs between 2011 and 2016, and there was no significant increase in private commuter trips. According to a Property Council report in August 2016, Perth was experiencing very high office vacancy rates (21.8%) and had been experiencing a decline in office space demand that started around 2013. So it seems quite plausible that car parking supply grew between 2011 and 2016, but commuter parking demand only grew strongly after 2016.
- Reduced short-term parking demand? Perhaps there has been a decline in demand for short-term parking (through the normalisation of online business meetings) enabling more all-day parking. But I’m just speculating.
Someone reading this from the parking industry might be able to share some insights (please add comments).
What’s been happening to Perth CBD car parking prices?
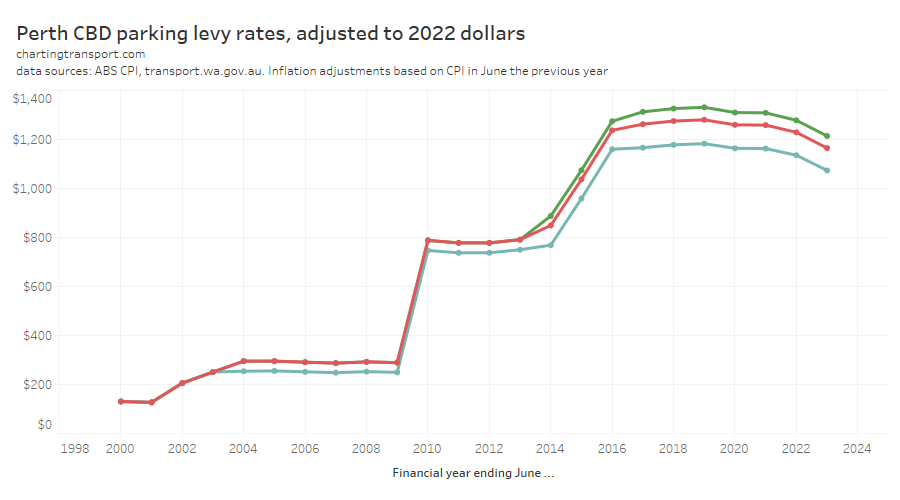
Like Sydney and Melbourne, Perth has a CBD parking levy – an annual fee collected by government per space. Here’s what’s been happening to the levy prices in real terms:

The parking levy increased substantially in real terms in 2010 and again between 2014-2016, but in recent years has not been keeping up with inflation. Between 2016 and 2021 there was almost no real change in the levy.
So what’s been happening to car park prices?
The City of Perth itself operates a large number of CBD car parks and in 2021/22 parking revenue accounted for 36% of its total income (source: budget 2022-23).
Thanks to the incredible resource that is the Wayback Machine, I’ve been able to dig out prices at their CBD car parks right back to 2001-02. For the sake of manageable analysis I’ve focussed on four relatively large central CBD car parks – Concert Hall (399 spaces), Convention Centre (1428 spaces), Elder Street (1052 spaces) and Pier Street (680 spaces). Here’s how those prices have changed over time, in nominal and real terms:
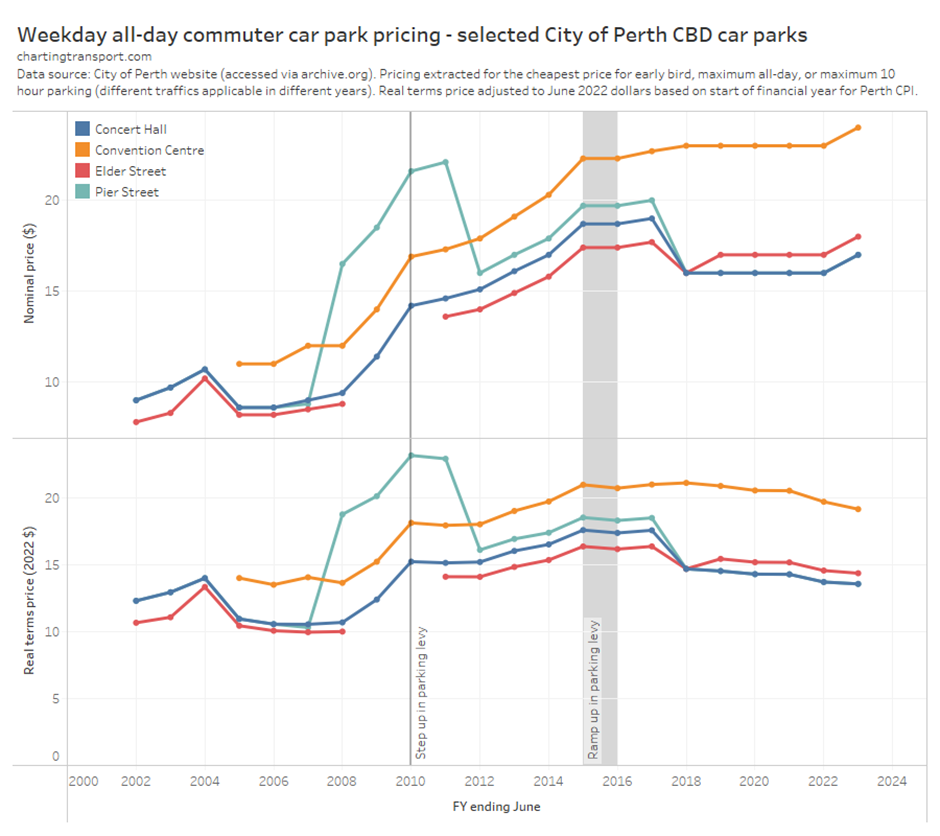
The 2010 and 2015 jumps in the pricing levy were clearly reflected in retail parking prices.
In real terms, parking prices peaked around 2015-2017 and have been in decline since then. Prices for several car parks were cut substantially in 2017/18 – perhaps as a belated response to a reduction in office commuter demand during the mining downturn. Then parking prices were frozen from 2019 to 2022 – presumably due to the pandemic.
So despite the massive increase in CBD parking demand, the City of Perth reduced – rather than increased – all-day parking prices, and so has probably also missed out on significant additional revenue. This has arguably helped facilitate the big increase in commuter traffic volumes, along with the likely associated urban amenity impacts of more traffic in the CBD.
The City of Perth is a democratic local government so it’s probably not going to behave in an entirely economically rational way when it comes to price setting. Prices are also locked in for each financial year so are much less dynamic. So what have commercial parking operators been doing?
Unfortunately I’ve not been able to use the Internet Archive to find historical commercial car parking prices in the Perth CBD back to 2016. What I can tell you is that “flexi” online parking at the Wilson Parking run Central Park car park has risen from $19 in October 2021 to $26 in May 2023 – suggesting commercial operators are not afraid to change their pricing. That said, the Kings Complex car park (517 Hay Street, near Pier Street) has had no increase in its online daily rate between October 2021 and May 2023 ($18).
So what is Perth’s parking policy?
The current Perth parking policy (2014) states:
“This policy recognises that vehicular access to, from and within central Perth is a critical element in ensuring its continued economic and social viability. It also continues to recognise the need to preserve and enhance the city’s environment. The policy aims to address these needs by supporting the provision of a balanced transport network in order to manage congestion and provide for the efficient operation of the transport network to, from and within the city centre.”
I suspect the term “balanced transport” is indicative of not trying to shift travel towards more sustainable, non-car modes. And I guess it would also be hard for the City of Perth to start discouraging something that generates more than one third of its annual revenue. Although an increase in prices might increase revenue, even if it reduces demand.
Furthermore, the Western Australian government is also continuing to widen Perth’s freeways, in the hope this might reduce traffic congestion. I’m not sure many cities have succeeded with such strategies, but good luck Perth!
Finally…
Wasn’t Perth public transport patronage below pre-pandemic levels in 2021?
I noted above that there were just 85 additional public transport commuters to Perth’s CBD in 2021 compared to 2016. But Perth’s overall public transport patronage in August 2021 was around 22%* below that in August 2016. If the number of CBD public transport commuters didn’t decline, the overall patronage decline must represent a mode shift away from public transport for trips to other destinations and/or for purposes other than travelling to work (and/or a decline in the number of such trips made by any mode).
*August 2016 had one more school weekday and one fewer Sunday than August 2021 which means we cannot directly compare total monthly patronage of the two months but they will be fairly close. It would be much cleaner to compare average school weekday patronage figures between months and years, but unfortunately few agencies publish such numbers (Victoria does now).


On street parking was free for a period, I will have to check when it changed. See below
https://perth.wa.gov.au/en/news-and-updates/all-news/parking-costs-reduced-to-help-city-workers-during-covid-19-pandemic
LikeLike