Public transport patronage trends in Australasian cities

Sat 13 November, 2010

[updated 12 January 2015]

With some effort and assistance from others, I’ve managed to compile public transport patronage data for major cities in Australia and New Zealand. What follows are trends on what I do have, including figures for 2013-14 for most cities.

A large number of caveats are required around the data (particularly Sydney). I have used South East Queensland (the TransLink service area) and what I am calling Sydney and surrounds (the catchment for CityRail including Sydney, Newcastle/Hunter, and Wollongong/Illawarra). See below for full details.

Overall Patronage growth

All PT growth 6

This chart shows growth in patronage since 2001-02 (an arbitrary start year).

Observations:

  • Several cities have shown very strong growth:
    • In Perth part of this can be attributed to the opening of the Mandurah rail line in late 2007.
    • Melbourne saw strong patronage growth between 2004 and 2011, with a particularly big jump in 2008-09.
    • South East Queensland invested in bus services between 2003 and 2009, including radial busways to the Brisbane CBD. However patronage peaked in 2009-10, and has been flat or declining since. This may be impacted by the floods and associated free travel periods (not counted as patronage), and recent above-CPI fare price rises. Also train patronage under the old paper ticketing system may have been overestimated – creating an inconsistency in the time series as people transition to Go Card.
    • Auckland and Christchurch had very strong growth to a peak in 2002-03 (attributed by some to a boom in international students), a lull and then strong growth again from 2007. Christchurch patronage fell dramatically in 2010-11 following a major earthquake that closed large parts of the CBD (where PT probably had a high mode share) and led to population decline.
  • The other cities are languishing significantly behind:
    • Sydney’s problems with public transport are often discussed, and I understand there has been relatively little expansion in services in recent years. Some modest growth is evident from 2010 onwards. It is very difficult to obtain Sydney bus patronage data, and I do not have a 2013-14 data point.
    • Adelaide has not been investing significantly in bus or train services in recent years (although that is now changing). Patronage peaked in 2009-10. The completion of recent rail upgrades may see rises in the coming years.
    • Canberra has seen both funding cuts and increases over the years.
    • Hobart is included for completeness. I cannot comment on reasons for patronage trends there. Their annual report does.
    • Wellington has also had only modest patronage growth, although it maintains the strongest rate of public transport use in New Zealand.

Note:

  • Greater Sydney data is very difficult to obtain – mostly because private bus, ferry and light rail data is not published in any consistent form. In the above I have used a dataset prepared by BITRE and data published by the NSW Bureau of Transport Statistics.

Train patronage

train pax growth 4

  • Auckland train patronage growth is off the chart. 2013-14 patronage was around 508% higher than 2001-02 patronage, following 10 consecutive years of annual growth above 10% (there was actually a decline in patronage in 2012-13 of 8.3% but growth rebounded in 2013-14 to 14.4%). Auckland has been heavily investing in services, a new city terminal, and electrification. Patronage growth is off a very small base, such that percentage growth rates are very large.
  • You can see the significant surge in Perth train patronage following the opening of the Mandurah line in late 2007. Patronage has more than doubled in 10 years, although curiously declined in 2013-14.
  • Melbourne saw a steady increase in train patronage between 2005 and 2011, an easing in 2011-12, but further growth since then.
  • South East Queensland train patronage figures dropped after 2009. TransLink make a comment about a change of ticketing system impacting these figures in their tracker report (previous estimates probably being inflated), so it is unclear what the “real” trend is.
  • Adelaide train patronage dropped until 2012 as lines closed for extended periods to enable electrification works. Lines have reopened and electric services are running, with a bounce in patronage evident from 2012.

Bus patronage

Bus growth 3

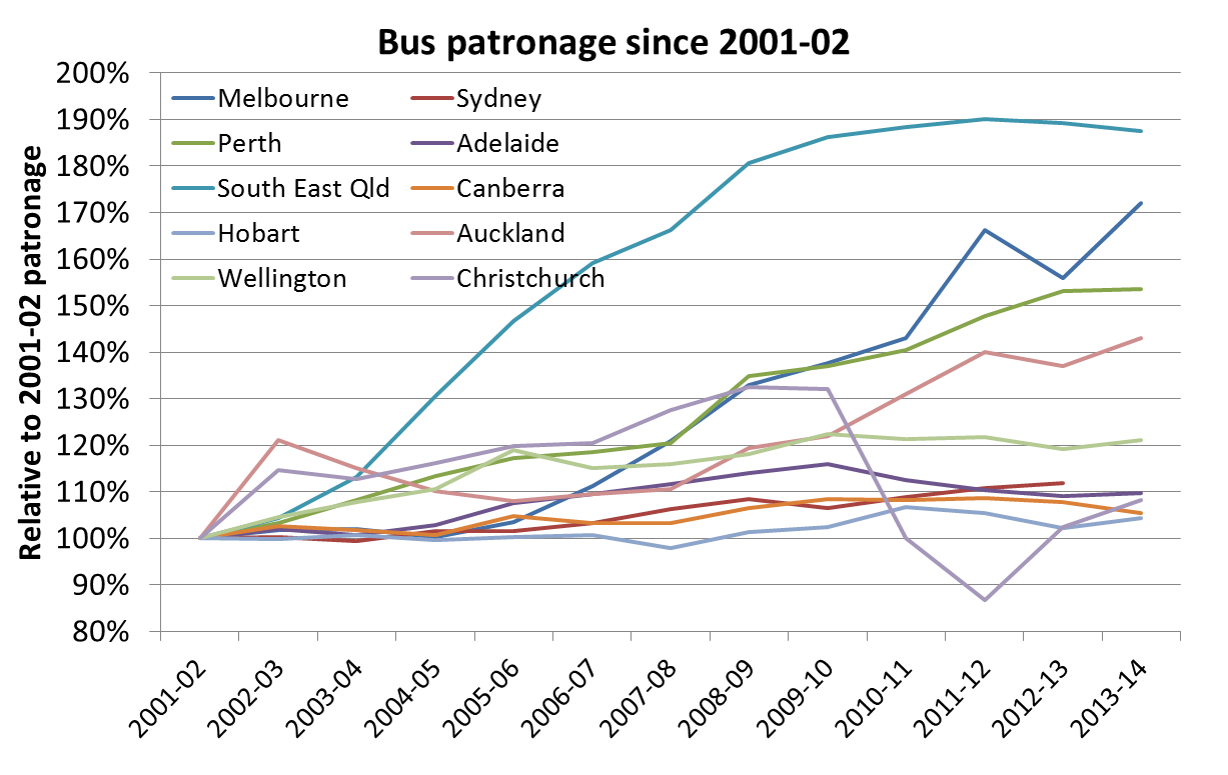
  • South East Queensland is by far the standout for bus patronage growth, which has followed substantial investment in busways and increases in bus frequency. Patronage almost doubled to 2012 on SEQ buses, although there has been a decline post 2012.
  • Melbourne’s bus patronage has grown significantly since 2006-07 onwards, although with a difficult to explain spike in 2011-12.
  • Perth’s bus patronage is an interesting story. Between 2007-08 and 2009-10, patronage increased by 14%, while timetabled kms only increased by 2.8%. When the Mandurah line was opened in late 2007, buses that previously travelled into the city were converted into rail feeder buses. This significantly reduced the bus trip lengths and hence passenger trip lengths for people who now transfer onto trains (the introduction of transfers might also have increased total boardings more than the total number of “journeys”). Presumably it meant that bus frequencies could be improved and/or buses were reconfigured to meet travel demands that were not well catered for previously.

Ferry and light rail patronage

other modes growth 3

  • Brisbane ferry patronage almost doubled between 2002-03 and 2008-09, collapsed in 2010-11 following service suspensions and cutbacks resulting from flood damage, and then bounced back from 2011 and is growing stronger still. The strong growth to 2008-09 followed increased services, and fare integration with other modes.
  • Adelaide tram patronage grew significantly following the tram extensions into the city that opened in 2007 and 2010 (travel within the CBD area being free). For reasons better known to others, Adelaide tram patronage has declined since 2011.
  • Sydney ferry patronage has been mostly flat until 2013 (note: at the time of writing I did not have a good estimate of private ferry patronage (approx 9% of all ferry patronage) – from 2009-10 onwards I have simply assumed no change in those numbers for want of something better).

Boardings per capita

Trends in public transport patronage will of course be impacted by population growth, so the ratio of the two can be a good indicator of system performance.

However, it is not necessarily fair to compare cities. The Sydney transit area includes many urban areas significantly detached from the main Sydney metropolitan area, including the cities of Newcastle and Wollongong. South East Queensland includes the Gold and Sunshine Coasts. But the Melbourne catchment does not include Victoria’s equivalent city of Geelong. The boardings per capita figure for the main Sydney and Brisbane metropolitan areas would likely be higher than the figures here. So it is more important to look at trends (household travel survey mode share figures may be a better method of comparison).

boardings per capita 3

  • This chart shows Melbourne as the stand-out in terms of increasing boardings per capita, a trend that started in 2004-05 (as many other of my posts have shown), although with some decline in 2012-13.
  • South East Queensland showed an increasing trend between around 2003-04 and 2008-09 but has since been in decline.
  • Perth had a significant increase in 2008-09, following the opening of the Mandurah rail line.
  • Adelaide has declined in recent years (in part due to rail works) while Canberra and Hobart remain flat.
  • Sydney+surrounds has bucked the trend of the larger cities, with no great increase in boardings per capita.
  • Wellington has the highest boardings per capita in New Zealand (notionally higher than most Australian cities). When you take into account that Wellington does not have a heavily transfer-orientated PT network, a figure for PT “journeys” per capita for Wellington is likely to be very competitive with Melbourne and Sydney.
  • Auckland has seen some steady growth in recent years from a low base.
  • Christchurch had seen some small growth to 2009-10, but collapsed in 2010-11, after major earthquake disruptions in the city. They appear to have arrested the decline in 2012-13.

Again, I must stress that it is dangerous to read too much into comparisons between cities because of the somewhat arbitrary definitions of transit system area boundaries.

For New Zealand, I have used “service area population” estimates kindly provided to me by Ian Wallis and Associates (for up to 2009-10) and then applied district population growth rates to estimate 2010-11 (and subsequent) service area populations.

A slightly better measure than public transport boardings per capita might be public transport journeys (or linked trips) per capita. This is something I would like to explore more in a future post.

The BITRE yearbook includes data on passenger kms per mode per city. From this data it is possible to obtain estimates of mass transit passenger kms per capita (I say mass transit, as they do not distinguish public and private bus). Here’s a chart using the 2014 yearbook data:

BITRE mass transit kms per capita

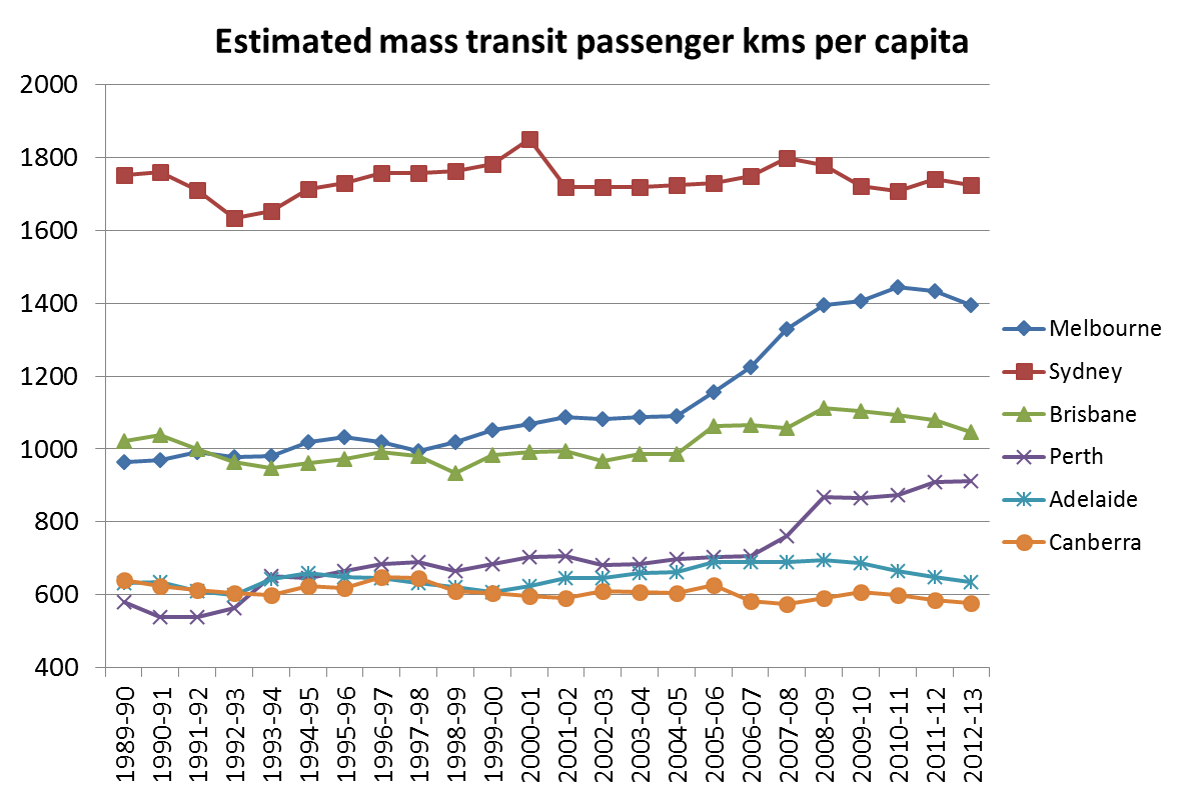
The trends are not dissimilar to my chart above. The BITRE figures are presumably a multiplication of estimated boardings (very similar data to mine) by estimated average route length (I suspect highly accurate time series, data on this is hard to find), or similar.

Long term patronage data

David Cosgrove from BITRE recently collated annual data on public transport patronage for all Australian capital cities, right back to 1900. His very interesting ATRF 2011 paper is here. He includes several summary charts which I won’t repeat here. What follows is some further analysis of this particular dataset.

The following chart shows estimated public transport trips per capita over 110 years:

Note BITRE used Sydney statistical division population with all Cityrail patronage, which is different to my approach above. It probably explains why Sydney figures are much higher.

Public transport usage rates grew until Word War 1, dropped in the Great Depression, peaked during petrol rationing in World War 2, and then declined until around 1980. In the bottom right corner you can see several cities trending upwards in recent times.

It is interesting to see Canberra had comparatively very low rates of public transport use until the 1980s – perhaps the product a low density car-based city from the start? Although public transport was clearly important leading up to Word War 2.

The Darwin figures are even lower – I’m not sure of the history but perhaps Darwin only became big enough to need public transport in the 1950s, a time when the car was becoming widely affordable.

You can see a spike in Hobart PT use from 1975 to 1977 – when the Tasman Bridge connecting the two sides of the city was severed after being struck by a ship.

The paper also includes estimates of passenger kms by mode since 1945. Here is a chart showing public transport mode share of motorised passenger kms:

Again I think the Sydney figures are inflated by non-Sydney Cityrail patronage.

More BITRE analysis is available in this 2014 paper.

Caveats and Disclaimers

This stuff is important, particularly for Sydney figures. (Similar caveats would apply to the long-term data from BITRE immediately above)

  • Patronage is invariably an estimation exercise, as not all passengers buy or validate a ticket when they board. The methodology used by agencies probably varies quite a bit. For example, Translink don’t seem to estimate free trips. The figures I have presented however are estimates of boardings (including boardings on journeys involving transfers). As far as I am aware, they include school children travelling on government funded bus services.
  • I have adjusted official Melbourne bus patronage figures to account for a change in estimation methodology.
  • Sydney bus patronage is very difficult to estimate, as figures are not routinely published for private operators. I’ve used a BITRE time series for Greater Sydney bus patronage (related to this paper).
  • The Sydney ferries figures include private operators (maybe 1-2 million per year), but I have had to estimate figures post 2009-10.
  • Sydney Metro light rail don’t generally publish their patronage figures to great precision. The 2008-09 figure I have is 7 million (rounded to the nearest million).
  • I have calculated the population of “Sydney+surrounds” as a combination of SA3 areas covering metropolitan Sydney, Newcastle, the Hunter Valley and Illawarra region. Here’s a map. Unfortunately it’s not a perfect match for the footprint of CityRail and “outer metropolitan” bus services, but I think reasonably close, particularly for trend analysis purposes.
  • South East Queensland includes Greater Brisbane Statistical Area plus the SA4 areas of Sunshine Coast and Gold Coast.
  • For other cities I have used population figures for Greater Perth (which includes Mandurah), Greater Adelaide and the Melbourne Statistical Division (estimated for 2011-12 based on an SA2 mapping, as towns within the “Greater Melbourne” Statistical Area that are not in the old Melbourne Statistical Division are not counted in official metropolitan bus and train patronage figures).
  • For all financial year population figures I have averaged the June 30 estimates at either end of each financial year.
  • I have not included:
    • Hobart ferries (with limited commuter services)
    • Queanbeyan buses (which connect Canberra with the satellite town of Queanbeyan, just over the border in NSW)
    • Metropolitan V/Line services in Melbourne: diesel train services currently operate to Melton which is in the Melbourne Statistical Division and has bus patronage that is counted as “metropolitan”. In previous years, V/line diesel trains also serviced the metropolitan area between St Albans and Sunbury and between Broadmeadows and Craigieburn (until these sections were electrified). I understand the metropolitan patronage on these services is in the order of a few million boardings per year, which is less than 1% of total Melbourne public transport patronage.
  • School holidays typically impact on public transport patronage (particularly suburban buses), and not all financial years contain the same number of (high patronage) school days as school holidays often straddle the June/July break of month. Different states have holidays in different weeks. This means that the individual growth figure for one year in one city might be impacted by up to 1-2% away from the underlying trend. However, this should wash out over several years for index values.
  • Compiling patronage figures is a very messy business. I’ve done the best I can, but I cannot guarantee that there are no omissions or calculation errors.

Data sources:


Trends in Melbourne Traffic

Sun 31 October, 2010

[first posted January 2010, last updated July 2013]

Each year, VicRoads publishes Traffic Systems Performance Monitoring bulletins that contain a wealth of data. However the bulletins don’t always show the longer term trends, so here are some charts to illuminate some of what is happening, particularly around congestion and total traffic volumes in Melbourne, and also a comparison of road traffic and public transport use growth.

Since the 2010-11 bulletin, VicRoads have changed the way they report various statistics. This post includes some charts of measures no longer reported, and in many cases the figures for 2010-11 and 2011-12 have been read off charts (as numbers were not published), so there is a little less precision.

Travel Speeds

The first chart shows average travel speed around Melbourne by time of day.

Melbourne average travel speed 5

The figures show a gradual slowing of speeds, although with some more erratic results in the AM peak in recent time (VicRoads haven’t offered an explanation, and I don’t have one either).

What about for different types of roads?

Melbourne average speed AM peak 3

Speeds have been declining on some road types, particularly inner freeways and inner undivided roads. Upgrades to the M1 completed in late 2009 may have increased speeds in 2010-11, but this appears to have been largely eroded in 2011-12.

Curiously, freeways slowed down after CityLink opened in 2001. Inner roads have been trending downwards slightly while outer roads seem to be steady (though with a slight increase in 2009-10). Outer freeways showed an increase in speed in 2008-09, which is related to the opening of Eastlink, but this was more than eroded in 2009-10, possibly related to the Ring Road widening works.

How does Melbourne compare to other Australian cities? This data is from AustRoads (except the 2011-12 figure for Melbourne):

Australian cities average speed AM peak 2

A gradual slowing trend is evident in most cities, except for speeding up in Melbourne and Brisbane up to 2010-11 (although Melbourne slowed down again in 2011-12). The Perth and Brisbane data seems to move around a lot more than the other cities. See the AustRoads website for qualifications on the data.

All-day average speeds by road type have not been reported for years after 2009-10, but here are the previous results:

Melbourne all day speed by road type

Is speed a good thing? If you want to get to your destination sooner, then obviously it is. If you want to improve safety and the liveability of streets, it possibly isn’t. A lot of road safety initiatives (eg right turn signal controls) actually slow down traffic. The other consideration is whether you experience the same travel speed each day – which brings us to…

Travel time variability

Another measure of congestion is travel time variability. If it sometimes takes 40 minutes to get to work, and you need to arrive at work on time, you have to leave yourself 40 minutes, even if on average it takes 30 minutes.

Melbourne variability of travel time 3

The recent trend has been towards increased variability after some improvements in 2009-10.

Traffic volumes

Since the 2010-11 Traffic Monitor report, VicRoads have completely revised their estimates for total arterial road traffic volumes and have divided Melbourne into three zones (inner, middle and outer) whereas previous results were for two zones (inner and outer). The new results show some quite different trends. I’ve read the data off the charts (not an exact process), to produce the following chart showing growth index figures (old figures in blue, revised figures in orange):

Melbourne traffic volumes by zone old and new

The previous estimates suggested traffic volumes stopped growing around 2004-05, whereas the revised estimates suggest an outer suburban growth spurt from around 2006, and a strong middle suburban growth spurt from around 2010. The 2011-12 bulletin did not include estimates for 2011-12.

This is what VicRoads says about the new method:

VicRoads has recently developed a new method for estimating road use in Melbourne. The new method uses all available vehicle counts to calculate VKT for all arterial roads and freeways in Melbourne. VKT values used in previous editions of the Traffic Monitor were derived from the monitored network only. The new method captures travel for the whole of Melbourne and allows estimates to be retrospectively made for previous years.

BITRE also estimate total Melbourne vehicle kilometres (using fuel sales data, so including all roads, not just arterials and freeways). The most recent data at the time of updating this post was Information Sheet 44. Here’s a comparison (again using index values):

Melbourne total vkms growth estimates

The BITRE data suggests a slightly different trend, but a similar overall growth figure and recent stronger growth. Putting the two VKT estimates together suggests that around 75% of Melbourne vehicle kilometres are travelled on arterials and freeways.

To add a little more context, here is a chart comparing road traffic and public transport patronage growth:

Melbourne total vkms and PT growth estimates

This chart really tells a story. Over eleven years to 2012, Melbourne public transport patronage has grown around three times more than road traffic.

Traffic growth on different road types

Here is a chart with 2010-11 data using the new road type classifications:

Melbourne traffic growth by road type

And here is the longer term trend using the older road types (up to 2009-10 only):

Melbourne index of traffic volume by road type 4

Traffic on freeways has risen substantially – not surprising given massive investment in freeway infrastructure over the last couple of decades. There has been a substantial growth in the last few years, reflecting the opening of Eastlink in 2008, the widening of the M1 in 2009, and diversion of some traffic off other outer roads (and you can see a decline in “outer – divided”). Otherwise, freeway traffic volumes seem to be growing while arterial roads are showing stagnant or declining traffic volumes.

Take the freeways off the chart and you can see trends on other roads a bit more clearly:

Melbourne index of traffic volume by road type ex freeways 3

Traffic volumes have trended downwards on undivided inner roads (including those with trams), and have largely stagnated on all other non-freeway roads in recent times. You can also see a significant drop on outer-divided roads in 2008-09 – possible some of it from Springvale and Stud Roads that parallel EastLink.

For more detail (including other charts), I suggest reading the Traffic Systems Performance Monitoring bulletins on the VicRoads website.


Public transport mode share – according to household travel surveys

Sat 10 April, 2010

[post revised and updated October 2012 with new data from Sydney, Brisbane, and New Zealand]

Arguably the best source of public transport mode share statistics is from household travel surveys that are conducted in most large Australia cities and all of New Zealand (unfortunately some surveys more regularly than others). A common measure is public transport’s share of motorised trips (although public transport will also be competing with unmotorised transport modes).

In household travel survey speak, a linked trip is a journey between two distinct non-travel activities, and may involve several trip legs or unlinked trips. For example, if you walk to a bus stop, catch a bus to the train station, then catch a train to the city, then walk to your workplace, that is one linked trip made up of 4 unlinked trips (walk, bus, train, walk). Similarly if you drive from your home to your workplace, that’s one linked trip made up of one unlinked trip (unless you decide to count walking to and from the car). Hence mode share figures that relate to unlinked motorised trips will always be higher than mode share figures that relate to linked trips.

The data I have been able to obtain for cities is sometimes linked trips, sometimes unlinked trips, and sometimes both. It should be possible to get figures for both for any city, and I hope to obtain such data from state transport agencies in the future.

Here is the data I have for linked trips:

And here are the results for unlinked trips:

The Melbourne and Sydney measures are for weekdays only, whereas the New Zealand data appears to be for all days of the year.

In 2008, Melbourne appeared on track to overtake Sydney on unlinked trip public transport mode share, however the 2009-10 result for Melbourne was lower than predicted. Note that the error bars on the 2007-08 and 2009-10 VISTA survey results for Melbourne indicate the actual mode share might not have actually gone down significantly (similar error bars would apply to the linked trip data points). Over the same period public transport patronage grew by 11% and arterial road traffic grew by around 1.2%.

How reliable is this data?

Given that most household travel surveys interview thousands of households in any one year, the results should be pretty accurate for a high level reported figure such as mode share of trips. Household travel survey techniques have matured over the years, so it is likely they are reasonably reliable (particularly more recent results in larger cities).

The Perth survey data for 2003 to 2006 does not correlate with public transport patronage figures, that show a 12% growth over the same period.

For Brisbane 2003-04 I had to add whole number shares for each mode and divide by the sum of motorised mode shares. So there is some uncertainty about the precise motorised mode share.

The Melbourne official estimates for 2002-2007 were calculated using VicRoads traffic data, and public transport patronage figures.

(For more detail see the end of this post).

Linked or unlinked trips?

Calculating mode share based on linked trips removes the impact of public transport transfers. Cities where the public transport network is structured around feeder services with free transfers (eg bus to train) may have more public transport boardings (unlinked trips) than cities where transfers are “less encouraged” by the network design and fare systems (eg Wellington, Auckland, Sydney).

In fact, here is a chart showing the ratio of unlinked to linked public transport trips for four cities where I have data:

The Perth and Adelaide data is based on patronage figures that are reported as ‘initial boardings’ and ‘all boardings’. Annual reports comment that recent through-routing of bus services through the Adelaide CBD may have reduced the number of transfer boardings. You can see the transfer rate for Perth jumped after the southern suburbs railway opened at the end of 2007 (replacing many CBD bus routes with train feeder bus routes).

The Perth, Adelaide and Melbourne public transport fare systems are dominated by products that allow unlimited transfers within a time window (anywhere from 2 hours to 365 days). So while there may be a time and convenience penalty for transferring between two services, there is no financial penalty. Sydney’s public transport fare system has largely involved tickets for a single trip and/or one mode, such that another fare must be paid to transfer. Sydney’s CBD is also served by seemingly hundreds of bus routes – many of which parallel train lines – which enable people to travel to the city without having to transfer onto trains and pay a higher fare (even if that could provide a faster over journey).

The lower Sydney transfer rate partly explains why Melbourne and Sydney are much closer on mode share of unlinked trips, compared to mode share of linked trips. Network design will probably also have an impact.

There was a slight dip in the trend for Sydney around 2007-08 followed by a rise. I’m not sure what might explain that trend – the revamp of the fare system in April 2010 (introducing more multi-modal and multi-operator tickets) may have had a small impact on the 2009-10 figure.

The difference in these rates suggests that there could be quite substantial change in Sydney public transport use patterns should the fare system be revised to make free transfers the norm. Perhaps this might help ease the bus congestion issues in the CBD and allow higher bus frequencies in the suburbs? (assuming there is capacity to transfer bus passengers onto trains in the suburbs). There is one small area of Sydney where train+bus link tickets are available (no fare penalty for transferring), and the census data reveals a very significant rate of bus+train journeys to work in the Bondi Beach area, much higher than anywhere else in Sydney.

Other measures of public transport mode share

In another post, I looked at BITRE data on estimated passenger kms per mode in Australian cities (presumably calculated using patronage figures and average trip lengths from household travel survey data or elsewhere). That enabled calculation of estimated public transport mode share of motorised passenger kilometres, with continuous time series available for all Australia cities. However there will be many assumptions involved in these estimates.

Another measure is boardings per capita (covered here), although this also has the problem of different transfer rates in different cities.

The quest for a fair measure of public transport use continues!

Household travel survey sources:

Melbourne: Victorian Department of Transport (personal communications), but also available in the Growing Victoria Together Progress Report (page 387), in the 2009-10 Victorian State Budget Papers. Figures until 2001 were from the VATS survey, while the 2008 result is from the VISTA survey.

Sydney Household Travel Survey: Data was supplied by NSW Transport Data Centre by email. Public transport trips are inclusive of trains, buses, ferries, monorail and light rail.

Adelaide Household Travel Survey (AHTS): Adelaide Travel Patterns: an overview (if anyone can tell me about whether more recent surveys have been conducted I would be very appreciative, better still if I can get results data!).

South East Queensland Travel Survey: Brisbane Fast Facts Brochure (unclear dating, but PDF was created in 2006 so I assume the results are for 2003-04. The report does not mention whether these are mode shares for trips or kms, however it seems highly likely they are for trips as the walking mode share was 10% and we know walking trips are generally shorter than motorised trips). I also have results for 2008-09 courtesy of Ian Wallis and Associates. I unfortunately do not yet have results for the 2006-2008 survey.

Perth and Regions Travel Survey (PARTS): Data is from the PARTS Key Findings Report (by Data Analysis Australia). The  2003-2006 results are from PARTS, the 2000 figure is a TravelSmart estimate, and 2001 and 2008 estimates are from unspecified sources.

The New Zealand Household Travel Survey: Because of sample sizes, the figures for the New Zealand cities are two years combined (ie the “2010” figure is for 2008/09 and 2009/10). The Canterbury region includes Christchurch as well as a not insignificant surrounding population. The Auckland region is more similar to the Australian cities statistical divisions. The Wellington figures are for the Wellington Region, but are dominated by metropolitan Wellington.


Infrastructure Australia’s transport priorities for Australian cities in 2009

Sat 20 March, 2010

The following chart suggests that in 2009, Infrastructure Australia thought public transport was a higher priority than road expansion in Australian capital cities.

It compares state government bids for capital city transport projects (in 2008), what Infrastructure Australia thought were the priorities (in May 2009), and of these, which projects received funding in the 2009/10 federal budget (May 2009).

Clearly public transport projects came out much better than urban road projects when Infrastructure Australia applied their selection criteria, which included climate change, livability, sustainability and productivity (I suggest you read the Infrastructure Australia publication for more details).

Of the state public transport bids, only light rail in Canberra, and a small project in Geelong were not shortlisted. Most city road projects were not short-listed.

Infrastructure Australia short-listed public transport projects with four times the value of the road projects. Federal funding was a 5:1 ratio of public transport to roads. (Note: these ratios are for capital city projects only).

There was also federal funding for about $1.2b of country highway projects that were not short-listed by Infrastructure Australia.

Note: Some projects were not entirely road or public transport but I have classified them by the dominant component, and there were some small  city transport projects that were not listed by IA, but were funded anyway. However the impacts of these issues would be very small on the chart above.