[post revised and updated October 2012 with new data from Sydney, Brisbane, and New Zealand]
Arguably the best source of public transport mode share statistics is from household travel surveys that are conducted in most large Australia cities and all of New Zealand (unfortunately some surveys more regularly than others). A common measure is public transport’s share of motorised trips (although public transport will also be competing with unmotorised transport modes).
In household travel survey speak, a linked trip is a journey between two distinct non-travel activities, and may involve several trip legs or unlinked trips. For example, if you walk to a bus stop, catch a bus to the train station, then catch a train to the city, then walk to your workplace, that is one linked trip made up of 4 unlinked trips (walk, bus, train, walk). Similarly if you drive from your home to your workplace, that’s one linked trip made up of one unlinked trip (unless you decide to count walking to and from the car). Hence mode share figures that relate to unlinked motorised trips will always be higher than mode share figures that relate to linked trips.
The data I have been able to obtain for cities is sometimes linked trips, sometimes unlinked trips, and sometimes both. It should be possible to get figures for both for any city, and I hope to obtain such data from state transport agencies in the future.
Here is the data I have for linked trips:

And here are the results for unlinked trips:

The Melbourne and Sydney measures are for weekdays only, whereas the New Zealand data appears to be for all days of the year.
In 2008, Melbourne appeared on track to overtake Sydney on unlinked trip public transport mode share, however the 2009-10 result for Melbourne was lower than predicted. Note that the error bars on the 2007-08 and 2009-10 VISTA survey results for Melbourne indicate the actual mode share might not have actually gone down significantly (similar error bars would apply to the linked trip data points). Over the same period public transport patronage grew by 11% and arterial road traffic grew by around 1.2%.
How reliable is this data?
Given that most household travel surveys interview thousands of households in any one year, the results should be pretty accurate for a high level reported figure such as mode share of trips. Household travel survey techniques have matured over the years, so it is likely they are reasonably reliable (particularly more recent results in larger cities).
The Perth survey data for 2003 to 2006 does not correlate with public transport patronage figures, that show a 12% growth over the same period.
For Brisbane 2003-04 I had to add whole number shares for each mode and divide by the sum of motorised mode shares. So there is some uncertainty about the precise motorised mode share.
The Melbourne official estimates for 2002-2007 were calculated using VicRoads traffic data, and public transport patronage figures.
(For more detail see the end of this post).
Linked or unlinked trips?
Calculating mode share based on linked trips removes the impact of public transport transfers. Cities where the public transport network is structured around feeder services with free transfers (eg bus to train) may have more public transport boardings (unlinked trips) than cities where transfers are “less encouraged” by the network design and fare systems (eg Wellington, Auckland, Sydney).
In fact, here is a chart showing the ratio of unlinked to linked public transport trips for four cities where I have data:

The Perth and Adelaide data is based on patronage figures that are reported as ‘initial boardings’ and ‘all boardings’. Annual reports comment that recent through-routing of bus services through the Adelaide CBD may have reduced the number of transfer boardings. You can see the transfer rate for Perth jumped after the southern suburbs railway opened at the end of 2007 (replacing many CBD bus routes with train feeder bus routes).
The Perth, Adelaide and Melbourne public transport fare systems are dominated by products that allow unlimited transfers within a time window (anywhere from 2 hours to 365 days). So while there may be a time and convenience penalty for transferring between two services, there is no financial penalty. Sydney’s public transport fare system has largely involved tickets for a single trip and/or one mode, such that another fare must be paid to transfer. Sydney’s CBD is also served by seemingly hundreds of bus routes – many of which parallel train lines – which enable people to travel to the city without having to transfer onto trains and pay a higher fare (even if that could provide a faster over journey).
The lower Sydney transfer rate partly explains why Melbourne and Sydney are much closer on mode share of unlinked trips, compared to mode share of linked trips. Network design will probably also have an impact.
There was a slight dip in the trend for Sydney around 2007-08 followed by a rise. I’m not sure what might explain that trend – the revamp of the fare system in April 2010 (introducing more multi-modal and multi-operator tickets) may have had a small impact on the 2009-10 figure.
The difference in these rates suggests that there could be quite substantial change in Sydney public transport use patterns should the fare system be revised to make free transfers the norm. Perhaps this might help ease the bus congestion issues in the CBD and allow higher bus frequencies in the suburbs? (assuming there is capacity to transfer bus passengers onto trains in the suburbs). There is one small area of Sydney where train+bus link tickets are available (no fare penalty for transferring), and the census data reveals a very significant rate of bus+train journeys to work in the Bondi Beach area, much higher than anywhere else in Sydney.
Other measures of public transport mode share
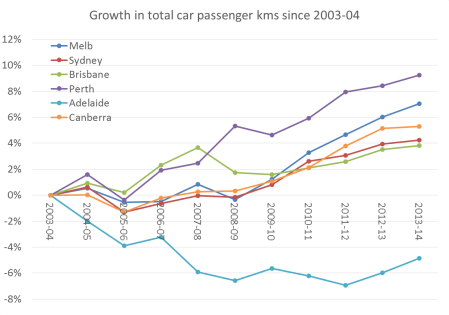
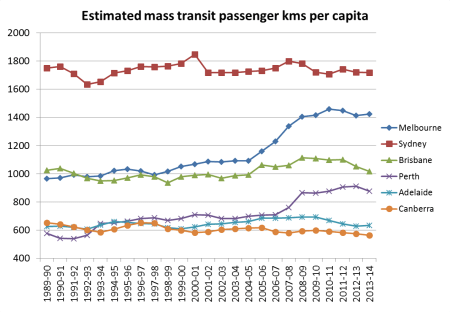
In another post, I looked at BITRE data on estimated passenger kms per mode in Australian cities (presumably calculated using patronage figures and average trip lengths from household travel survey data or elsewhere). That enabled calculation of estimated public transport mode share of motorised passenger kilometres, with continuous time series available for all Australia cities. However there will be many assumptions involved in these estimates.
Another measure is boardings per capita (covered here), although this also has the problem of different transfer rates in different cities.
The quest for a fair measure of public transport use continues!
Household travel survey sources:
Melbourne: Victorian Department of Transport (personal communications), but also available in the Growing Victoria Together Progress Report (page 387), in the 2009-10 Victorian State Budget Papers. Figures until 2001 were from the VATS survey, while the 2008 result is from the VISTA survey.
Sydney Household Travel Survey: Data was supplied by NSW Transport Data Centre by email. Public transport trips are inclusive of trains, buses, ferries, monorail and light rail.
Adelaide Household Travel Survey (AHTS): Adelaide Travel Patterns: an overview (if anyone can tell me about whether more recent surveys have been conducted I would be very appreciative, better still if I can get results data!).
South East Queensland Travel Survey: Brisbane Fast Facts Brochure (unclear dating, but PDF was created in 2006 so I assume the results are for 2003-04. The report does not mention whether these are mode shares for trips or kms, however it seems highly likely they are for trips as the walking mode share was 10% and we know walking trips are generally shorter than motorised trips). I also have results for 2008-09 courtesy of Ian Wallis and Associates. I unfortunately do not yet have results for the 2006-2008 survey.
Perth and Regions Travel Survey (PARTS): Data is from the PARTS Key Findings Report (by Data Analysis Australia). The 2003-2006 results are from PARTS, the 2000 figure is a TravelSmart estimate, and 2001 and 2008 estimates are from unspecified sources.
The New Zealand Household Travel Survey: Because of sample sizes, the figures for the New Zealand cities are two years combined (ie the “2010” figure is for 2008/09 and 2009/10). The Canterbury region includes Christchurch as well as a not insignificant surrounding population. The Auckland region is more similar to the Australian cities statistical divisions. The Wellington figures are for the Wellington Region, but are dominated by metropolitan Wellington.


 Posted by chrisloader