Updated April 2026 with data up to June 2025 for most charts.
Data source: ABS Regional population (latest release March 2026), updated annually.
Population weighted density
Population weighted density here is calculated using the ABS square kilometre population grid, clipped by greater capital city statistical area boundaries. Hobart and Darwin are excluded because of small footprints. For more discussion on density measurement and deeper analysis see this post.
Note: I have recently refined calculations of density using population grid data to exclude areas outside greater capital city statistical area boundaries – including larger areas of water. This has increased calculated density values by different amounts for different cities. Refer appendix below for more details.
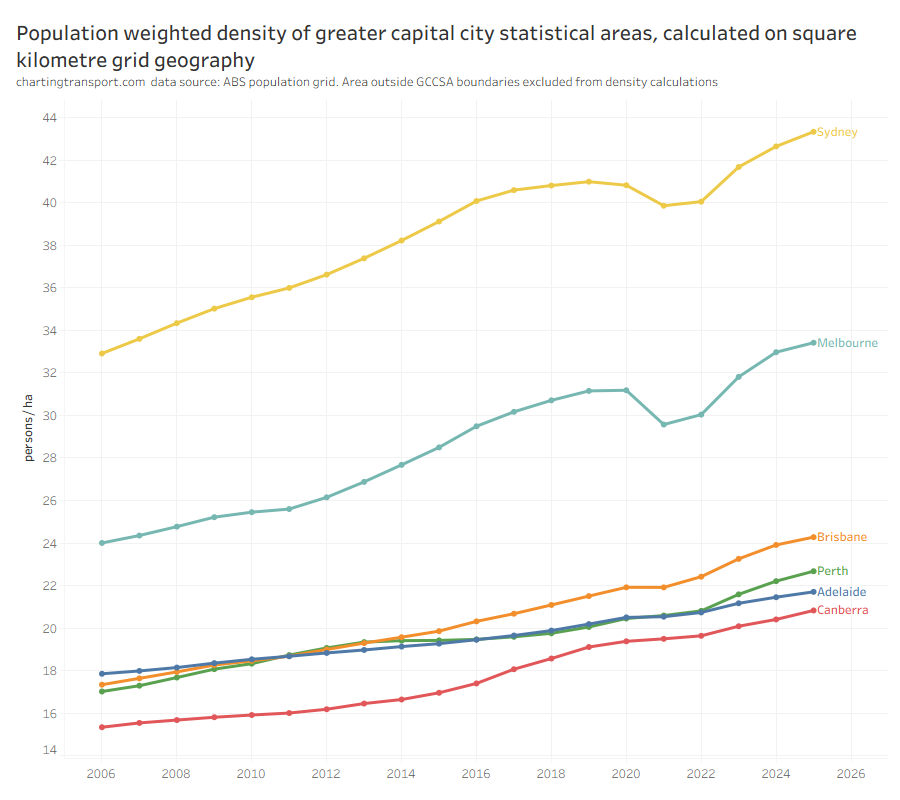
Sydney has almost double the population density of most other Australian cities, with the exception being Melbourne which sits halfway in between.
Population weighted density was rising in all cities until 2019, although the growth was notably slowing in Sydney from about 2016.
With more recent rapid population growth, density increased sharply to June 2024 in most cities, and a little slower to June 2025. Sydney, Melbourne, Brisbane, and Perth have recently been densifying at a rapid rate relative to pre-pandemic times. Perth has also pulled ahead of Adelaide.
Canberra shows the lowest population weighted density on this calculation but this is arguably an under-representation. Canberra is the smallest of the cities in both area and population, and it also has significant areas of nature reserves and Lake Burley Griffin in the heart of the urban fabric (some call it the bush capital) – none of which is clipped from the density calculation (unlike Sydney Harbour). Compared to the other cities, a significant proportion of its grid cells are only partially urban, bringing down the overall population weighted density.
While I’ve contemplated clipping these non-urban areas from the Canberra population grid cells, there is a risk this would be inconsistent with other cities that also have many urban-non / urban interfaces, and I’d also probably be reliant on SA1 or SA2 geographies to define non-urban areas, which I know are not consistently drawn across all states and territories. There would also then be arguments that proximity to open space is important for residents so some of this open space should be included in the density calculation.
It’s probably impossible to come up with a perfectly objective measure of population density, particularly for smaller cities.
Population living at different densities
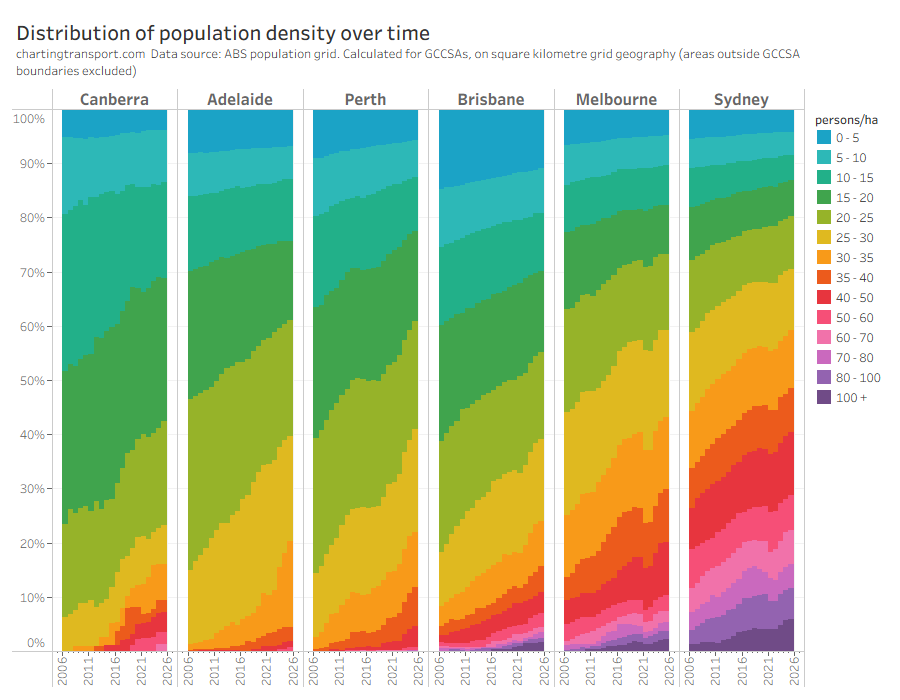
In 2025, there was another significant increase in the population living at higher densities in all cities, more than reversing the impact of the COVID19 pandemic in earlier years.
Proportion of population living at different distances from the city centre
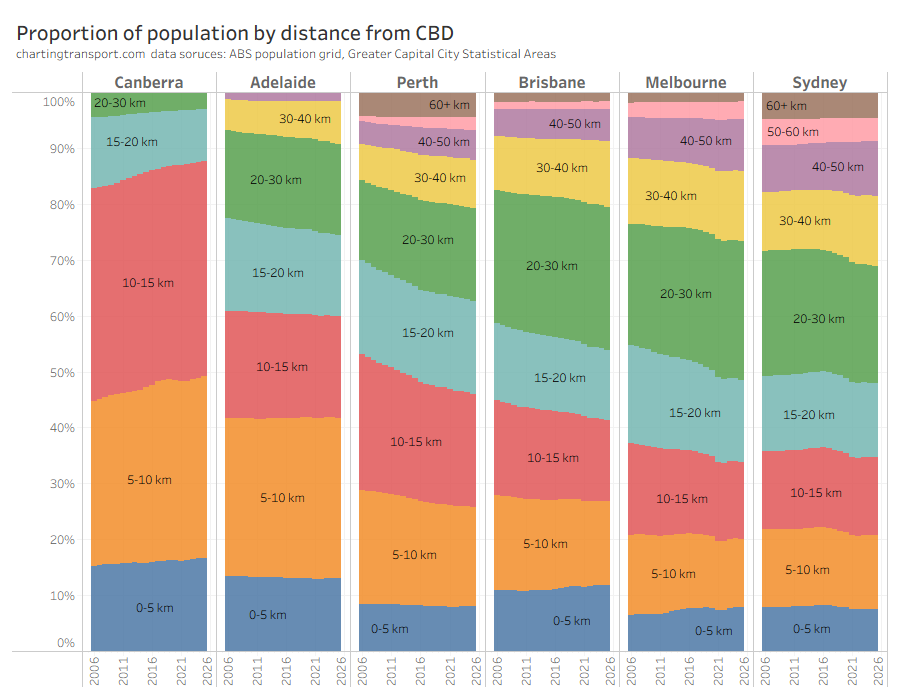
Most cities have seen a general trend towards more of their population living further from the CBD, although the distribution appears to have stabilised in Sydney in recent years.
Canberra shows a very different trend to all other cities. Its outer urban fringe has expanded by little more than a couple of kilometres at the most, with substantial in-fill housing at major town centres and the inner city (note: the Greater Capital City Statistical Area for Canberra is the state border and excludes Queanbeyan in NSW which is functionally part of Canberra).
Population density by distance from a city’s CBD
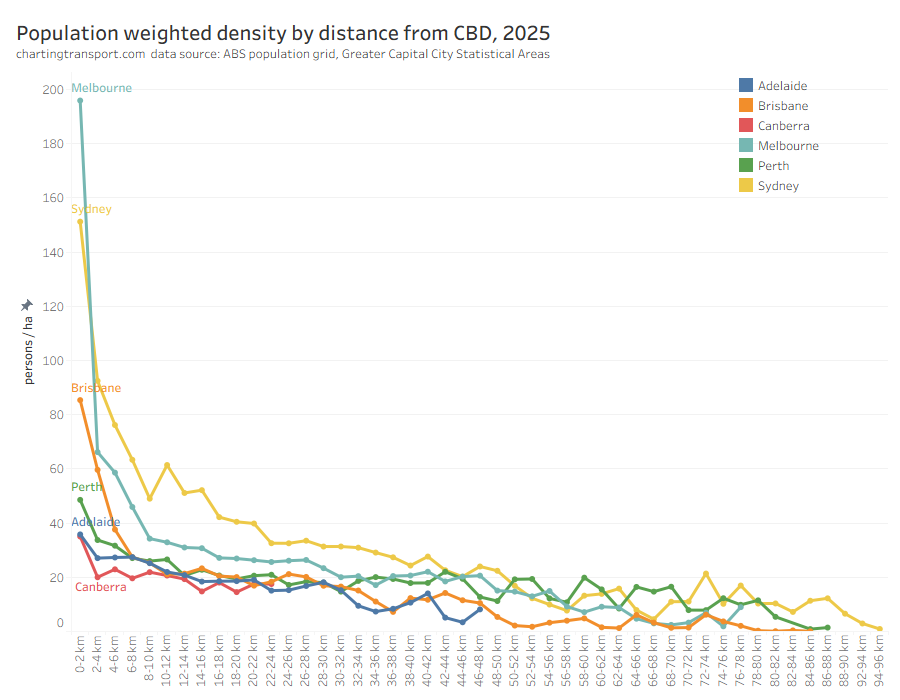
Sydney has significantly higher density than all other cities at most distances from CBDs – up to 42 km out, with Melbourne a fair step behind. Most other cities flattened out to around 20-26 persons/ha from around 6+km out from their CBDs.
Population living near rapid transit stations
I’ve been maintaining a spatial data set of rapid transit stations (train and busway stations) including years of opening and closing, and from this it’s possible to assess what proportion of each city lives close to stations. Here’s the latest update to June 2024:

Sydney has the largest proportion of it’s population living within 1 km of a rapid transit station, with Melbourne not far behind, and Perth having the lowest. Melbourne has the highest share of population within 5 km of a station, followed by Adelaide.
There are many step changes on this chart where new train stations (on existing or new lines) have opened.
Perth had a dramatic shift in 2009 with the opening of the Mandurah rail line. Despite a few new stations and the opening of the Airport / High Wycombe line in late 2022, it has struggled to maintain it’s share of population close to train stations because of significant urban sprawl. MetroNet projects including the new Ellenbrook line and the extension of the northern suburbs line to Yanchep will probably make a big difference for the June 2025 assessment, but with with unrestrained urban sprawl it will likely be an ongoing challenge.
Adelaide, Brisbane, and Sydney had a higher share of population close to rapid transit in 2024 compared to 2006.
Melbourne has managed to keep around 90% of it’s population within 5 km of a train station over the last 20 years, but has seen a declining share of it’s population within 3 km of a train station.
City populated area footprint
The population grid data only measures residential population so it cannot be used to estimate the size of the total urban footprint of cities over time, but we can use it to estimate the urban residential footprint. I’ve used 5 persons/ha as an arbitrary minimum threshold for a grid cell to be counted as urban, and here’s how the cities have growth since 2006:
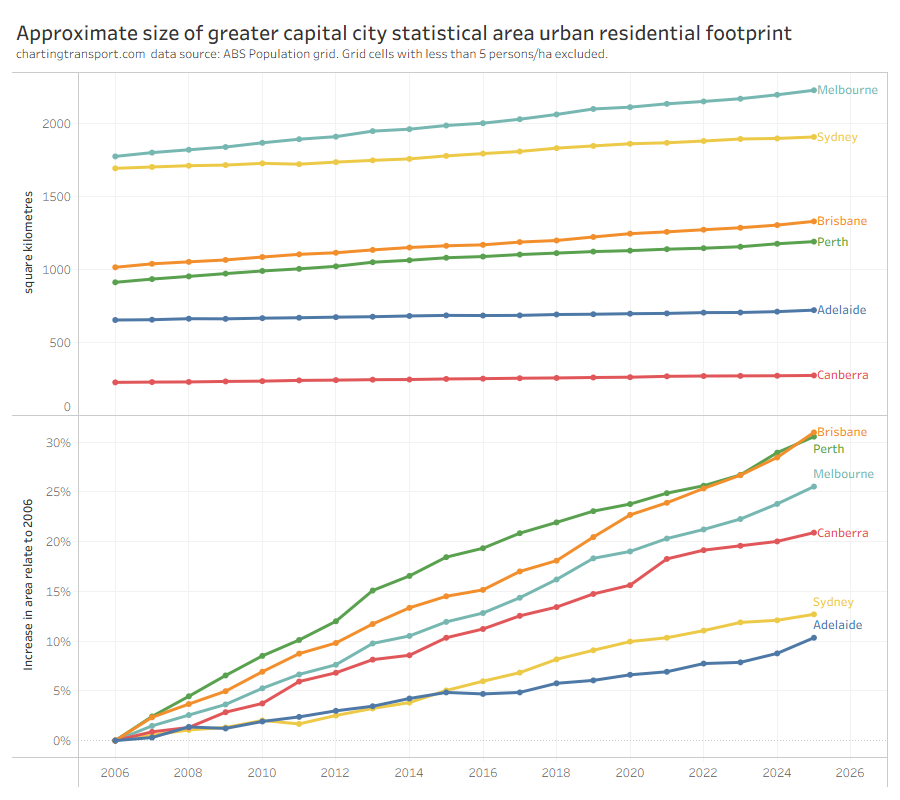
Melbourne is the latest city by area, although Sydney still has a slightly larger population.
The bottom half of the chart shows that Perth and Brisbane have had the largest percentage growth in urban residential footprint since 2006, followed by Melbourne. Sydney and Adelaide have had the least growth in footprint, and are also seeing the least population growth in percentage terms.
If you are interested to go further back in history, I have various estimates of population weighted density between 1981 and 2019 in the post How is density changing in Australian cities? (2nd edition). Note that these calculations use unclipped grid cells.
Animated population density maps
The following animated maps show the changing density of Australia’s six largest cities between 2006 and 2024:


Appendix – change in square km density calculation
As of April 2025, I have refined my population weighted density calculations using the square kilometre grid.
I’m now excluding (clipping) area in grid cells that is outside the greater capital city statistical area boundaries – and this includes larger bodies of water such as oceans, harbours, and wide rivers (hopefully the ABS have some guidelines about when to include/exclude larger bodies of water from statistical areas). It also excludes land outside statistical area boundaries on the edges of cities.
Previously grid cells were included for a capital city statistical area if the centroid of the grid cell was within ~1 km of the statistical area (a small buffer was added to ensure coastal grid cells were not excluded). This meant some areas just outside the statistical area were included. The new methodology no longer requires an arbitrary buffer.
The impact of this change is that cities with large water bodies and/or long shorelines calculate to higher densities. Most notably this change impacts Brisbane (roughly up 1 person/ha) and Sydney (roughly up 2 persons/ha).
The following pair of maps show density calculated on clipped and unclipped grid cells around Sydney Harbour:
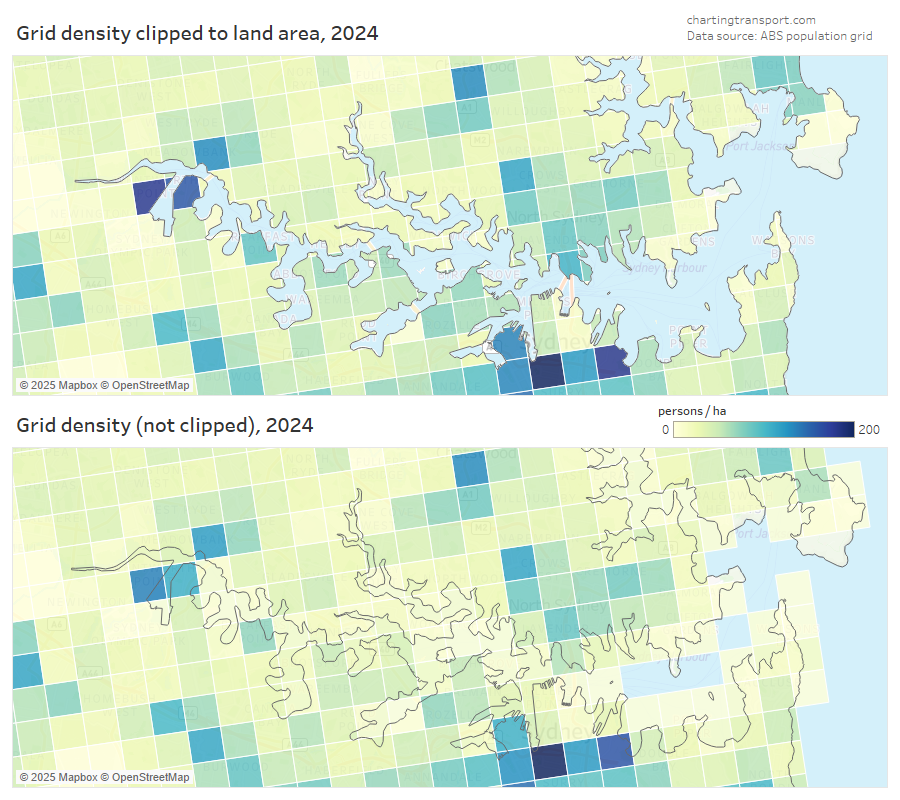
Many grid cells containing shorelines show relatively high density when clipped to the land area, and relatively low density when unclipped. For example the grid cell just east of North Sydney (mostly water) is 79 persons/ha when clipped, but only 24 persons/ha when unclipped.

