My last post about Brisbane journey to work focussed on where people live. This post focuses on where people work and what modes of transport they use to get there. It covers employment density, mode shares by work locations, and mode shares for people travelling to the CBD.
ABS data about mode shares at work place locations is available for Statistical Local Areas (SLA) in 2006, and for Statistical Area Level 2 (SA2) geography in 2011. These are the smallest available areas in each year, and unfortunately SLA level data was not available at the time of posting for 2011 (to enable a direct comparison on the same areas).
Fortunately for Brisbane, there is a lot of similarity between the two sets of boundaries (some SLAs split, some combined, some restructured).
The following maps alternate between 2006 and 2011 using the slightly different boundaries. You will need to click on them to enlarge and see the animation.
Caution is needed when making inferences when the geographies change as different areas will have different numbers of employees. For example: If two SLAs with 2% and 10% mode shares (in 2006) were combined into a new (2011) SA2 area with 11% mode share (in 2011), it doesn’t mean that mode share actually changed from 2% to 11% in the first of the SLAs. It may be that many more people were employed in the SLA with 10% mode share and actually very little changed overall.
Employment density
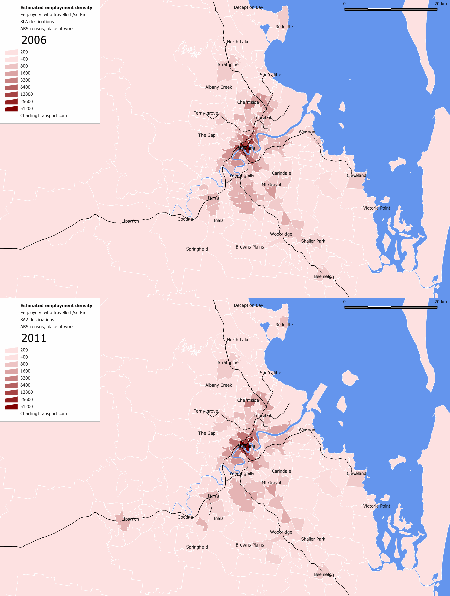
Firstly, what does the employment density of Brisbane look like? If I had the travel zone data available (as per Sydney), I’d be able to draw a much higher resolution picture, but for now I will have to suffice with SLA/SA2 employment density:
A lot of the differences you can see between 2006 and 2011 are to do with the change in boundaries, not necessarily changes on the ground. For example, there are many more SA2s than SLAs in the Ipswich area, which has meant the 2011 data shows a slightly dense area in the centre of Ipswich.
Some places where the SLA and SA2s are the same and a change in employment density is evident include reductions in New Farm, West End, Mitchelton, Wynnum, and Chermside West, and an increase in Enoggara.
Mode share by workplace location
I’ve zoomed in on the inner parts of Brisbane so you can see the inner city details for mode shares (apologies for the lack of place names – I figured the numbers showing the mode shares might be more interesting).
First up, public transport mode share:
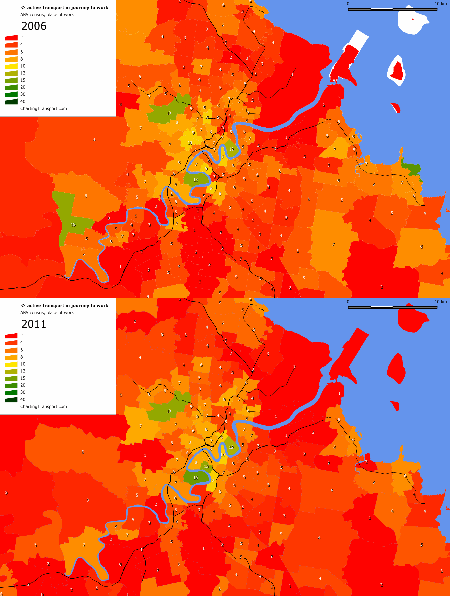
Public transport mode share was highest in the CBD, then for areas around the CBD and stretching to a little more to the inner south-west. Curiously, public transport mode share was relatively high in suburban Carindale (the patch of yellow turned green in the “middle” eastern suburbs) and Nundah in the middle northern suburbs.
Significant rises in PT mode share were evident in the following places:
- Fairfield/Dutton Park – which went from 7%/9% to 23%, which is probably related to the Boggo Road busway and green bridge and route 196 BUZ route.
- Chelmer (6% to 12%) – perhaps related to train frequency upgrades on the line to Darra
- Teneriffe (10% to 20%) – although it was absorbed into Newstead-Bowen Hills in 2011 the two SLAs combined into one SA2 had a similar number of employees in 2006. In 2011 Teneriffe was served by a new CityCat ferry terminal, and bus services were upgraded (including the CityGlider bus).
- Kelvin Road – Herston, which went from 14%/16% to 21% (including the growing Kelvin Grove Urban Village and bolstered by the northern busway)
Next is active transport:
There was very little change in active transport mode share by destination. The exceptions were St Lucia (including University of Queensland) which increased from 13% to 16%, and Highgate Hill which went from 9% to 13%. These areas are connected by the new green bridge (buses, walkers and cyclists only) which would have made it easier to reach these places by active transport.
Enoggera records 13% in both 2006 and 2011, which is explained by the existence of a major army barracks there. I’m not sure why the Anstead area had a 15% mode share in 2006 (it was blended out in 2011 with the change of geography).
Finally, here is sustainable transport mode share (public transport + active only transport):
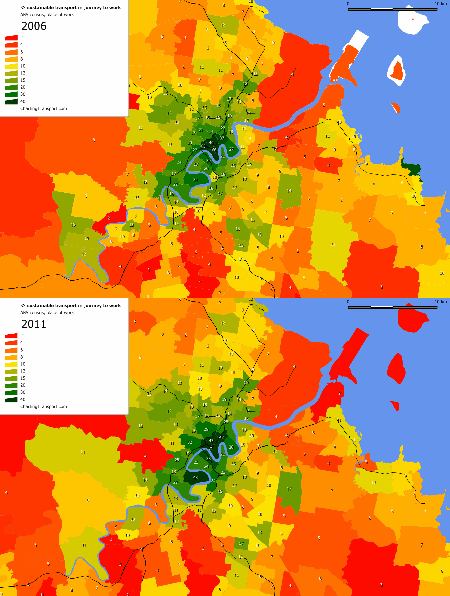
Suburban destinations with high sustainable transport mode share include:
- Robertson (which includes Griffith University went from 13% to 17%)
- Carindale (eastern suburbs, 14% to 17%)
- Taigum/Fitzgibbon (north suburbs, steady 12%)
- Mount Ommaney (south-western suburbs, 13% in 2006 but unclear in 2011 due to larger SA2)
The significant rises are covered by the discussion above.
Commuting to the CBD
The Central Business District (CBD) is an important destination as it has the highest employment density, and public transport is probably best placed to compete against the car. For this analysis I am defining the “CBD” as the Brisbane City SA2, which is bounded by Hale Street in the west, Wickham Terrace in the north, Boundary Street in the north-east, and the Brisbane River (here is a map). That’s probably bigger than what you might call the core CBD, but unfortunately I cannot obtain 2011 data at a smaller geography.
Brisbane’s CBD accounted for 15.5% of Greater Brisbane journey to work destinations in 2011, and 14.1% of Brisbane Statistical Division destinations in 2006 (Greater Brisbane is slightly larger than the Brisbane Statistical Division). There were 9.5% more journey to work destinations in the CBD in 2011 compared to 2006.
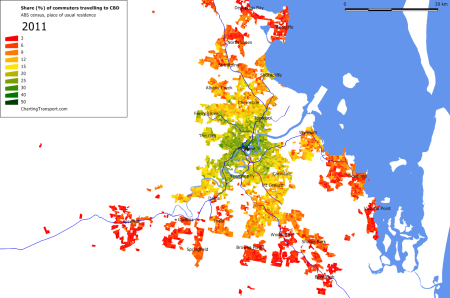
Here’s a map showing the proportion of commuters who had a destination of the Brisbane CBD in 2011 (by home location at SA1 geography):
The prevalence of the CBD as a work destination is almost directly proportional to the distance people live from the CBD, with the notable exception of Springfield in the southern suburbs.
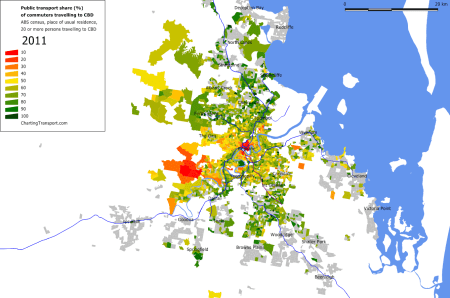
The next map shows the portion of CBD commuters who used public transport in their journey to work (by home location). I’ve only shaded SA1s with 20 or more CBD commuters, which is quite small for calculating mode shares.
Note: I have not filtered SA1s by density on these maps (unlike others), so some low density SA1s to the south-west of the CBD are included in the following maps.
Public transport mode share was particularly high for those further from the CBD (where such a long drive would probably not be fun or cheap). It was lowest around the CBD itself (presumably the locals just walked to work), a few scattered suburban locations, and around the wealthy and low density Pullenvale area to the south-west (served only infrequently by public transport but not that far from the CBD).
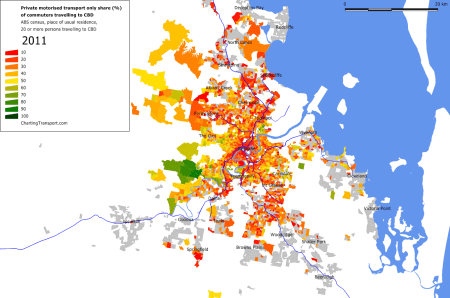
Here’s the share of people who only used private motorised transport to commute to the CBD:
Pockets of high private motorised transport mode share include:
- Hamilton/Albion
- Bardon
- Kenmore
- Fig Tree Pocket
- Capalaba
- Gumdale
- Tingalpa
- Yeronga
- Indooroopilly
- Pullenvale
I understand that many of these are relatively wealthy areas.
Mode shift in journeys to the CBD
How have mode shares changed for journeys to work in the CBD?
Public and active transport increased their mode shares considerably over the 10 years. In fact, the Brisbane CBD had the second highest mode shift to public transport (in percentage terms) of major Australian CBDs (behind Perth, more on that in a future post).
The absolute number of car driver trips fell from 26,397 in 2001 to 23,244 in 2011, while the number of public transport trips shot up from 47,208 in 2001 to 65,570 in 2011 – a 39% increase (a very similar increase to Melbourne and Adelaide). In the same time, South East Queensland public transport patronage grew by 59%.
The vast majority of people who used public transport to commute to the CBD only used one mode of public transport. However, the percentage of people using multiple public transport modes rose from 2.7% in 2001 to 2.9% in 2006 and 3.6% in 2011, suggesting integrated ticketing may be influencing public transport travel behaviour. That said, Brisbane’s CBD still had the lowest rate of multiple public transport mode journeys to work of the CBDs of Australia’s five biggest cities (more on that soon).
I’d like to acknowledge Jane Hornibrook for assistance with this post.



Hi Chris
I forgot to mention that Boggo Road Urban Village in Dutton Park became a new employment centre since the 2006 Census. When the Boggo Rd busway opened in 2009 the Gold Coast/AirTrain timetable was reviewed to allow passenger rail services to stop at Park Rd rail station in the off-peak. This initiative, along with the new Dutton Park Busway station, both adjacent to the new Boggo Rd Urban Village, no doubt contribute to high pt mode share to this new employment centre. Also worth noting TransLink put in a great deal of effort to work with the employers who were relocating to the Urban Village to provide travel information for their employees before the move. Many employees were use to driving to their previous suburban offices and free car parking was not provided at the new Urban Village. Just goes to show that people are willing to change their travel behaviour if you provide quality services, infrastructure and passenger information. It also helps when car parking is not provided free of charge.
LikeLike
Can you pleased do a post where you include step by step instructions for producing your own maps on Census Table Builder? This would make it easier for more people to explore the data in their own way.
LikeLike
Good stuff. May i know how you retrieve the data from ABS?
LikeLike
I extract the data from ABS using TableBuilder Basic. It’s free, but you have to register.
LikeLike