Suburban employment clusters and the journey to work in Australian cities

Sun 8 July, 2018

Relatively dense suburban employment clusters can deliver more knowledge-based jobs closer to people living in the outer suburbs. Sydney has many such clusters, and Melbourne is now aiming to develop “National Employment and Innovation Clusters” as part of the city’s land use strategy, Plan Melbourne.

So what can we learn about existing employment clusters in Australian cities, particularly in regards to journeys to work? Can relatively dense suburban employment clusters contribute to more sustainable transport outcomes? Do such clusters have lower private transport mode shares than other parts of cities? How are mode shares changing for these clusters? How far do people travel to work in these clusters? Is there a relationship between job density, parking prices, and mode shares? How well served are these clusters by public transport? How do these clusters compare between cities?

This post investigates 46 existing clusters in Australia’s six largest cities. This is a longer post (there is a summary at the end), but I hope you find at least half as interesting as I do.

What’s a dense suburban employment cluster?

That’s always going to be an arbitrary matter. For my analysis, I’ve created clusters based on destination zones that had at least 40 employees per hectare in 2011 or 2016, were more than 4km from the city’s main CBD, and where collectively at least around 6,000 employees travelled on census day in 2016.

Unfortunately I can only work with the destination zone boundaries which may or may not tightly wrap around dense employment areas. Also, in order to ensure reasonable comparisons between census years, I’ve had to add in some otherwise non-qualifying zones to keep the footprints fairly similar. To mitigate potential issues with low density zones being included, I’ve used weighted employment density for each cluster in my analysis. But still, please don’t get too excited by differences in weighted job density as it’s far from a perfect representation of reality.

In particular, the following clusters include destination zones comprising both dense employment and non-employment land and so will potentially have understated weighted job density:

  • Nedlands
  • Fremantle
  • Bedford Park
  • Tooronga
  • Camberwell Junction
  • Hawthorn
  • Belconnen
  • Campbelltown
  • Hurstville
  • Kogarah
  • Randwick
  • North Ryde (quite significant – actual density is probably double)
  • Macquarie Park (a destination zone for the university includes large green areas)
  • Rhodes (significant residential area)
  • Parramatta (includes parkland)
  • Penrith (residential areas)
  • Bella Vista – Norwest – Castle Hill (includes a golf course)

Some of these clusters are a little long and thin and so are literally stretching things a little (eg Bella Vista – Norwest – Castle Hill, and Alexandria – Mascot), but it’s hard to cleanly break up these areas.

I think my criteria is a fairly low threshold for suburban employment clusters, but raising the criteria too much would knock out a lot of clusters. I should note that some potential clusters might be excluded simply because they did not contain small destination zones concentrated on more dense areas.

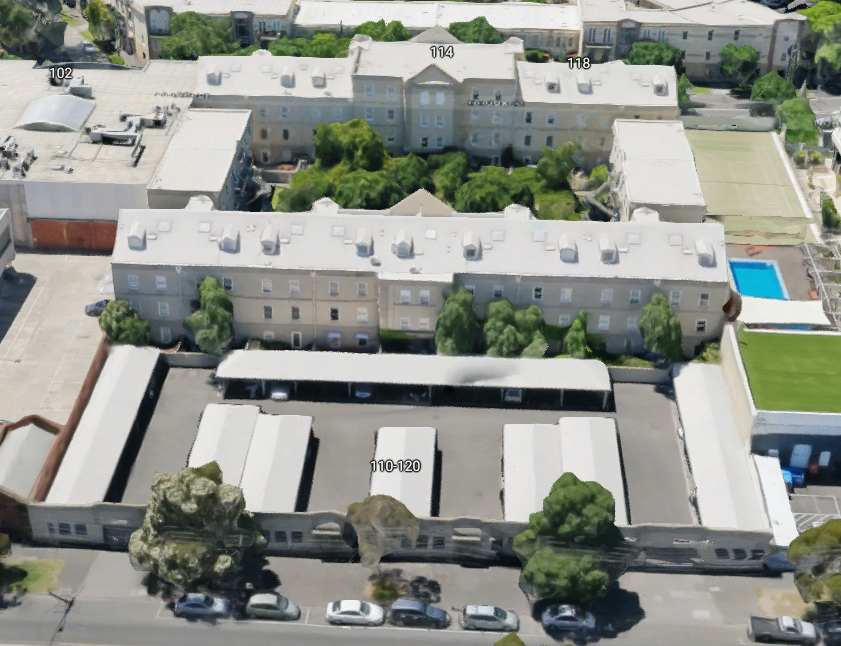
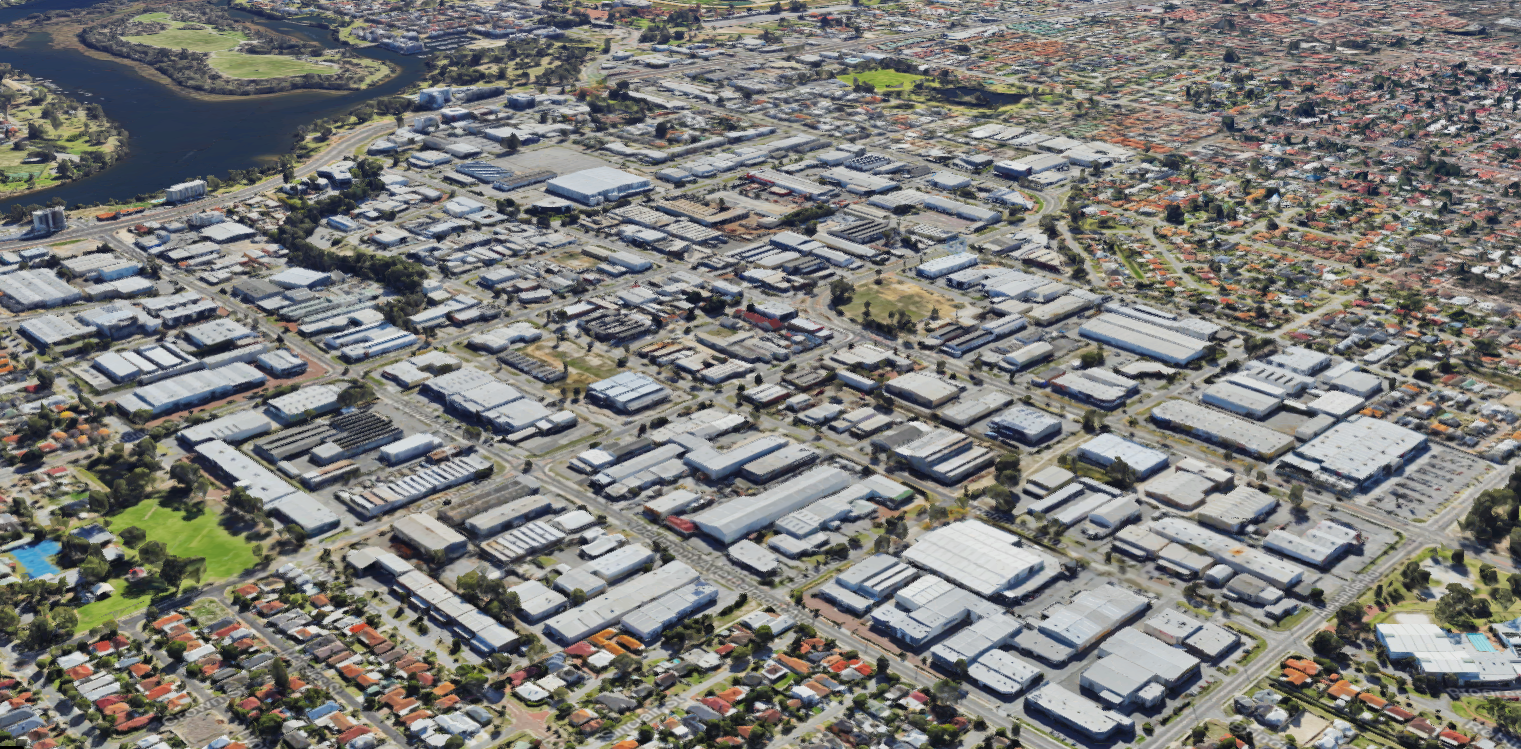
Belmont in Perth was the lowest density cluster to qualify (weighted jobs density of 42 jobs / ha). Here’s what it looks like (in 3D Google Maps in 2018):

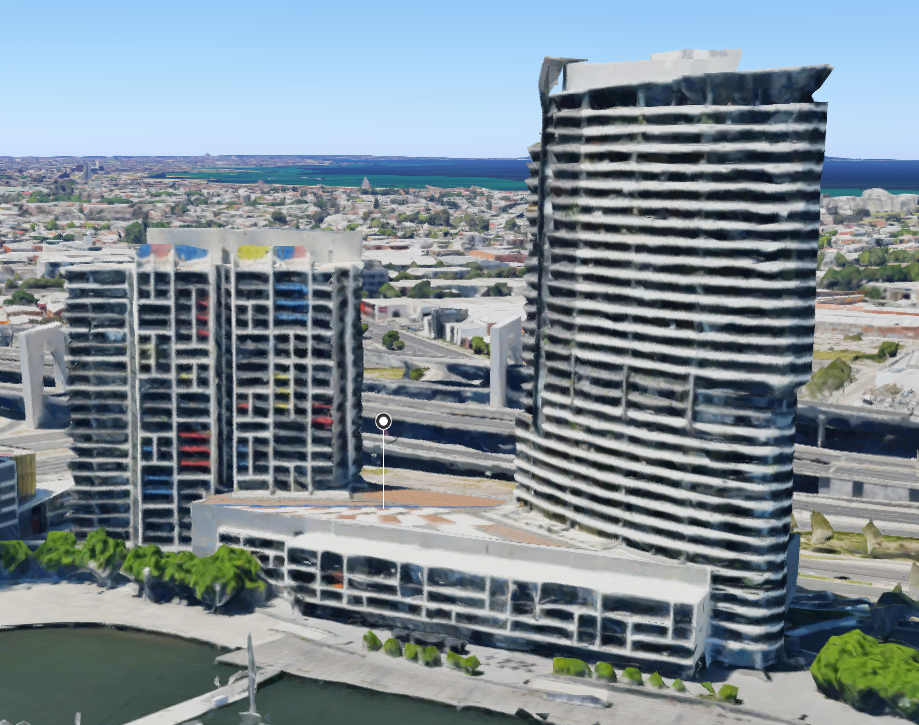
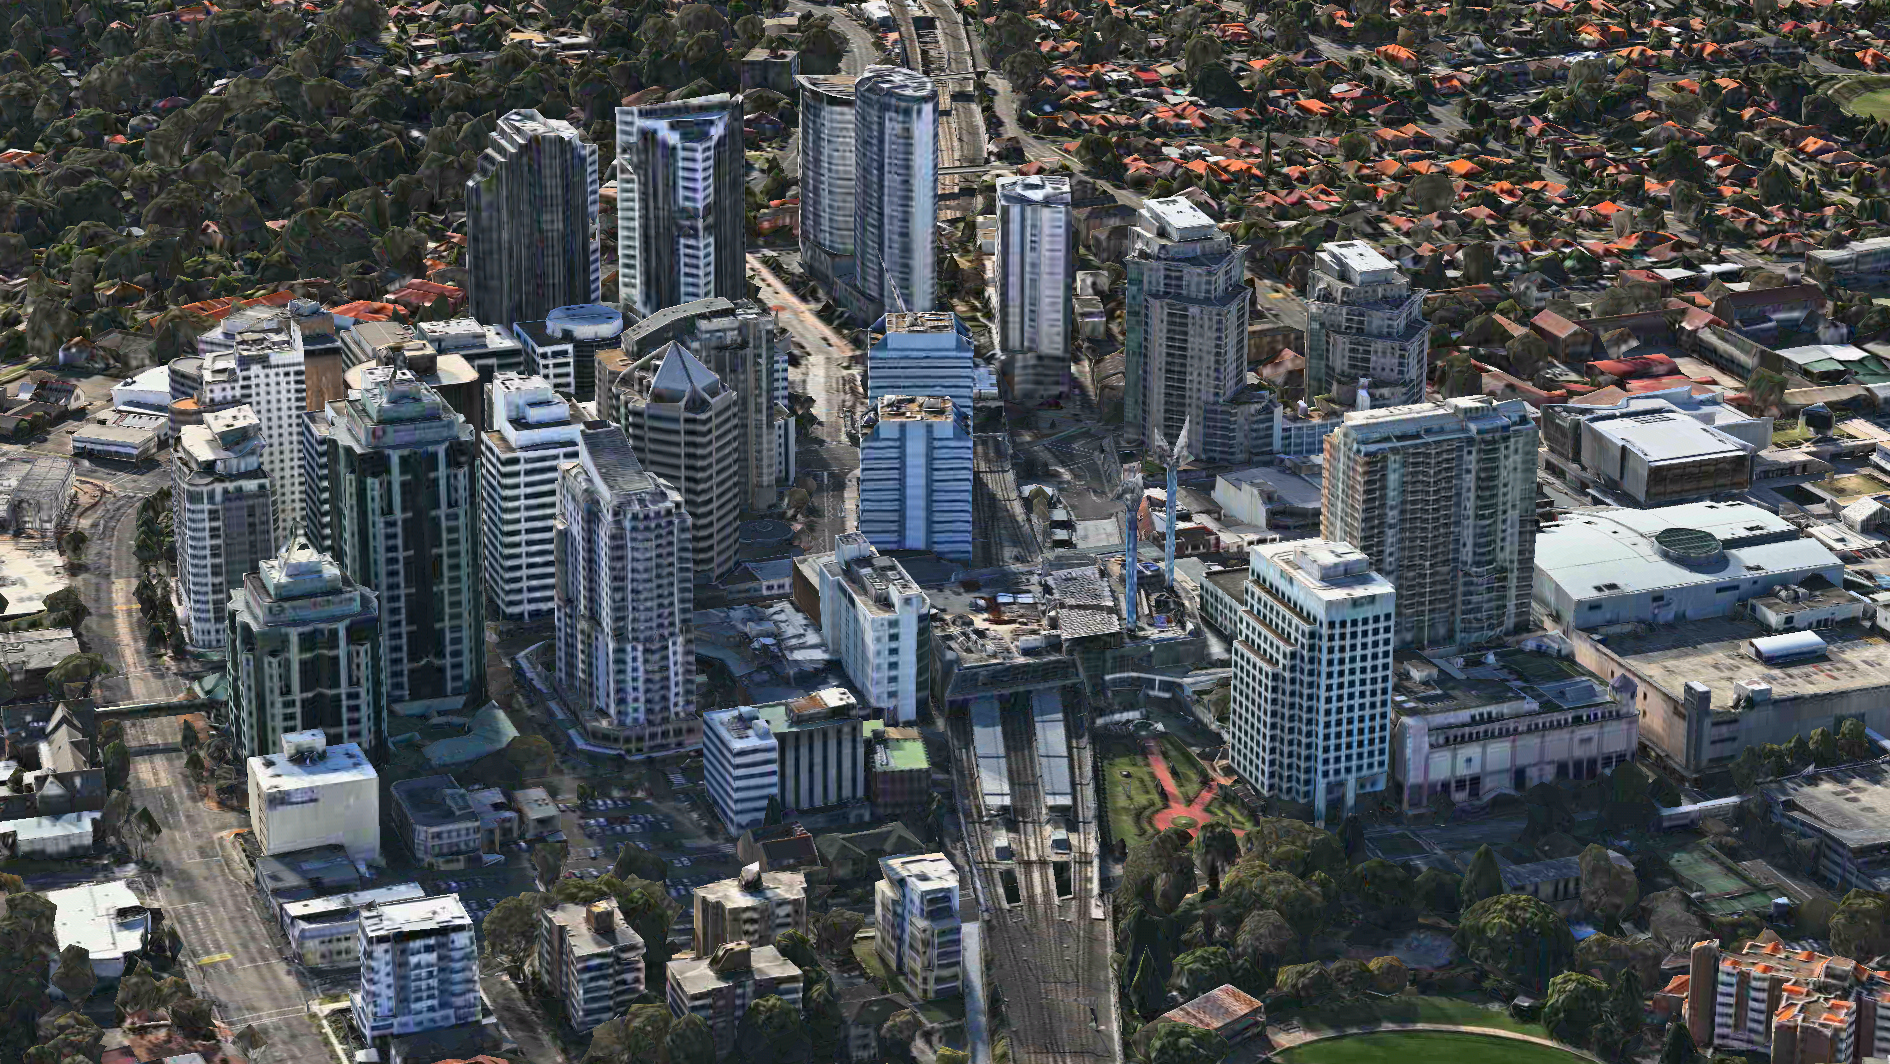
Chatswood in Sydney was the highest density cluster – with a weighted job density of 433 jobs / ha. Here’s what it looks like (in 3D Apple Maps in 2018):

Apologies if your favourite cluster didn’t make the criteria, or you don’t like my boundaries. You can look up the 2016 boundaries for each cluster here, or view them all through Google maps.

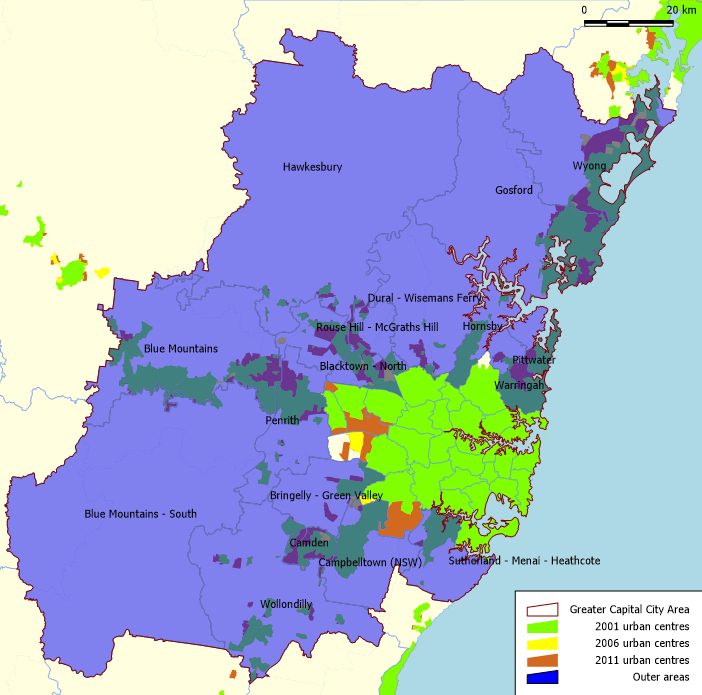
Where are these clusters?

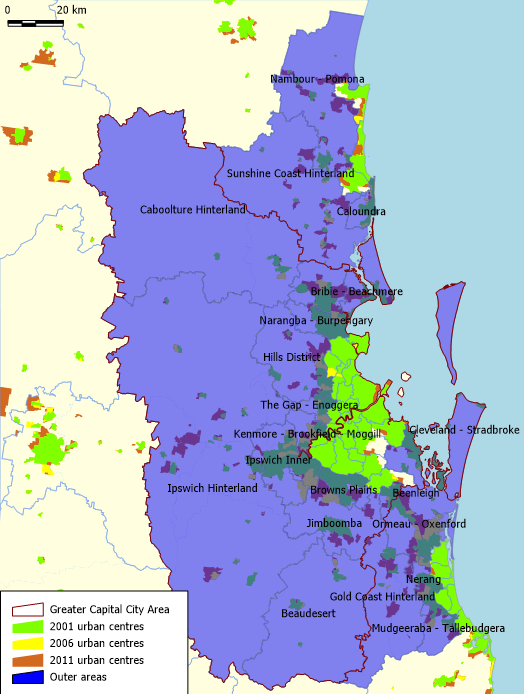
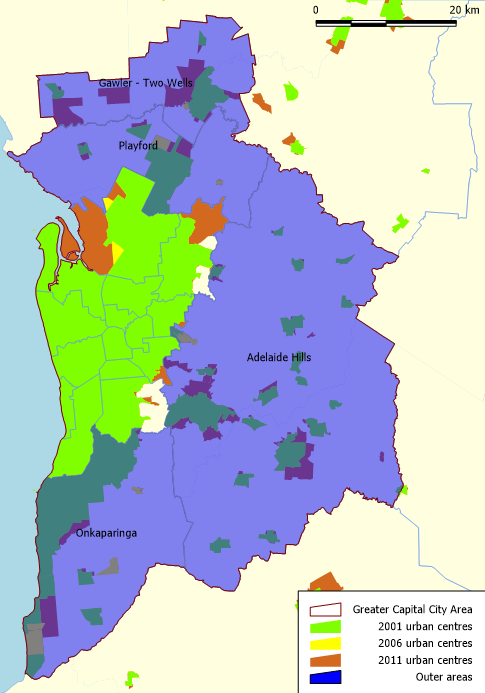
On the following maps I’ve scaled the clusters by employment size and used pie charts to show the modal split for journeys to work in 2016. All pie charts are to the same scale across the maps (the size of the pie charts is proportional to the number of journeys to the cluster in 2016).

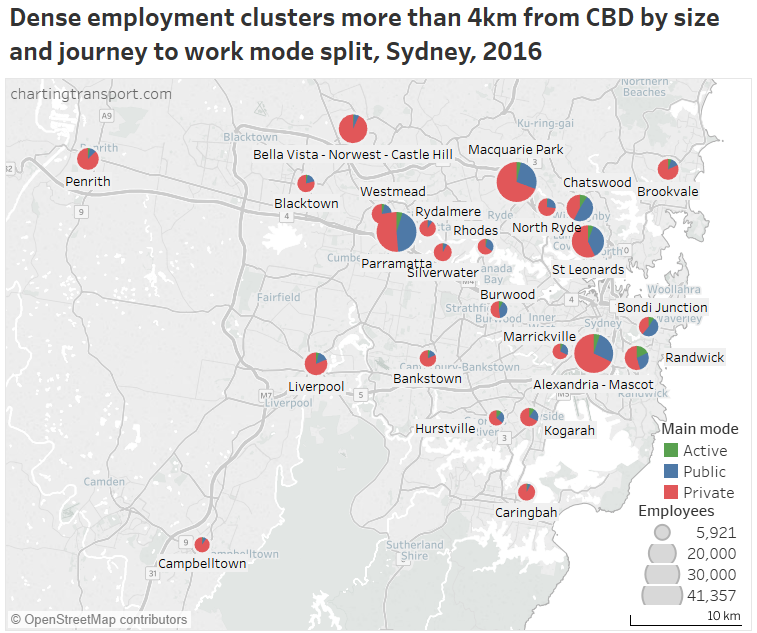
Note that North Sydney is excluded because it is within 4 km of the CBD.

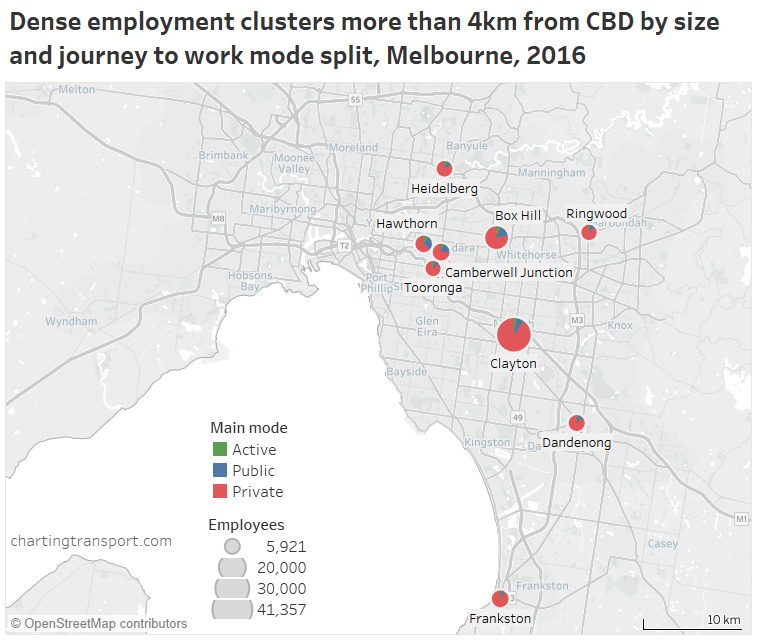
All of Melbourne’s clusters are east of the CBD, with Clayton the largest. Places just missing out on the cluster criteria include parts of the Tullamarine industrial area (5271 jobs at 55 jobs/ha), Doncaster (around 5000 jobs at 40+ jobs/ha), Chadstone Shopping Centre (5375 jobs at 105 jobs/ha), and La Trobe (around 7700 jobs but low density – and even if there was a destination zone tightly surrounding the university campus I suspect it would still not qualify on density ground).

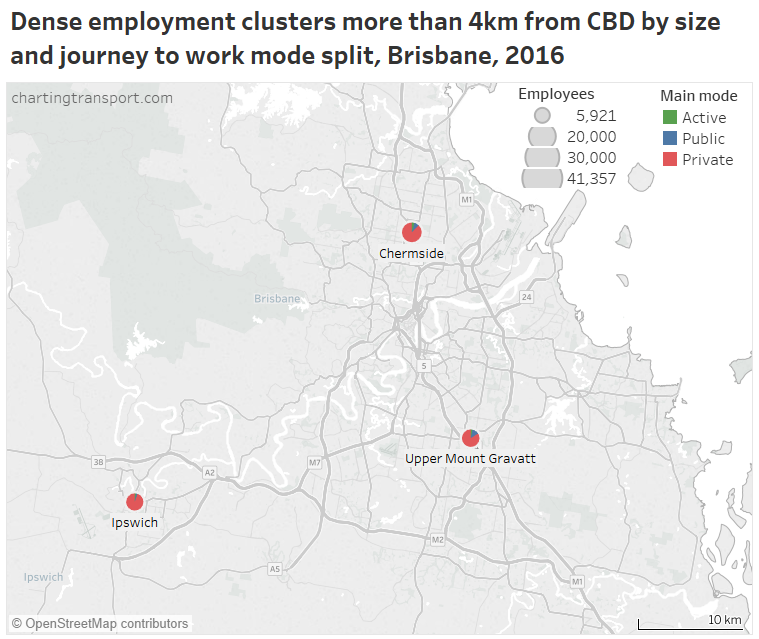
Only three suburban clusters qualified in Brisbane.

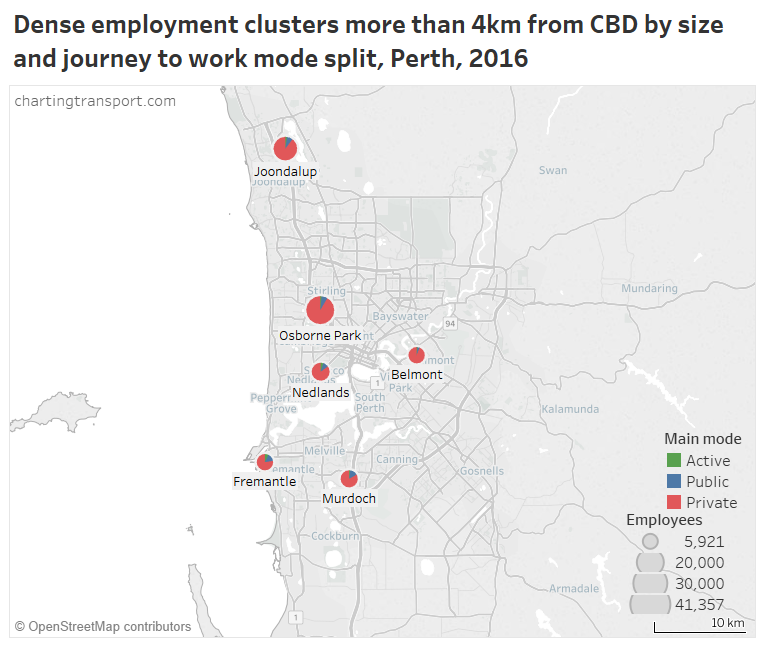
Note: the Nedlands and Murdoch clusters are essentially the hospital precincts only and do not include the adjacent university campuses.

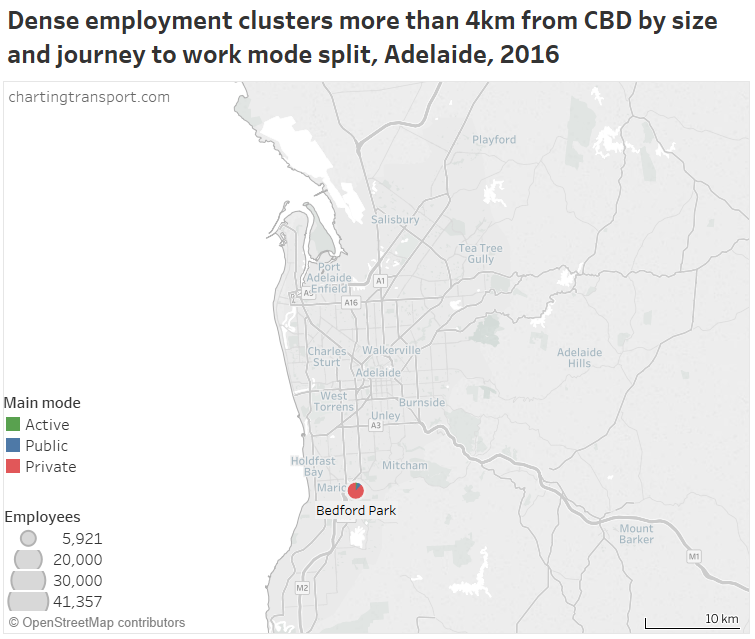
Adelaide only has one suburban cluster that qualifies – Bedford Park – which includes the Flinders University campus and Flinders Medical Centre.

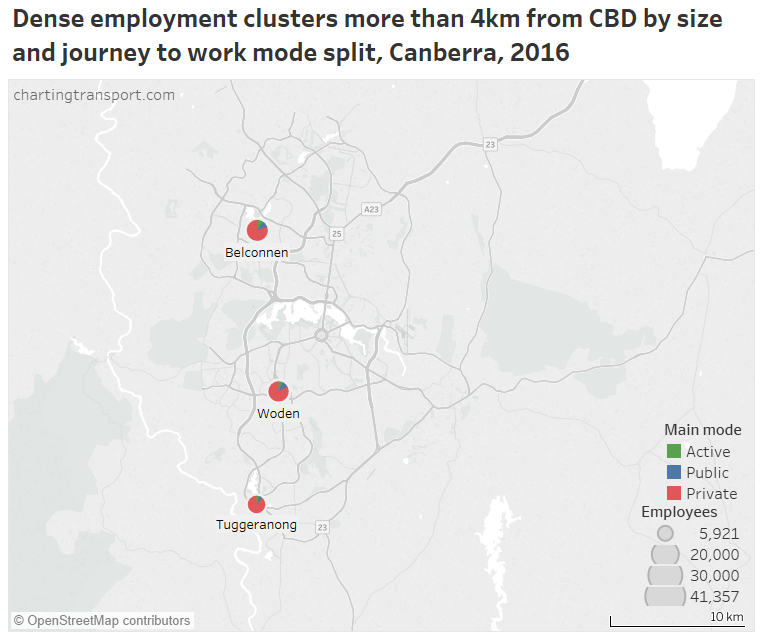
The Canberra clusters cover the three largest town centres, each containing at least one major federal government department head office.

What proportion of jobs are in these dense suburban employment clusters?

The following chart shows that Sydney and Canberra have been most successful at locating jobs in suburban employment clusters (well, clusters that meet my arbitrary criteria anyway!):

The proportion of jobs not in the inner 4km or a suburban employment cluster increased between 2011 and 2016 in all cities except Sydney (although the shift was very small in Melbourne).

Here’s a summary of private transport mode shares for the clusters, versus the inner city versus everywhere else:

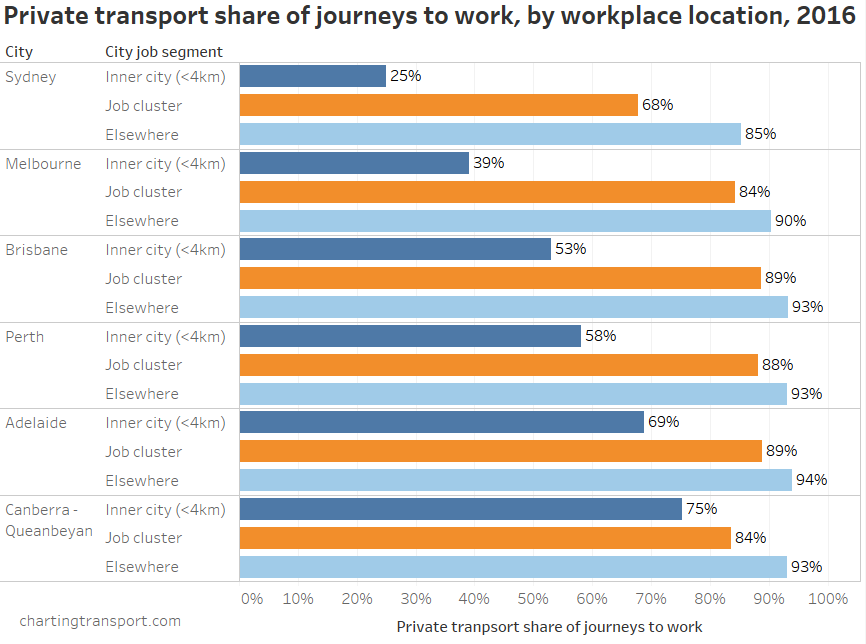
Inner city mode shares vary considerably between cities, in order of population size. Total job cluster private mode shares are only 4-7% lower than elsewhere in most cities, except for Sydney where they are 17% lower.

Sydney’s clusters combined also have a significantly lower private mode share of 68% – compared to 84-89% in other cities.

How do the clusters compare?

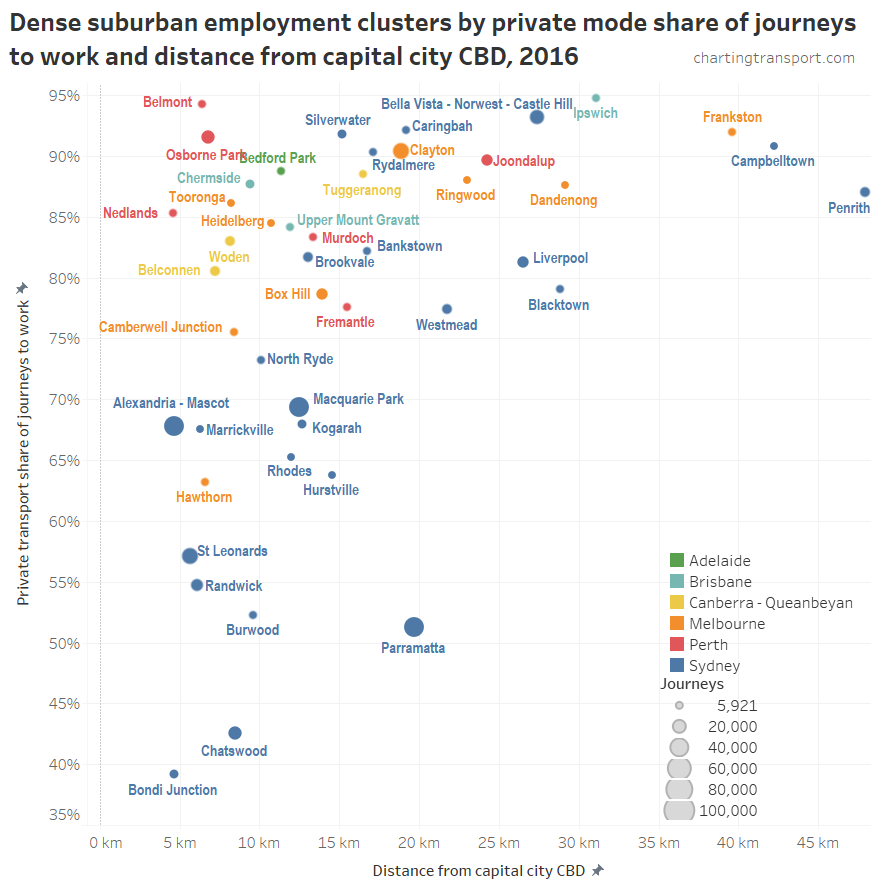
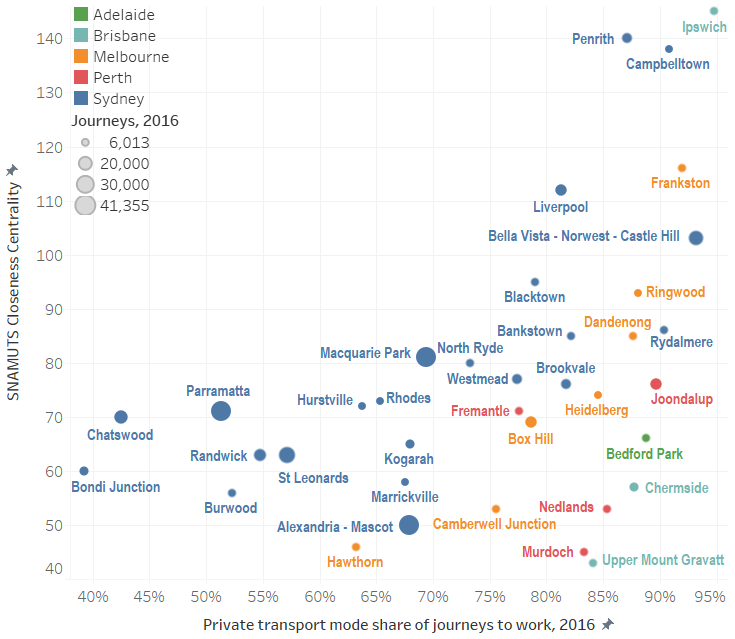
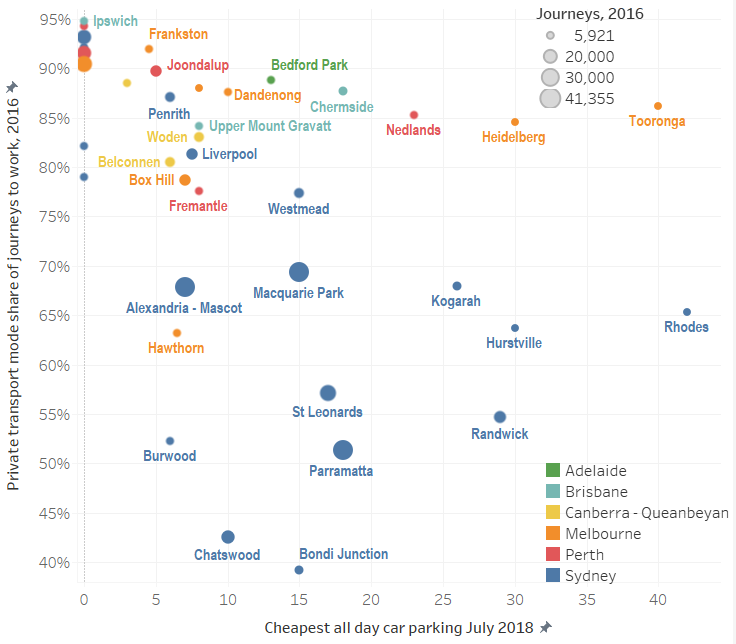
Here is a chart showing their size, distance from CBD, and private transport mode share for journeys to work in 2016:

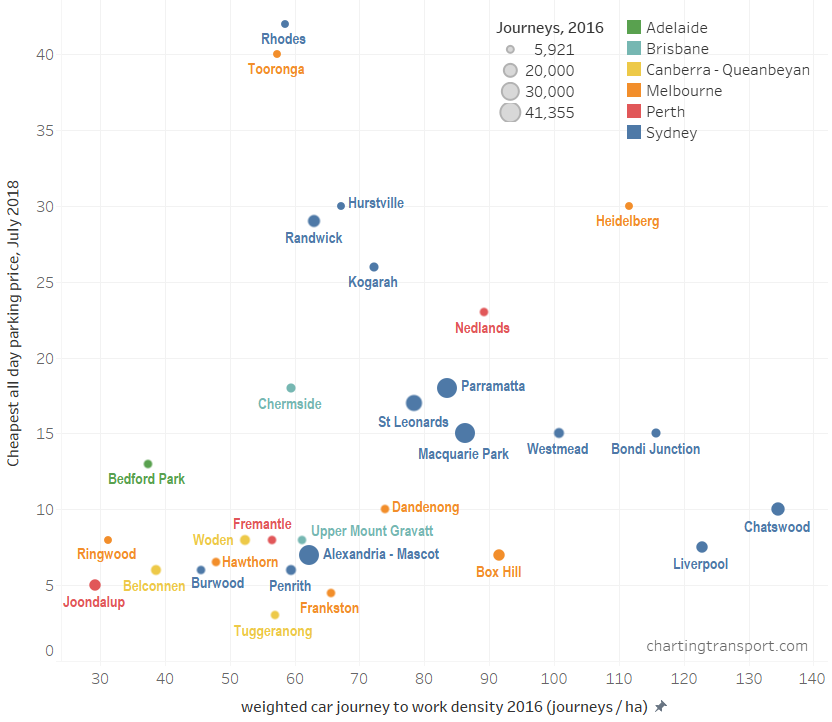
Next is a chart that looks at weighted job density, size, and private mode share for 2016. Note I’ve used a log scale on the X axis.

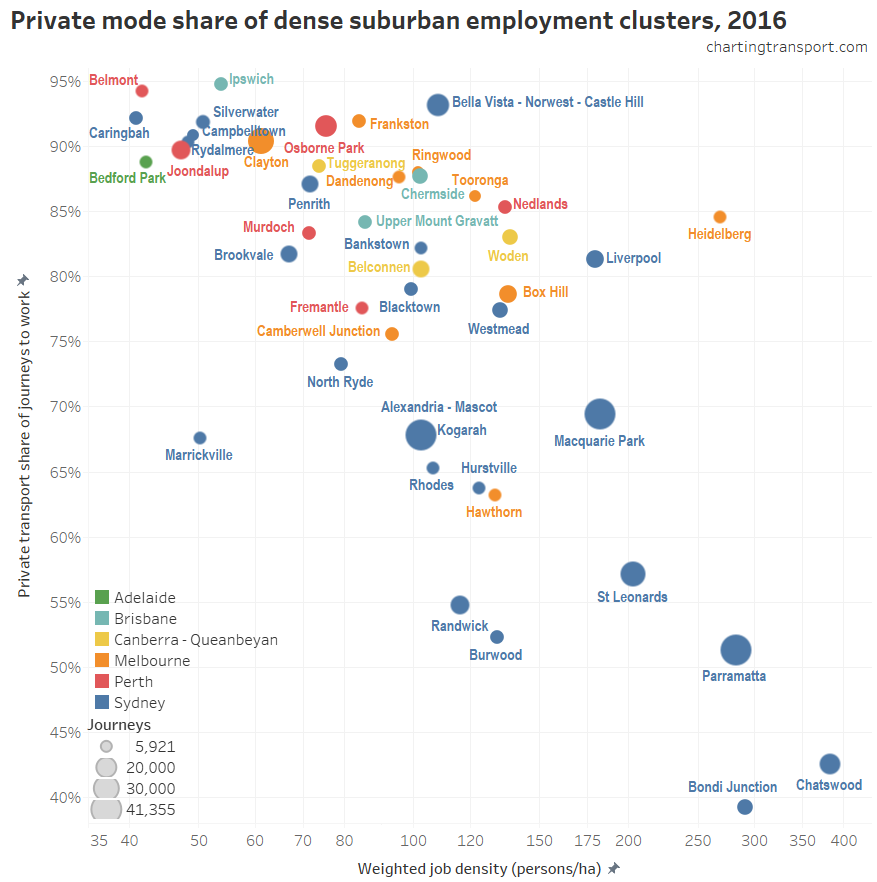
(Unfortunately the smaller Kogarah dot is entirely obscured by the larger Alexandria – Mascot dot – sorry that’s just how the data falls)

There is certainly a strong relationship between weighted job density and private mode shares (in fact this is the strongest of all relationships I’ve tested).

Sydney has many more clusters than the other cities (even Melbourne which has a similar population), it has much larger clusters, it has more dense clusters, and accounts for most of the clusters in the bottom-right of the chart.

And there’s just nothing like Parramatta in any other city. It’s large (~41,000 jobs in 2016), has relatively low private transport mode share (51%), is about 20 km from the Sydney CBD, and has a high jobs density.

Melbourne’s Clayton has about three-quarters the jobs of Parramatta, is around the same distance from its CBD, but is much less dense and has 90% private mode share for journeys to work.

Curiously Sydney’s Macquarie Park – which on my boundaries has about the same number of jobs as Parramatta – is closer to the Sydney CBD and has a much higher private transport mode share and a lower job density. However it’s rail service is relatively new, opening in 2009.

Perth’s Joondalup and Murdoch are relatively young transit oriented developments with relatively new train stations (opening 1992 and 2007 respectively), however they also have very high private transport mode shares, which I think highlights the challenge of creating suburban transit-adjacent employments clusters surrounded by low density suburbia.

Also, many of Sydney’s suburban clusters have a lower private mode share than that of the overall city (67.6%). That’s only true of Hawthorn and Camberwell Junction in Melbourne, Fremantle in Perth, and Woden and Belconnen in Canberra.

Some outliers to the top-right of the second chart include Heidelberg (in Melbourne), Liverpool (in Sydney), and Nedlands (in Perth). The Heidelberg and Nedlands clusters are relatively small and are dominated by hospitals, while 37% of jobs in Liverpool are in “health care and social assistance”. Hospitals employ many shift workers, who need to travel at times when public transport is less frequent or non-existent which probably explains their relatively high private transport mode shares. Heidelberg is located on a train line, and is also served by several relatively frequent bus routes, including one “SmartBus” route, but still has a very high private transport mode share of 85%.

Outliers to the bottom-left of the second chart include Randwick, Burwood, and Marrickville (all in Sydney). While these are less dense clusters, I suspect their relatively low private transport mode shares are because they are relatively inner city locations well served by public transport.

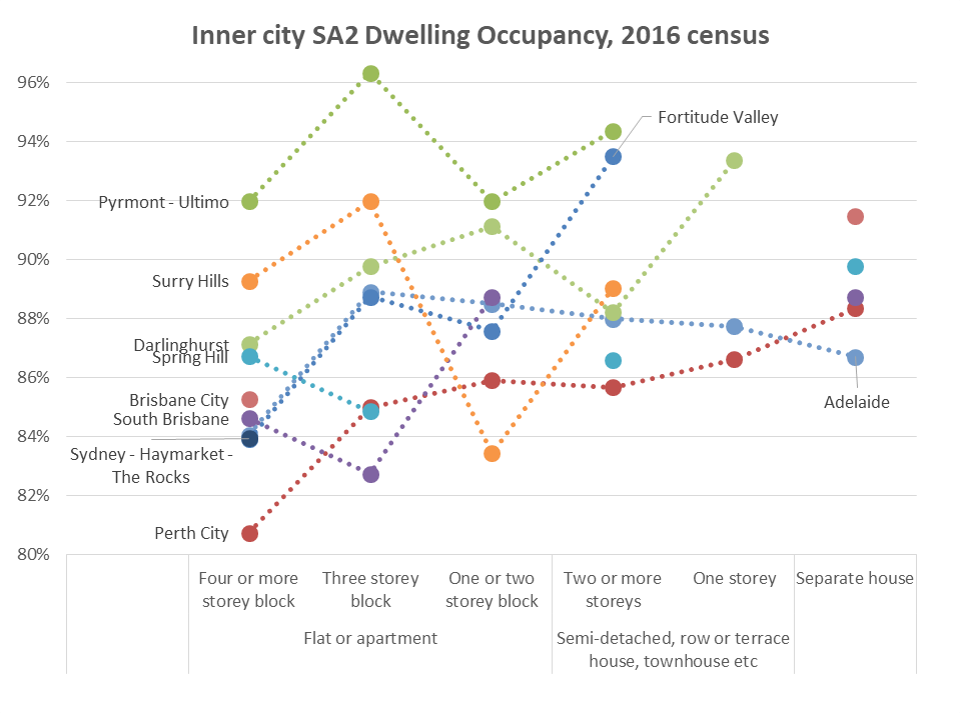
As an aside, if you were wondering about the relationship between job density and private mode shares for inner city areas, I think this chart is fairly convincing:

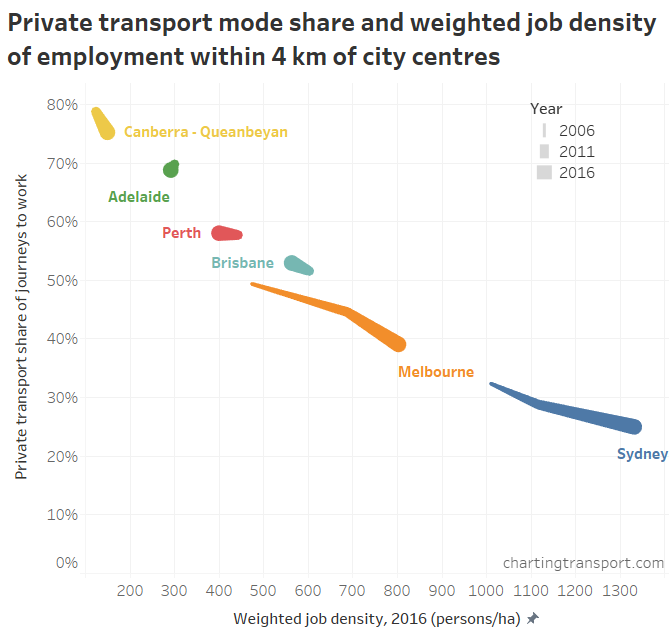
Of course this is not to say if you simply increase job density you’ll magically grow public transport patronage – there has to be capacity and service quality, and you probably won’t get the density increase without better public transport anyway.

How well connected are these job clusters to public transport?

Arguably the presence of rapid public transport is critical to enabling high public transport mode shares, as only rapid services can be time competitive with private transport. By “rapid” I consider services that are mostly separated from traffic, have long stop spacing, and therefore faster average speeds. For Australian cities this is mostly trains, but also some busways and light rail lines (but none of the clusters are served by what I would call “rapid” light rail). Of course there is a spectrum of speeds, including many partly separated tram and bus routes, and limited stops or express bus routes, but these often aren’t time competitive with private cars (they can however compete with parking costs).

I have classified each cluster by their access to rapid transit stations, with trains trumping busways (note Parramatta, Blacktown, Westmead, and Liverpool have both), and some clusters sub-classified as “edge” where only some edge areas of the cluster are within walking distance of a rapid transit station (although that’s not clear cut, eg Murdoch). Here are the public transport mode shares, split by whether journeys involved trains or not:

It’s probably of little surprise that all of the high public transport mode share centres are on train lines (except Randwick), and that most public transport journeys to these clusters involve trains. However the presence of a train station certainly does not guarantee higher public transport mode share.

Only four clusters have some degree of busway access (Chermside and Randwick are not actually on a busway but have a major line to them that uses a busway). Only Upper Mount Gravatt has a central busway stations, and it has the third highest non-train (read: bus) access share of 12%.

Randwick is an interesting exception – the University of New South Wales campus in this cluster is connected to Central (train) Station by high frequency express bus services which seem to win considerable mode share. A light rail connection is being constructed between Randwick and the Sydney CBD.

Non-rail (essentially bus) public transport mode shares are also relatively high in Bondi Junction (15%), Parramatta (11%), Belconnen (10%), Brookvale (10%), Woden (10%), Fremantle (9%), Macquarie Park (9%). These are all relatively strong bus nodes in their city’s networks.

Clayton and Nedlands are not on rapid transit lines, but both have high frequency bus services to nearby train stations which results in slightly higher train mode shares (4% and 5%). For Clayton, only the Monash University campus is connected by a high frequency express bus and it had a 17% public transport mode share, whereas the rest of the cluster had public transport mode shares varying between 3 and 7%.

The Bedford Park cluster is frustratingly just beyond reasonable walking distance of Tonsley Railway Station (12 minutes walk to the hospitals and almost half an hour’s walk to the university campus) – so only about 10 people got to work in the cluster by train in 2016. However that’s going to change with an extension of the train line to the Flinders Medical Centre.

The train-centred clusters with low public transport mode shares are mostly not in Sydney, and/or towards outer extremities of the train network (except Box Hill and Heidelberg in Melbourne). So what is it about Sydney’s trains that makes such a difference?

Sydney’s train network is distinctly different to all other Australian cities in that there are many more points where lines intersect (outside the central city), creating many “loops” on the network (for want of a better expression). In all other cities, lines only generally intersect in the central city and where radial lines split into branches, and cross city trips by public transport generally only possible by buses (in mixed traffic). In Sydney lines do branch out then but then often bend around to intersect other neighbouring lines. This provides significantly more connectivity between stations. For example, you can get to Parramatta from most lines directly or with a single transfer somewhere outside central Sydney. Indeed, Sydney is the only city with a regular non-radial train service (T5 Leppington – Richmond, although it only runs every half-hour).

I’ve roughly overlaid Sydney’s dense suburban job clusters (in red) on its rail network map, and then marked the train mode shares:

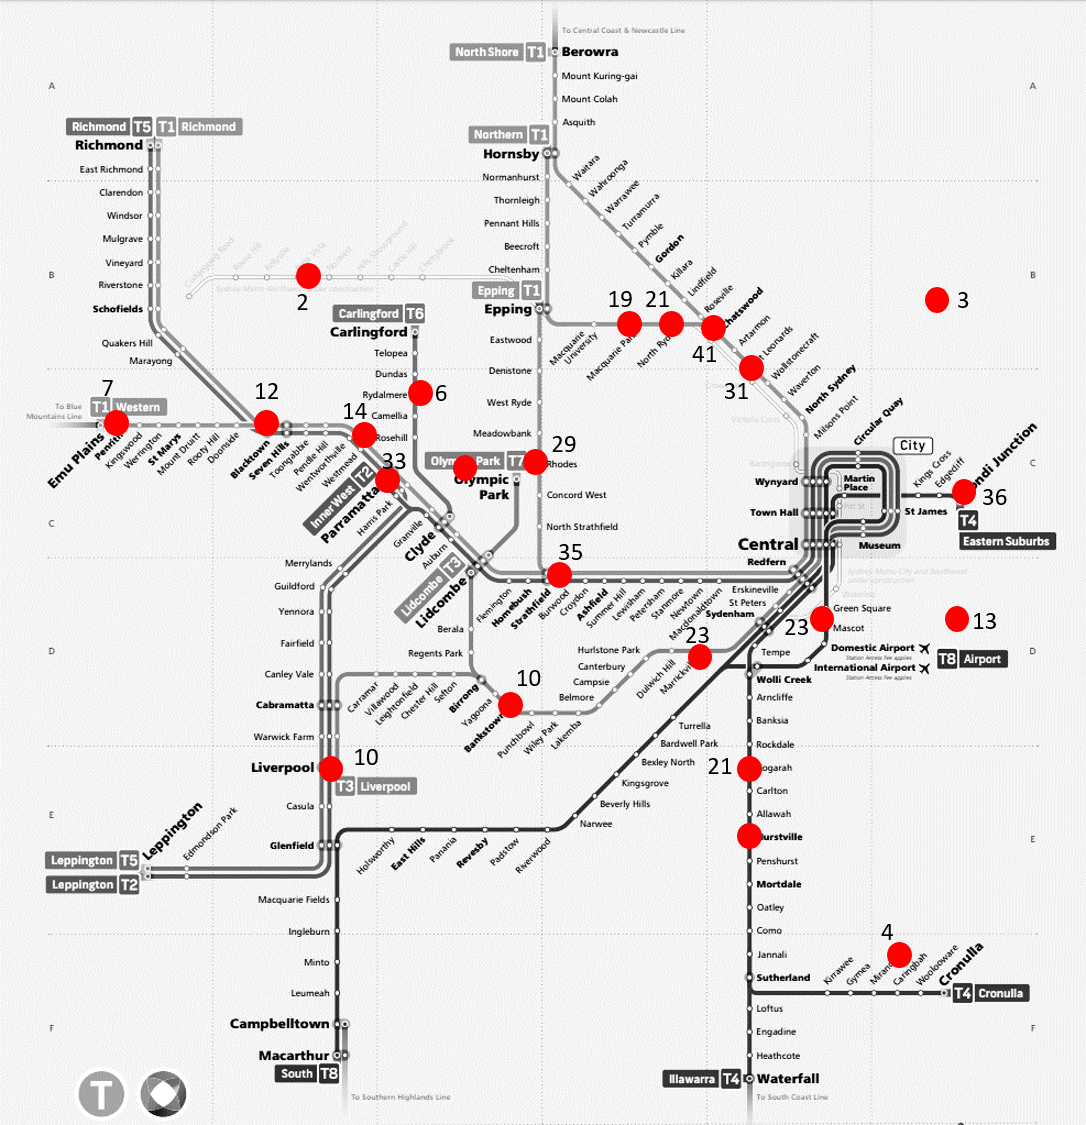
While some clusters can only be accessed by a radial train line (or are off-rail), many are at intersection points, and most can be accessed by multiple paths along the network. The 29%+ train mode shares for Chatswood, Parramatta, St Leonards, Burwood, and Rhodes might be partly explained by these being highly accessible on the train network.

Here are Melbourne’s dense suburban employment clusters and train mode shares overlaid on Victoria’s rail network map:

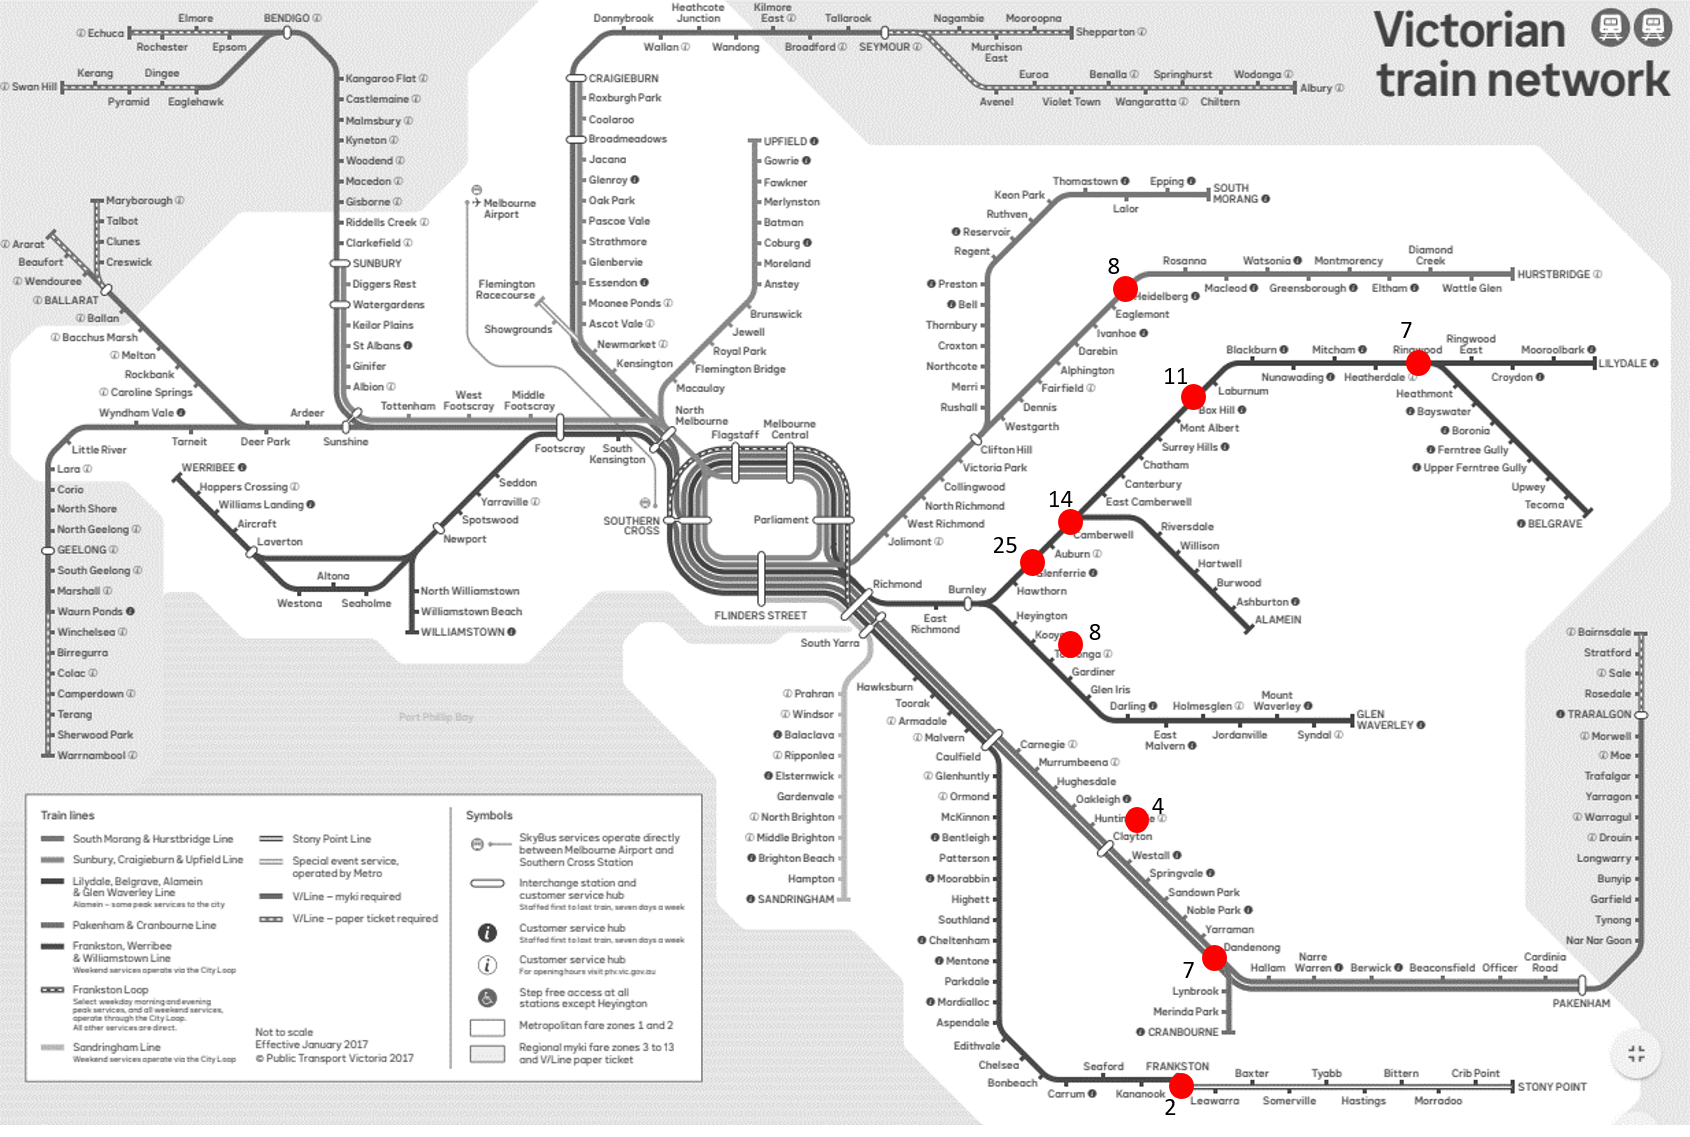
The clusters connected to more train lines (Hawthorn and Camberwell) have higher train mode shares, although they are also closer to the city.

The Spatial Network Analysis for Multimodal Urban Transport Systems (SNAMUTS) methodology (led by Professor Carey Curtis and Dr Jan Scheurer) uses graph-based analysis of public transport networks to develop several indicators of network performance. One indicator that measures network accessibility is closeness centrality, which looks and speed and frequency of services to connect to other nodes in the network (it actually uses inter-peak frequencies and speeds, but they probably correlate fairly well with services in peak periods). A lower score indicates better accessibility.

I’ve extracted the closeness centrality scores for public transport nodes in each employment clusters (from the nearest available data to 2016 at the time of writing, some as old as 2011 so not perfect) and compared this with private transport mode shares to these clusters:

Some clusters were not really centred on a public transport node in the SNAMUTS analysis (eg Osborne Park in Perth, Clayton in Melbourne) and hence are not included in this analysis. These clusters have very high private transport mode shares, and would likely be towards the top right of the chart.

There’s clearly a relationship between the closeness centrality and private mode shares, with low private more shares only occurring where there is high accessibility by public transport. But it’s not super-strong, so there are other factors at play.

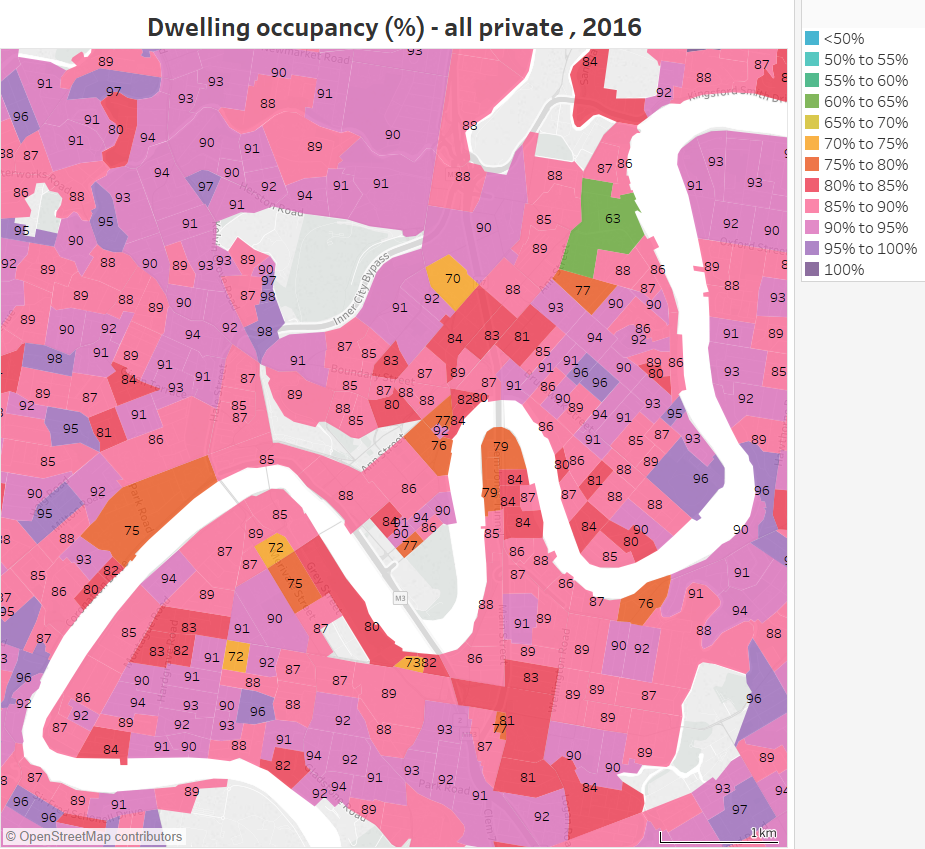
Some of the outliers in the bottom right of the distribution include Upper Mount Gravatt (based on a large shopping centre but also on a busway), Murdoch (dominated by hospitals a moderate walk from the station), Nedlands (also dominated by hospitals), Chermside (a combination of hospital and large shopping centre, with the bus interchange remote from the hospital), and Bedford Park (where 63% of jobs are in health) . Again, the pattern of higher private transport mode shares to hospitals is evident.

So do you need strong public transport access to support higher job densities? Here’s the relationship between closeness centrality and weighted job density:

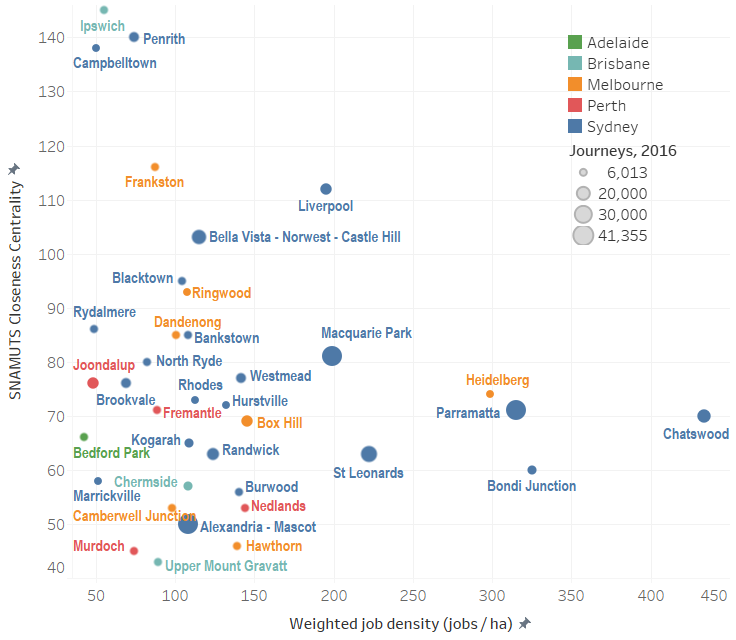
There are no clusters with poor public transport access and high job density, which is not surprising. But this does suggest it could be difficult to significantly increase job densities in clusters currently in the top left of this chart without significantly improving public transport access.

Interestingly, Box Hill in Melbourne does have a similar closeness centrality score to Parramatta and Chatswood in Sydney, suggesting it might be able to support significantly higher job density. However, it only has rapid (train) public transport from two directions. It might be more challenging to maintain bus and tram travel times from other directions if there is significant jobs growth.

Melbourne’s largest cluster – Clayton – is not on the chart because it is not centred on a public transport node. There is however a bus interchange on the southern edge of the cluster at Monash University, which has a relatively low closeness centrality score of 64. I suspect the main employment area would probably have a higher closeness centrality score if it were to be measured because it not connected to the train network by a high frequency express shuttle service and has fewer bus routes. That would place it in the top-left part of the above chart (2016 weighted job density being 63 jobs/ha).

Do higher density clusters have fewer car parks?

The higher density centres certainly tended to have lower private mode shares, but does that mean they don’t have much car parking?

Well I don’t know how many car parking spaces each centre had, but I do know how many people travelled to work by car only, and from that I can calculate a density of car-only journeys (and I’ve calculated a weighted average of the destination zones in each centre). That’s probably a reasonable proxy for car park density.

Here’s how it compares to jobs density (note: log scales on both axes):

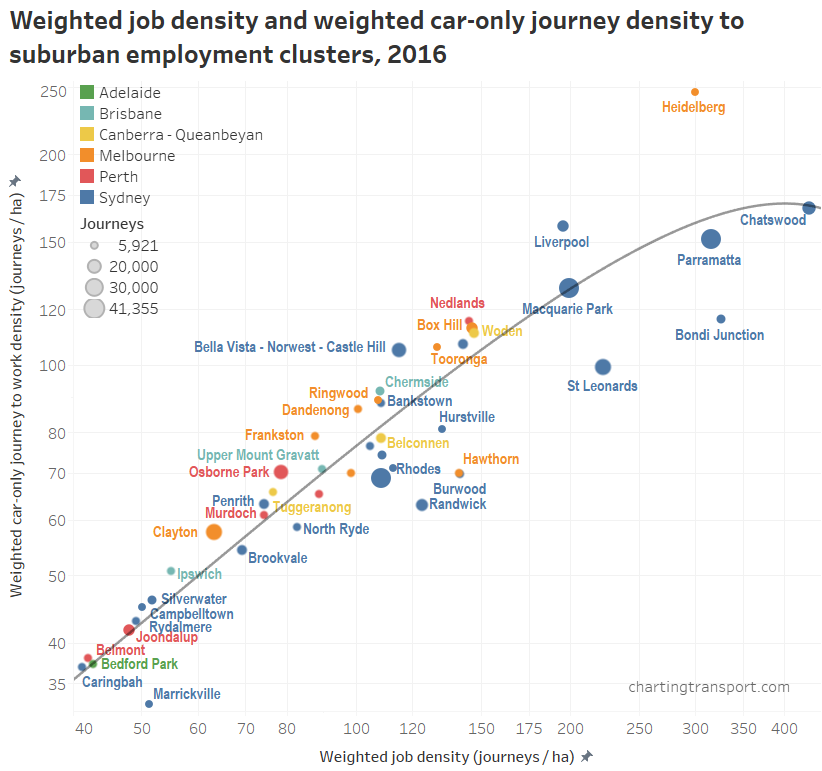
There is a very strong correlation between the two – in general centres with higher job density also have higher car density. The strongest correlation I can find is for a quadratic curve that flattens out at higher job densities (as drawn, with R-squared = 0.77), which simply suggests you get lower private mode shares in higher density clusters (in general).

The clusters on the bottom side of the curve have lower car mode shares, and so have a lower car density. Many are inner city locations with better public transport access, but also many nearby residents.

Heidelberg (a hospital-based cluster in Melbourne), has the highest car density of all centres and a high job density, but isn’t a large centre.

Do walking mode shares increase when there are many nearby residents?

If there are many residents living within walking distance of a cluster, relative to the size of that cluster, then you might expect a higher walking mode share, as more employees of the cluster are likely to live nearby.

I’ve roughly summed the number of residents who travelled to work (anywhere) and lived within 1km of each cluster. I’ve then taken the ratio of those nearby working residents to the number of journeys into the cluster, and then compared that with walk-only mode shares for 2016:

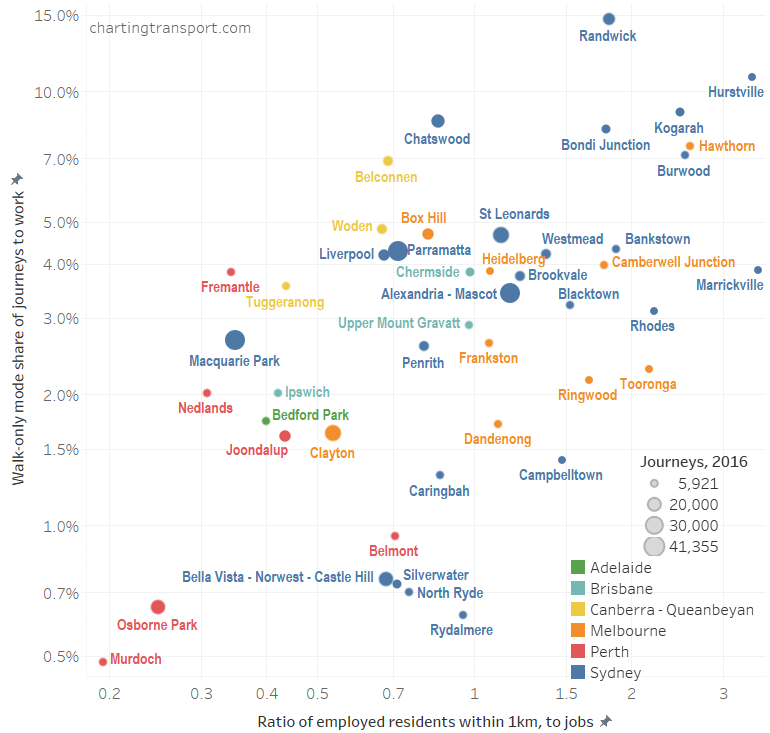
Yes, there’s definitely a relationship (although not strong), and this may explain some of the outliers in the previous charts such as Randwick, Marrickville, St Leonards and Bondi Junction.

Is there a relationship between parking costs and mode shares?

It’s quite difficult to definitively answer this question because I don’t have parking prices for 2016, and many car commuters might not be paying retail prices (eg employer-provided free or subsidised parking).

I’ve done a quick survey using Parkopedia of parking prices for parking 8:30 am to 5:30 pm on Monday 2 July 2018, and picked the best price available in each cluster. Of course not everyone will be able park in the cheapest car park so it’s certainly not an ideal measure. An average price might be a slightly better measure but that would be some work to calculate.

But for what it worth, here is the relationship between July 2018 all day parking prices and 2016 private transport mode shares:

You might expect an inverse correlation between the two. Certainly clusters with very cheap or free parking had very high private transport mode shares, but other centres are scattered in the distribution.

Looking at outliers in the top right: I suspect Bedford Park (63% health workers), Heidelberg (hospital precinct), Tooronga (with one major employer being the Coles HQ), Chermside (including Prince Charles Hospital), and Rhodes will have significantly cheaper parking for employees (with visitors paying the prices listed on Parkopedia). Indeed, I could not find many parking prices listed for Rhodes, but there are clearly multi-storey parking garages near the office towers not on Parkopedia.

Looking at outliers in the bottom left: Relatively cheap $15 parking is available at multiple car parks in Bondi Junction. The $10 price in Chatswood was only available at one car park, with higher prices at others, so it is probably below the average price paid. Maybe traffic congestion is enough of a disincentive to drive to work in these centres?

For interest, here’s the relationship between weighted car density and parking prices:

The relationship is again not very strong – I suspect other factors are at play such as unlisted employer provided car parking, as discussed above.

So does job growth in suburban employment clusters lead to lower overall private transport mode shares?

Here is a chart showing the effective private mode share of net new trips in each job cluster, plus the inner 4 km of each city:

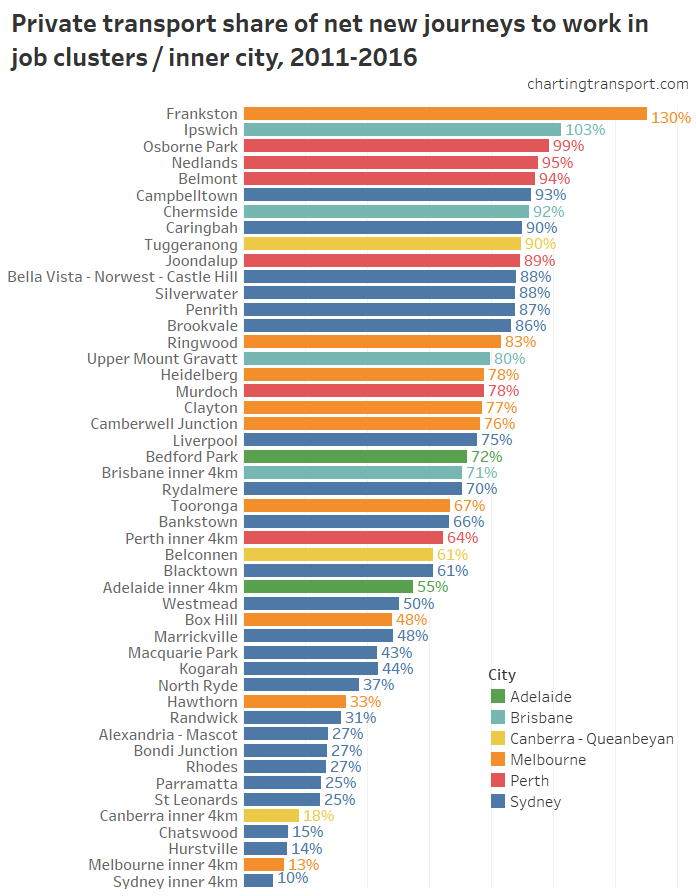
(Fremantle, Dandenong, Burwood, and Woden had a net decline in jobs between 2011 and 2016 and so have been excluded from this chart)

The chart shows that although many suburban jobs clusters had a low private mode share of net new trips, it was always higher than for the inner 4 km of that city.

Here’s a summary of net new trips for each city:

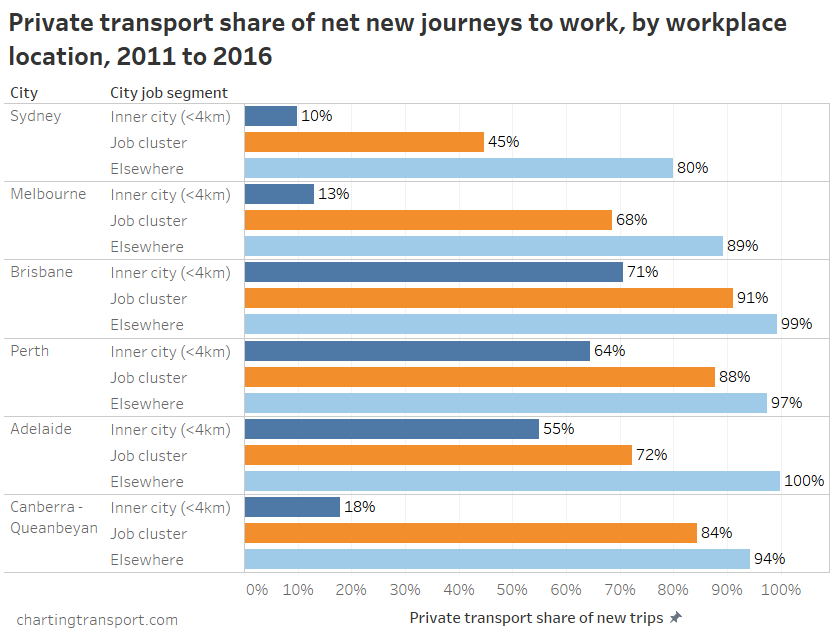
So every new 100 jobs in suburban employment clusters did generate many more private transport trips than new jobs in the inner city, particularly for Sydney (45 : 10), Melbourne (68 : 13), and Canberra (84: 18). But then new jobs in suburban employment clusters had significantly lower private transport mode shares than new jobs elsewhere in each city.

So arguably if you wanted to minimise new private transport journeys to work, you’d aim for a significant portion of your employment growth in the central city, and most of the rest in employment clusters (ideally clusters that have excellent access by rapid public transport). Of course you would also want to ensure your central city and employment clusters were accessible by high quality / rapid public transport links (not to forget active transport links for shorter distance commutes).

One argument for growing jobs in suburban employment clusters is that new public transport trips to suburban employment clusters will often be on less congested sections of the public transport network – particularly on train networks (some would even involve contra-peak travel relative to central city). On the other hand, new jobs in the central city have much higher public transport mode shares, but relatively expensive capacity upgrades may be required to facilitate the growth.

New active transport trips to the central city and employment clusters probably requires the least in terms of new infrastructure, and there are probably very few congested commuter cycleways in Australian cities at present.

Another argument for suburban employment clusters is to bring jobs closer to people living in the outer suburbs.

Are new private transport trips to suburban employment clusters much shorter than new private transport trips to the central city, and therefore perhaps not as bad from a congestion / emissions point of view?

Certainly many of these clusters will have congested roads in peak periods, but the distance question is worth investigating.

So how far do people travel to work in different employment clusters?

The 2016 census journey to work data now includes on-road commuting distances (thanks ABS!).

Of course for any jobs cluster there will be a range of people making shorter and longer distance trips and it is difficult to summarise the distribution in one statistic. Averages are not great because they are skewed by a small number of very long distance commutes. For the want of something better, I’ve calculated medians, and here are calculations for Sydney job clusters:

(I’ve added a “Sydney” jobs cluster which is the “Sydney – Haymarket – The Rocks” SA2 that covers the CBD area).

There’s a lot going on in this data:

  • Median distances for private transport commutes to most employment clusters are longer than to the CBD (particularly the big clusters of Macquarie Park and Parramatta).
  • The clusters of Brookvale, Bondi Junction, and Randwick near the east coast have lower medians for motorised modes, probably reflecting smaller catchments. Randwick and Brookvale also do not have rail access, which might explain their low median public transport commute distances.
  • Public transport median commute distances were longer in the rail-based near-CBD clusters of Bondi Junction, Alexandria – Mascot, and St Leonards, but also in some further out rail-based clusters, including Parramatta, Westmead and Penrith.
  • Penrith – the cluster furthest from the Sydney CBD – curiously had the longer public transport median commute distance, which probably reflects good access from longer distance rail services (but public transport mode share was only 14%).
  • Active transport medians vary considerably, and this might be impacted by the mix of shorter walking and longer cycling trips. For example, North Ryde saw more cycling than walking trips, but also had only 1% active transport mode share.

Here’s the same for Melbourne (with a cluster created for the CBD):

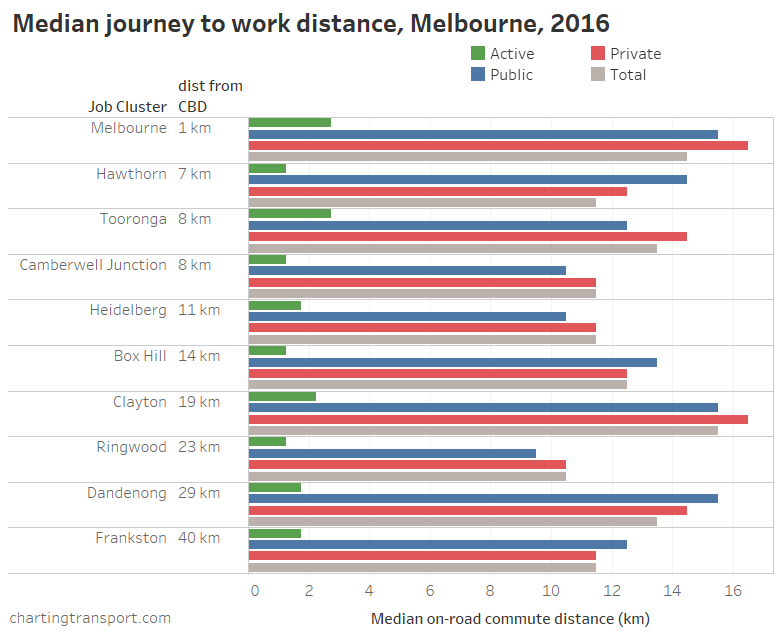
Clayton, Dandenong, and Melbourne CBD median commute distances were very similar, whereas median commutes to other clusters were mostly shorter.

Here are results for clusters in the smaller cities:

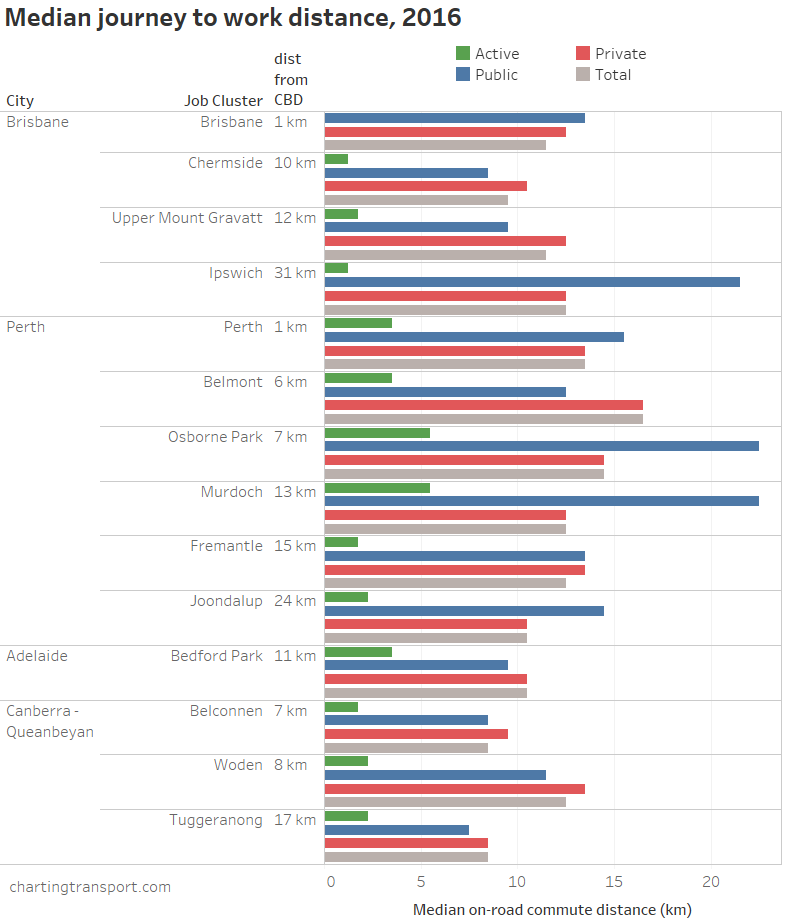
In Perth, Joondalup had shorter median commuter distances, while Osborne Park and Murdoch (both near rapid train lines) had the longest median public transport journey distances (but not very high public transport mode shares: 7% and 15% respectively). Half of the suburban clusters had a longer median private transport distance than the CBD, and half were shorter.

In Brisbane, median private commute distances were shorter in Chermside, but similar to the city centre for other clusters.

Coming back to our question, only some suburban employment clusters have shorter median private transport commute distances. I expect the slightly shorter distances for those clusters would not cancel out the much higher private transport mode shares, and therefore new suburban cluster jobs would be generating more vehicle kms than new central city jobs.

But perhaps what matters more is the distance travelled by new commuters. New trips from the growing urban fringe to a CBD would be very long in all cities. While ABS haven’t provided detailed journey distance data for 2011, some imperfect analysis of 2011 and 2016 straight line commuter distances between SA2s (sorry not good enough to present in detail) suggests average commuter distances are increasing by 1-2 kms across Sydney and 2-3 kms across Melbourne, and these increases are fairly consistent across the city (including the central city). This may reflect urban sprawl (stronger in Melbourne than Sydney), with new residents on the urban fringe a long way from most jobs.

So did private transport mode shares reduce in suburban employment clusters?

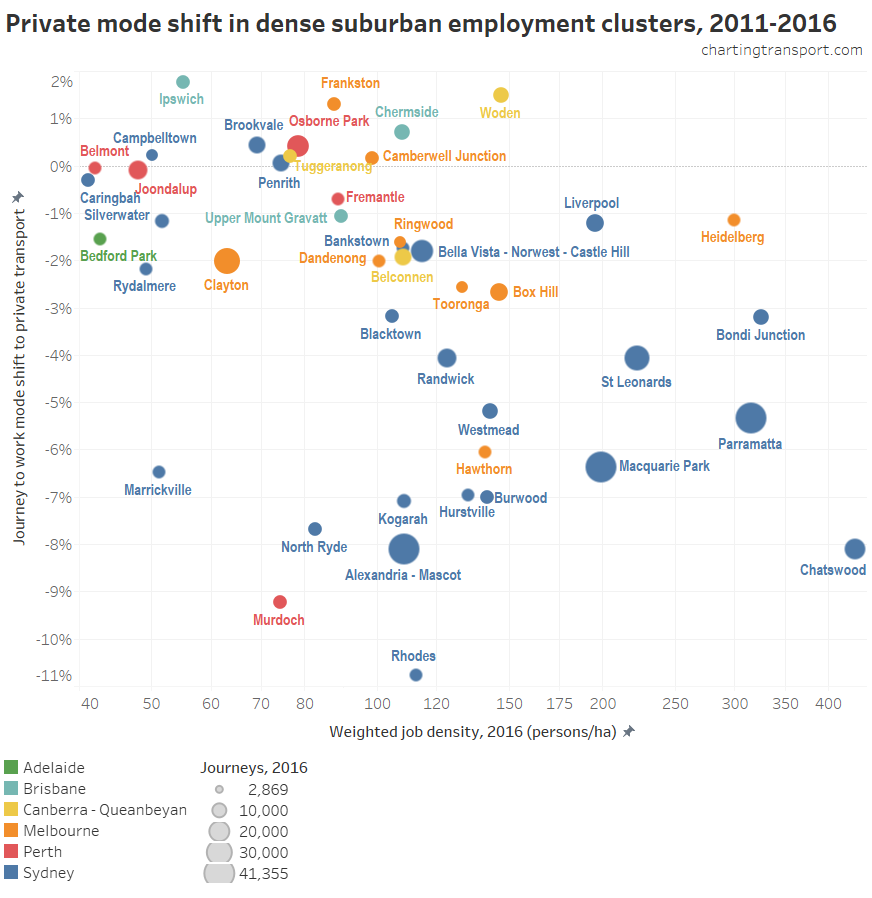
Yes, they did reduce in most clusters, but some saw an increase of up to 2%.

The cluster with the biggest shift away from private transport was Rhodes in Sydney (relatively small and only moderately dense), followed by Perth’s fastest growing hospital cluster of Murdoch.

But perhaps more relevant is how fast each cluster is growing and the mode share of new jobs:

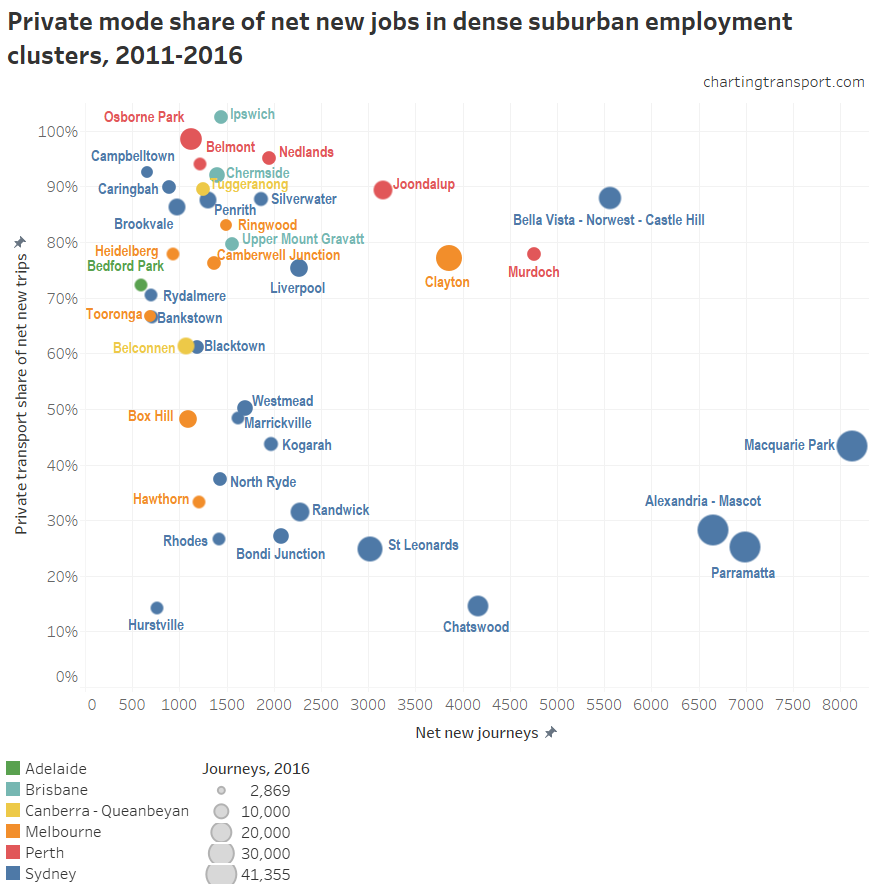
If you want to reduce private transport travel growth, then you don’t want to see many clusters in the top right of this chart (growing fast with high dependency on private transport). Those centres could be experiencing increasing traffic congestion, and may start to hit growth limits unless they get significantly improved public transport access.

Of the cluster in the top-right:

  • Bella Vista – Norwest – Castle Hill will soon have a rapid rail service with Sydney Metro.
  • Murdoch’s high private transport mode share might reflect the fairly long walking distance between the station and hospitals (up to 10 minutes through open space with no tree canopy), but also hospital shift workers who may find private transport more convenient.
  • Clayton might reflect most jobs being remote from the train line (although it is served by three SmartBus routes that have high frequency and some on-road priority). Note: my Monash cluster unfortunately does not include the Monash Medical Centre that is closer to Clayton Station and very job dense. The hospital precinct had its own destination zone in 2016 with 88% private transport mode share, but was washed out in a larger destination zone in 2011 which made it difficult to include in the cluster (for the record, that 2011 destination zone also had an 88% private transport mode share).
  • Joondalup is a large but not particularly dense employment area, and I suspect many jobs are remote from the train/bus interchange, and some local bus frequencies are low.

Can you predict mode shares with a mathematical model?

I have put the data used above into a regression model trying to explain private transport mode shares in the clusters. I found that only weighted job density, walking catchment size, and distance from CBD were significant variables, but this might be for want of a better measure of the quality of public transport accessibility (SNAMUTS Closeness Centrality scores are not available for many centres).

I also tested the percentage of jobs in health care and social assistance (looking for a hospital effect), the surrounding population up to 10km (nearby population density), median travel distances, and the size of clusters, but these did not show up as significant predictors.

Can you summarise all that?

  • Compared to other cities, Sydney has many more clusters and they are larger, more dense, and generally have much lower private transport mode shares.
  • With the exception of Canberra, less than half of all jobs in each city were in either the inner city area or a dense suburban jobs cluster. In Perth it was as low as 32%, while Sydney was 45%, and Canberra 54%.
  • Higher density clusters correlate with lower private transport mode shares.
  • Only higher density clusters centred on train stations with strong connections to the broader train network achieve relatively high public transport mode shares of journeys to work.
  • High quality bus services can boost mode shares in clusters, but the highest bus-only mode share was 15% (in 2016).
  • High-frequency express shuttle bus services can boost public transport mode shares in off-rail clusters.
  • Walk-only mode shares for journeys to work are generally very low (typically 2-5%) but generally higher in clusters where there are many nearby residents.
  • Private transport mode shares are generally 90%+ in clusters with free parking.
  • I suspect there is a relationship between parking prices and private mode share, but it’s hard to get complete data to prove this. Subsidised employer provided parking probably leads to higher private transport mode shares, and may be common at hospitals. However unexpectedly cheap parking in Bondi Junction and Chatswood needs to be explained (perhaps an oversupply, or just horrible traffic congestion?).
  • There is some evidence to suggest hospitals are prone to having higher private transport mode shares, possibly due to significant numbers of shift workers who need to commute at times when public transport service levels are lower.
  • Private transport shares in suburban clusters are much higher than central cities, but lower than elsewhere in cities. The private transport mode share of net new jobs in clusters is much higher than for central city areas, but generally lower than elsewhere in cities.
  • High density clusters still have large amounts of car parking.
  • Median commuter distances to suburban employment clusters are sometimes longer and sometimes shorter than median commuter distances to each cities CBD.
  • The clusters of Joondalup, Clayton, Murdoch, and Bella Vista – Norwest – Castle Hill have grown significantly in size with very high private transport mode shares. These centres might be experiencing increased traffic congestion, and their growth might be limited without significant improvements in public transport access.

What could this mean for Melbourne’s “National Employment and Innovation Clusters”?

One motivation for this research was getting insights into the future of Melbourne’s National Employment and Innovation Clusters (NEICs). What follows is intended to be observations about the research, rather than commentary about the whether any plans should be changed, or certain projects should or should not be built.

Firstly, the “emerging” NEICs of Sunshine and Werribee didn’t meet my (arguably) low criteria for dense employment clusters in 2016 (too small). The same is true for the Dandenong South portion of the “Dandenong” cluster (not dense enough).

Parkville and Fishermans Bend would have qualified had I not excluded areas within 4km of the CBD.

Significant sections of the Parkville, Fishermans Bend, Dandenong, Clayton, and La Trobe NEICs are currently beyond walking distance of Melbourne’s rapid transit network. Of these currently off-rail clusters:

  • Parkville: a new rail link is under construction
  • Fishermans Bend: new light and heavy rail links are proposed. In the short term, paid parking is to be introduced in some parts in 2018 (which had commuter densities of 47-63 per hectare in 2016). The longer term vision is for 80% of transport movements by public or active transport.
  • Clayton: New light and heavy rail links are proposed. The Monash University campus has had paid parking for some time, but there appears to be free parking for employees in the surrounding industrial areas to the north and east. It will be interesting to see if/when paid parking becomes a reality in the industrial area (commuter densities ranged from 48 to 74 jobs/ha in 2016, not dissimilar to Fishermans Bend). The Monash Medical Centre area is relatively close to Clayton train station, has very high commuter density (329 per hectare in 2016 before a new children’s hospital opened in 2017) and had 88% private transport mode share in 2016. No doubt car parking will be an ongoing challenge/issue for this precinct.
  • La Trobe: No rapid transit links are currently proposed to the area around the university, which had an 83% private transport mode share in 2016. There is a currently a frequent express shuttle bus from Reservoir station to the university campus, and a high frequency tram route touches the western edge of the campus.
  • Dandenong South: The area is dominated by industrial rather than office facilities, and the job density ranges from 7 to 33 commuters per hectare, which is relatively low compared to the clusters in my study. There are no commercial car parks listed on Parkopedia so I assume pretty much all employees currently get free parking. No rapid transit stations are proposed for the area. The area is served by a few bus routes, including one high frequency SmartBus route, but 98% of new jobs between 2011 and 2016 were accounted for by private transport trips. This suggests it is difficult even for high-frequency (but non-rapid) public transport to complete with free parking in such areas.

Another potential challenge is connectivity to Melbourne’s broader train network. Parkville (and Fishermans Bend should Melbourne Metro 2 be built) will be well connected to the broader network by the nature of their central location. The area around Sunshine station has excellent rail access from four directions (with a fifth proposed with Melbourne Airport Rail). Dandenong, La Trobe and Werribee are on or near 1 or 2 radial train lines.

You can read more about Melbourne’s employment clusters in this paper by Prof John Stanley, Dr Peter Brain, and Jane Cunningham, which suggests there would be productivity gains from improved public transport access to such clusters.

I hope this post provides some food for thought.


Can Airbnb explain falls in dwelling occupancy in Melbourne and Sydney?

Thu 10 May, 2018

According to census data, private dwelling occupancy has been declining in most Australian cities (refer my earlier post on the topic). Could an increase in private dwellings dedicated to Airbnb rental – but vacant on census night (a Tuesday in winter) – explain much of this decline? Let’s look at the data.

Firstly here’s a reminder of private dwelling occupancy trends in Australia’s 16 largest cities.

Dwelling occupancy rates declined in all large cities (but rose in some smaller urban areas, particularly on Central (NSW), Sunshine, and Gold Coasts).

The ABS have advised me that their field officers would have no way of telling whether a dwelling is on Airbnb, and would therefore count them as private dwellings. So vacant Airbnb dwellings could account for unoccupied private dwellings.

How many of the additional unoccupied dwellings might be dedicated to Airbnb?

The fantastic site Inside Airbnb provides data scraped from the Airbnb website about listings in various cities. I’ve used available data extracted on 4 September 2016 for Melbourne and 4 December 2016 for Sydney (the closest data sets available to the August 2016 census). I’ve then filtered for entire home/apartment listings that had more than 90 days availability in the 12 months ahead and had been reviewed at least once in the last six months, to estimate the number of “active and dedicated” Airbnb dwellings. Definitely just an estimate.

For the area for which Melbourne Airbnb data is available (I’ve approximated Inside Airbnb’s unpublished boundary as SA3s with any listings in 2016) these Airbnb dwellings account for 0.19% of total private dwellings. For that same area, dwelling occupancy dropped 0.71% from 92.61% to 91.90% between 2011 and 2016.

According to a Melbourne University study using data from commercial Airbnb data site AIRDNA, around 62% of entire home/apartment Melbourne listings (that were not blocked out by owners) were unoccupied on Saturday 27 August 2016.

I’m guessing the Airbnb vacancy rate might have been higher on census night (a Tuesday). If say 70% of the Airbnb dwellings were empty on census night (just a guess), then they would account for 0.09% out of the 0.71% decrease in dwelling occupancy in Melbourne between 2011 and 2016, which is about 19%.  Note: Airbnb barely existed in Melbourne in 2011 – there were only 161 Airbnb listings.

If somewhere between 60% to 80% of active/dedicated Airbnb properties were vacant, then they might explain between 16% and 21% the decline in dwelling occupancy in Melbourne.

For the equivalent area of Sydney, these Airbnb dwellings account for 0.22% of private dwellings, and there was a drop in private dwelling occupancy of 0.58% between 2011 and 2016. If somewhere between 60% to 80% of active/dedicated Airbnb properties were vacant, then they would explain between 23% and 30% of the decline in overall dwelling occupancy.

However I must stress these are rough estimates and might be over or under the actuals for several reasons:

  • It’s possible that some of these “entire home/apartment” listings are not counted by the ABS as dwellings (eg granny flats or segmented buildings that don’t have separate addresses) which would lead to over-estimates.
  • Some Airbnb listings that have less than 90 days availability in the 12 months ahead might just be very popular – leading to underestimates (my guess is that is unlikely).
  • The Sydney figure might be an overestimate because the Airbnb data was extracted three months after the census, and the total number of Airbnb listings almost doubled in 2016.
  • The actual Airbnb vacancy rate on census night might not have been in the 60-80% range.
  • I don’t know exactly where the city boundary was drawn for the Inside Airbnb data, but my approximation is more likely to be larger – which would lead to slight underestimates (probably very slight as the differences would be in peri-urban areas with few dwellings).
  • There may be other reasons – please comment.

That said, it looks like Airbnb might explain somewhere in the order of a fifth of the drop in private dwelling occupancy in Melbourne and Sydney between 2011 and 2016. Certainly not all of it, but probably not none of it either.

What proportion of dwellings are dedicated to Airbnb in different parts of Melbourne and Sydney?

Here’s a map of active/dedicated Airbnb dwellings (as per filter above) as a percentage of total dwellings in Melbourne at SA2 level:

It maxes out at 2.5% in the Melbourne CBD (that’s 1 in 40 dwellings), followed by Southbank and Fitzroy at around 1.9%. Mount Dandenong – Olinda is the orange patch to the east which measures 1.3%. View the data in Tableau.

As you would expect, Airbnb properties appear to be more prevalent around the inner city and tourist areas (eg St Kilda and the Dandenongs). These are also the areas with generally lower dwelling occupancy, and certainly some of the unoccupied dwellings in the census will be Airbnb dwellings.

Here is Sydney:

The highest rates are 2.6% around Bondi Beach, and 2.5% at Avalon – Palm Beach. Manly comes in at 1.5%, Surry Hills is 1.5%, Potts Point – Woolloomooloo is 1.4%, while the CBD area is 1.3%. Again, you can explore this Airbnb data in Tableau.

Could Airbnb properties explain the spatial differences in dwelling occupancy?

Here’s a plot of dwelling occupancy and Airbnb percentages for SA2s in Melbourne and Sydney.

I’ve done a linear regression on each city, and while the relationships are significant, they are not strong, and the correlation coefficients are -4.9 in Sydney and -1.5 in Melbourne. The signs are as expected (ie more Airbnb, lower occupancy), but the magnitudes are much higher than would be the case if Airbnb was the main explanation for lower dwelling occupancy (otherwise they would be around -1 or smaller). Which essentially means Airbnb presence is correlating with other drivers that would explain lower dwelling occupancy.

Indeed inner city and tourist areas had lower dwelling occupancy in both 2006 (when Airbnb didn’t exist) and 2011 (when Airbnb only had a tiny presence in Australia).

Therefore I think we can conclude Airbnb properties are more prevalent in areas where dwelling occupancy is lower for other reasons – one of which is likely to be popular places for visitors. Unoccupied Airbnb properties are almost certainly part of the pattern, but cannot explain the majority of the decrease in dwelling occupancy.

Can you do those Airbnb maps at higher resolution?

It’s getting a bit beyond the topic of transport, but yes I can go down to SA1 level. It’s not particularly important, but certainly interesting.

A disclaimer: Airbnb introduce randomised errors on property locations of up to 150 metres, so there will be some mis-attribution of properties to SA1s, but hopefully not too much. Also, I’m still only counting properties that match the above criteria.

Here’s inner Melbourne (note: different colour scale to last map):

Airbnb maxes out at 11% for three city blocks around Swanston Street and Collins Street, plus a large SA1 in East Melbourne that actually only contains a small residential area close to the CBD (including an apartment tower at 279 Wellington Parade). There’s also an SA1 in Southbank behind Crown Casino that is 10% Airbnb.

Curiously, there were only about 6 Airbnb listings in the New Quay apartments in Docklands that had 65-70% occupancy (refer earlier post), so Airbnb is definitely not to blame of the low occupancy of those towers.

Outside the central city, other hot spots are St Kilda around Acland Street (6%), just east of South Yarra Station (6%), and a patch of Olinda (5%). Explore in Tableau.

Here’s Sydney:

It tops out at 11% in the southern part of the CBD, with 10% in part of Pyrmont and 7% in pockets near Manly and Bondi Beach. Other hotspots include Coogee (6%) and Whale Beach further north (5%). Explore in Tableau.


Where are the unoccupied dwellings in Australian cities?

Sat 4 November, 2017

Over one million private dwellings in Australia were unoccupied on census night in 2016 – 11.2% of all private dwellings – up from 10.2% in 2011.

This raises many questions. Where are these unoccupied dwellings and where are they now more prevalent? What type of dwellings are more likely to be unoccupied? How long have these dwellings been unoccupied? Do we know why these dwellings are unoccupied?

This post will focus on dwelling occupancy by geography, dwelling types and trends over time. In a future post I hope look into those last two questions in more detail.

I’ve prepared data for sixteen Australian cities, with various maps in Tableau (you will need to zoom and pan to your city of interest).

Why am I blogging about dwelling occupancy on a transport blog? Well partly because I’m interested in urban issues, but also because land use is very relevant to transport. If dwelling occupancy rates in the inner and middle suburbs were higher, there would be more people living closer to jobs and activities who might be less reliant on private motorised transport for their daily travel.

If you’d like to read more around the associated policy issues, Professor Hal Pawson from UNSW has a good piece in The Conversation highlighting the increasing number of empty properties and spare bedrooms, and advocates  replacing stamp duty with a broad-based land tax to improve housing mobility. Also read Eryk Bagshaw in the Fairfax press, Jonathan Jackson in Finfeed, and a piece in Business Insider where the Commonwealth Bank state that 17% of recently built dwellings are left unoccupied (not sure how that was calculated).

What are the dwelling occupancy rates in Australian cities?

Here’s a chart showing private dwelling occupancy rates for sixteen Australian cities (using 2011 Significant Urban Area boundaries) from the last three censuses:

Note the y-axis only runs from 84% to 94%, so the changes are not massive. However a small change in dwelling occupancy can still have a large impact on housing prices (rental and sales).

The Sunshine and Central Coasts have the lowest occupancy, almost certainly explained by many holiday homes in those regions, although all three have been trending upwards. Curiously, the Gold Coast – Tweed Heads had a significant increase in occupancy between 2011 and 2016 to take it above Perth, Townsville, and Darwin.

Hobart and Cairns also had increased occupancy between 2011 and 2016, but all large cities declined between 2011 and 2016. Perth, Darwin and Townsville had big slides – quite possibly related to the downturn in the mining industry and slowing population growth (all three have seen slowing population growth in recent years after a boom period). Then again, if there are more fly-in-fly-out workers in a city you might expect dwelling occupancy on census night to go down as a portion of them will be away for work on census night.

How does dwelling occupancy in capital cities compare to the rest of the country?

Private dwelling occupancy is significantly lower outside the capital city areas. While the capital city areas contain 63% of all private dwellings, they only contain 51% of unoccupied private dwellings.

How does dwelling occupancy vary by dwelling type?

Here’s a chart of 2016 dwelling occupancy by Greater Capital City Statistical Areas and the most common dwelling types:

In many cities there is a strong correlation between housing type and occupancy, with separate houses having the highest occupancy rates, and multi-storey flats/apartments having the lowest. The pattern is strongest in Perth – perhaps reflecting reduced demand for apartment living following the end of the mining boom(?).

The data suggests higher density apartments are more likely to not be occupied on census night, but it doesn’t tell us why. Of course different dwelling types have different spatial distributions, so is it the dwelling type that drives the occupancy rates? I’ll come back to that shortly.

Where are the unoccupied dwellings?

Quite simply, here is a map showing the density (at SA2 geography) of unoccupied dwellings in Melbourne over time (you might need to click to enlarge to read more clearly):

(I’ve not shaded SA2s with less than 1 unoccupied dwelling per hectare. You can look at other cities in Tableau by zooming out and then in on another city).

You can see a fairly significant increase in the number of unoccupied dwellings in the inner and middle suburbs (at least at densities above 1 per hectare).

From a transport perspective – this isn’t great. If people lived in those dwellings rather than dwellings on the fringe of Melbourne, the transport task would be easier as there would be many more people living closer to jobs and other destinations with non-car modes being more competitive.

But these areas with a relatively high density of unoccupied dwellings are also areas with a high density of dwellings in general. The density of unoccupied dwellings has risen in the same places where total dwelling density has risen:

(see in Tableau – you may need to change the geography type)

Given you would expect a small percentage of dwellings to be unoccupied for good reasons (eg resident temporarily absent, or property on the market), it makes sense that the density of unoccupied dwellings has gone up with total dwelling density.

But a decrease in the dwelling occupancy rate requires the number of unoccupied dwellings to be growing at a faster rate than the total number of dwellings. We already know that is happening at the city level through declining occupancy rates, so how does that look inside cities?

How does dwelling occupancy vary across Melbourne?

Here’s a map of dwelling occupancy in Melbourne and Geelong at CD/SA1 level geography:

(see also in Tableau)

You can see very clearly that occupancy is lowest on Mornington Peninsula beaches to the south – which almost certainly reflects empty holiday homes on census night (a Tuesday night in winter).

In fact, I’ve created a map of dwelling occupancy at SA2 level for all of Australia, and you can see many coastal holiday areas around Melbourne (and other cities) with low occupancy (with Lorne – Anglesea at 32% and Phillip Island at 40%):

The previous Melbourne map at CD/SA1 level is very detailed and so it’s not easy to see the overall trends. Also, apart from the Mornington Peninsula, occupancy rates are almost all above 80%.

So here is a zoomed-in map with a different (narrower) colour scale, with data aggregated at SA2 level (also in Tableau):

Things become much clearer.

The highest dwelling occupancy is generally on the fringe of Melbourne.

Apart from holiday home areas, the lowest occupancy in 2016 was concentrated in wealthier inner suburbs, including Toorak at 83% and South Yarra west at 84%. This was closely followed by the CBD, Docklands, East Melbourne, Southbank, and Albert Park between 84% and 86%. These areas have all had declining occupancy since 2011.

It can be a little difficult to see the changes in occupancy rates, so here is a non-animated map the change in dwelling occupancy rates between 2006 and 2016 (also in Tableau):

There are at least small declines in most parts of Melbourne. The biggest decline was 7% in Bundoora North (with lowest 2016 occupancy of 79% in these new units in University Hill ), followed by 5% in Doncaster (lowest around Doncaster Hill where there are new apartments, perhaps too new to be occupied on census night?), 4% in South Yarra East (lowest in the new apartments around South Yarra Station, again possibly because some are very new) and Prahran – Windsor.

Curiously, Docklands dwelling occupancy increased by 9% from 75% to 85% (rounding means that those numbers don’t perfectly add). Perhaps there were many new yet-to-be-occupied dwellings in 2006? For reference, Dockland’s 2011 occupancy was 84%, only slightly below the 2016 level.

The outer growth areas are a mixed bag of increases and decreases. This possibly depends again on how many brand new but not yet occupied dwellings there were in 2006 and 2016.

What are the dwelling occupancy patterns in other cities?

Sydney

You can see lower occupancy around the CBD, North Sydney, Manly, and the northern beaches, and higher occupancy in the western suburbs.

The largest declines are evident in the city centre and North Ryde – East Ryde:

Brisbane

Brisbane has some big declines to the north-east of the city centre, Rochedale – Burbank, Woodridge, Logan, and Leichhardt – One Mile. The Redland Islands in the east are presumably a popular place for holiday homes.

Perth

Low occupancy is evident around Mandurah in the south (a popular holiday home area). Lower occupancy has spread around the inner city, and beach-side suburbs of Scarborough, Cottesloe, Fremantle, and Rockingham (many of which are areas with higher concentrations of Airbnb properties).

The biggest declines were in Maylands, Victoria Park – Lathlain – Burswood, and South Lake – Cockburn Central. For the first two of these areas the decline was mostly in flats/units/apartments.

Adelaide

The lowest occupancy is on the south coast and in Glenelg. The biggest decline was in Fulham (-5%), followed by Payneham – Felixstowe (-4%):

[Canberra, Hobart and Darwin added 6 November 2017]

Canberra

Dwelling occupancy was lowest around Parliament House (the census was not during a sitting week in 2016), and highest in the outer northern and southern suburbs. The 2006 census was during a sitting week, so it’s little surprise that big dwelling occupancy reductions were seen around Capital Hill between 2006 and 2016.  There was also a 5% decline in Farrer and a 6% growth in Gungahlin between 2006 and 2016 (Gungahlin’s dwellings almost doubled between 2006 and 2011, so the 2006 result might reflect brand new dwellings awaiting occupants).

Hobart

Dwelling occupancy was lowest in central Hobart, with the biggest decline of 4% in Old Beach – Otago, but overall there was little change between 2006 and 2016 (average occupancy did drop slightly in 2011 though).

Darwin

Darwin dwelling occupancy was lowest in the city centre at 82% in 2016, while Howard Springs had 100% occupancy (in 2016). Declines are evident between 2006 and 2016 across most parts of Darwin.

Gold Coast

Here’s a map of 2016 occupancy at SA1 level, with the original broader colour scale:

You can see quite clearly that the beach-side areas have low occupancy, while the inland areas have much higher occupancy (some at 100%). Presumably many permanent residents cannot or choose not to compete with tourism for beach-side living.

Sunshine Coast

Similar patterns are evident on the Sunshine Coast, particularly around Noosa and Sunshine Beach in the north:

If you want to see other cities, move around Australia in Tableau for occupancy maps at CD/SA1 and SA2 geography (choose you year of interest), and occupancy change maps (at SA2 geography).

So are there lots of unoccupied inner city apartments in Melbourne?

Some commentators have spoken about many inner city apartments being unoccupied – perhaps through a glut or investors chasing capital gains and not interested rental incomes.

Here is dwelling occupancy in central Melbourne at SA1 geography for 2016, using the broader colour scale (also in Tableau):

There are quite a few pockets of very low occupancy, particularly areas shaded in yellows and greens. The average private dwelling occupancy for the City of Melbourne local government area was 87%, lower than the Greater Melbourne average of 91%.

The lowest occupancy is a block between Adderley, Spencer and Dudley Street in North Melbourne at 56%, which is probably related to the recent completion of an apartment tower not long before the census (from Google Street view we know it was under construction in April 2015 and completed by October 2016).

There are several patches of yellow  (65-70% occupancy) in the CBD, Docklands and Southbank.

But what about apartment towers? For that we need to drill down to mesh blocks – and thankfully 2016 census data is actually provided at this level.

Here’s a map showing dwelling occupancy of mesh blocks in the City of Melbourne (local government area) with at least 100 dwellings per hectare (as an arbitrary threshold for large apartment building – see the appendix for an example of this density):

(explore in Tableau)

Some notable low occupancy apartment towers include:

  • 48% for an apartment tower at 555 Flinders Street (Northbank Place Central Tower) between Spencer and King Street and the railway viaduct. It wasn’t brand new in 2016.
  • 47% in a block that includes the Melbourne ONE apartment tower, possibly because it was only just opened (as I write there are still apartments for sale)
  • 65% for one of the towers at New Quay, Docklands (which seems to include serviced apartments)
  • 66% for a tower at 28 Southgate Ave (corner City Road), and 67% for the Quay West tower next door (almost certainly popular places for Airbnb / serviced apartments).

Several of these towers include advertised serviced apartments, and I expect the towers would contain a mix of serviced apartments, owner-occupied apartments and rentals (regular and Airbnb). However ABS advises me that field officers do speak to building managers, and are therefore likely to not code serviced apartments as private dwellings.

That said, according to the 2016 census data there were only 11 non-private dwellings in Docklands that were classified as “Hotel, motel, bed and breakfast”, and zero non-private dwellings in the New Quay apartment towers.

I snapped this picture at 9pm on a Sunday in September 2017 of the apartments at New Quay (Docklands) that at the 2016 census had 65-70% occupancy:

Of course you wouldn’t expect lights to be on in all rooms in all occupied dwellings at 9pm on a particular Sunday, but I dare say it’s probably a time when fewer people would be out. It looks like a lot less than a quarter of rooms are lit. I know very few of these are on Airbnb (more on that in a future post!), but I don’t know how many are actually serviced apartments.

There’s huge variation in dwelling occupancy across these mesh blocks. So is the lower occupancy more concentrated in higher density areas? Here’s a scatter plot of all mesh blocks in the City of Melbourne by dwelling density and occupancy:

There’s not a strong relationship between density and occupancy. The variation in dwelling occupancy between mesh blocks will probably depend on a lot of local factors.

What about occupancy by dwelling type for the inner city?

(data points removed where dwelling counts were small, the isolated blue dot at the bottom is for Southbank).

There’s no evidence that flats / apartments have lower occupancy than other housing types in the central city. However there is evidence that inner city areas have relatively lower occupancy.

So how does the occupancy of apartment blocks of 4+ storeys vary across Melbourne?

Box Hill had the lowest apartment occupancy of 50% (perhaps some were brand new?), followed by Ringwood, Glen Waverley, and Brighton in the 70-75% range.  Croydon East, Templestowe , Seddon – Kingsville, Clayton, Carnegie, West Footscray, Braybrook and Frankston reported occupancy above 95%. The inner city areas were around 84-85% occupied, and these would make up the majority of such dwellings in Melbourne.

Apartments in blocks of 4+ storeys seem to have lower occupancy on average because most of them are located in the central city, which generally has lower dwelling occupancy.

Here’s a similar map (with a different colour scale) for dwelling occupancy of separate houses across the Melbourne region:

The lowest rates in metropolitan Melbourne are 82-83% in some inner city areas, while the urban growth shows up in pink and purple, mostly 94-96%.

Explore the 2016 occupancy rates at SA2 geography for different dwelling types for any part of Australia in Tableau. You can also view changes in occupancy rates since 2006 for separate houses, flats/units/apartments, and semi-detached/townhouses.

Why are there lower dwelling occupancy rates in the central city?

The census doesn’t answer this, and I’m not a housing expert, but I dare say there are plenty of plausible explanations:

  • Many dwellings are rented out on Airbnb (and/or other platforms) – but are not in high demand on a weeknight in mid-winter (more on that in this post).
  • Many dwellings are serviced apartments that are indistinguishable from regular private dwellings (in buildings with a mixture of dwelling use). ABS say they don’t count these as private dwellings, however they are not showing up as non-private dwellings.
  • Dwellings are more likely to occupied by executives who travel more frequently.
  • Dwellings might be second homes for people living outside the city.
  • Dwellings might be owned by employers for interstate staff visiting Melbourne.
  • Dwellings might be poorly constructed and uninhabitable (eg mould issues).
  • Investors who are not interested in rental income might deliberately leave properties vacant (something that is disputed).

But I’m just speculating.

What about dwelling occupancy in the centre of other cities?

Here’s a map of the Sydney CBD area at SA1 geography:

There are some very low occupancy rates in the north end of the CBD, but very high occupancy rates around Darling Harbour and Pyrmont.

Here’s central Brisbane:

Here are occupancy rates for different dwelling types for selected inner city SA2s in Sydney, Brisbane, Adelaide and Perth:

In all SA2s except Surrey Hills (Sydney) and South Brisbane, flats or apartments in 4+ storey blocks had the lowest dwelling occupancy in 2016. Only in Perth City SA2 (which is quite a bit larger than the CBD) is there a reasonably clear relationship between housing type and occupancy.

Summary of findings

Couldn’t be bothered reading all of the above, or forgot what you learnt? Here’s a summary of findings:

  • Dwelling occupancy, as measured by the census, has declined in most Australian cities between 2006 and 2016 (particularly larger cities).
  • Dwelling occupancy is generally very low in popular holiday home areas, but also relatively low in central city locations.
  • Dwelling occupancy is generally highest in outer suburban areas.
  • Higher density housing types generally have lower occupancy, but that is probably because they are more often found in inner city areas.
  • There are examples of low occupancy apartment towers in Melbourne, but there’s not a clear relationship between dwelling density and dwelling occupancy in central Melbourne.

In a future post I plan to look more at why properties might be unoccupied, and for how long they are unoccupied, drawing on Airbnb and water usage datasets.  I might also look at bedrooms and bedroom occupancy which is a whole other topic.


Appendix – About the census dwelling data

I’ve loaded census data about occupied and unoccupied private dwellings data into Tableau for 2006, 2011, and 2016 censuses for sixteen Australian cities at the CD (2006) / SA1 (2011,2016) level, which the smallest geography available for all censuses. I’ve mapped all these CDs and SA1s to boundaries of 2016 SA2s and 2011 Significant Urban Areas (as per my last post). Those mappings are unfortunately not perfect, particularly for 2006 CDs.

The ABS determine a private dwelling to be occupied if they have information to suggest someone was living in that dwelling on census night (eg a form was returned, or there was some evidence of occupation). Under this definition, unoccupied dwellings include those with usual residents temporarily absent, and those with no usual residents (vacant).

For my detailed maps I’ve only included CDs / SA1s with a density of 2 dwellings per hectare or more.

For reference, here is a Melbourne mesh block with 100 dwellings per hectare:

And here is a mesh block with 206 dwellings per hectare (note only a small part of mesh block footprint contains towers):


Which Australian city is sprawling the most?

Sat 3 December, 2016

[Updated May 2019 with June 2018 population estimates and new data on components of population growth]

For a while now, I’ve been tracking urban sprawl and consolidation in Melbourne, but some interesting research prompted me to compare Melbourne to the other large Australian cities.

My question for this post: How do Australian cities compare for growing out versus up? (and by growth I’m talking about population)

Firstly, I need to define “outer” growth.

To do this, I’ve mapped the 2001, 2006, and 2011 ABS urban centre boundaries of each city. I’ve then looked at Statistical Area 3 regions within each Greater Capital City area that either saw substantial urban growth between 2001 and 2011, or were located on the fringe of the main urban area.

Here’s a map of Melbourne, with my designated “outer” areas shaded in a transparent blue:

The area in the middle is mostly shaded green – land considered by the ABS to be urban since at least 2001. There are a few yellow and orange areas (developed 2001-06 and 2006-11 respectively) that are not part the blue shaded “outer” area. The larger orange section visible in the south is mostly green wedge or industrial land, so does not represent growth of residential areas (maps for other cities below). The other yellow and orange areas are relatively small, and many have non-residential land uses.

I’ve done a similar process for Sydney, Perth, Adelaide, and the conurbation of South East Queensland (i.e. Brisbane, Gold Coast, and Sunshine Coast combined). See the end of this post for equivalent maps of these cities.

With an outer area defined for each city, I have calculated the annual population growth of these outer areas (based on 30 June estimates for each year) as a proportion of total population growth in each city:

percentage outer city population growth v4

As you can see almost all recent population growth in Perth is happening in the outer suburbs (in fact there was population decline in the rest of Perth in 2015-2016), while it has been around half in Melbourne and South East Queensland, and lower in other cities, although Sydney had an uptick in 2018.

For reference, here are annual population growth rates for the five cities:

city population growth v2

Perth saw dramatic growth between 2007 and 2013, but much less growth in the last few years, and most of that happened in outer areas. In recent years Melbourne has grown the fastest.

The population data I’m using goes back to 1991, which creates some interesting results in the early nineties (even though my defined “outer” areas are trying to measure growth from 2000 onwards). In Adelaide in 1993 the outer areas had “156%” of the city’s population growth – which actually means that the outer areas grew (by 4509 people) while the inner areas had population decline (by 1617 people). At the same time in Melbourne, “103%” of population growth occurred in the outer areas as there was a net reduction of 393 people in the inner areas of Melbourne.

This reflects a previous trend for cities to grow mostly outwards until the mid-1990s, when urban densification took off. For more on this topic see How is density changing in Australian cities? (2nd edition)

So is Perth the most sprawling large city in Australia? Well, yes in terms of percentage of population growth, but not in terms of absolute population growth in outer areas:

outer city population growth v4

On my definitions of outer areas, Melbourne is charging ahead, with over 66,000 residents moving into growth areas in 2017-18. Perth peaked in 2012, but has fallen back since. Adelaide just hasn’t seen a lot of population growth in recent decades.

I’m measuring sprawl by population, but you could argue that it might be better measured by urbanised area. Unfortunately that is tricky because definitions of urbanised area have changed over time and occasionally have large jumps as non-urban wedges are absorbed.

Population growth in outer Sydney slowed dramatically between 2002 and 2006. The chart below shows there was also a slow down in non-outer areas, although it was a little less dramatic. Around this time Sydney also transitioned from around 50% of growth being in outer areas, down to around 30%.

Here is the annual population growth in the non-outer areas of each city:

nonouter city population growth v4

Around 2007 there was an acceleration of population growth in non-outer areas in most cities (although there was a subsequent lull around 2010-2012). In 2015-16 in Perth, the population of the non-outer areas decreased by an estimated 3524 people.

Another measure of sprawl is the average distance of residents from the city centre. Here are rough calculations for Greater Capital City areas using SA2 data (it would probably be unfair to measure all of South East Queensland against the Brisbane CBD):

Average resident distance from CBD on SA2

On this measure Perth is sprawling the fastest, with the average resident in 2018 being roughly 21 km from the CBD, up from just over 16 km in 1991. Sydney and Canberra have seen a reduction in average distance from the CBD, as inner areas become more dense.

A couple of things to note:

  • The outer areas will have some combination of urban growth and urban densification. My guess is that most population growth will be from urban sprawl, as urban consolidation is more likely to happen in the inner and middle suburbs. But my method doesn’t attempt to remove urban consolidation in outer areas.
  • You might be wondering about the inclusion of outer areas that are not experiencing urban growth. These areas are unlikely to have much population growth at all, so will have little impact on the calculations of percentage of growth in outer areas.

That said, I’ve also done a more fine grained analysis of outer growth areas using census data without these issues. See: Are Australian cities sprawling with low-density car-dependent suburbs?

Where did the new residents come from?

The ABS now publishes the components of population growth down to SA2 geography for 2016-17 onwards, so we can dig a little deeper.

Here are the components of outer suburban population growth in 2016-17 and 2017-18 (animated):

Components of city outer population growth

Internal migration refers to people moving to/from other parts of Australia (possibly including other parts of the city)

In Perth and Adelaide, less than half of the outer suburbs population growth was from new residents, whereas it was more like 72% in the other three urban centres. This might reflect relatively slower outer urban growth in Perth and Adelaide – with population growth coming more from existing residents growing families rather than new residents moving in.

Here are the components of population growth for the five urban centres as a whole:

Components of city population growth

Sydney, Perth, and Adelaide have seen existing residents leave for other parts of Australia, replaced with births and international migrants.

Here’s the same for the non-outer suburbs:

Components of city nonouter population growth

The three columns for each city do actually add to 100%. In Perth the net of the components was very little population change, so each component becomes a very large percentage of the small net total population change.

That chart is quite confusing, so instead let’s look at the underlying numbers:

Components of city nonouter population growth quantity

In Melbourne and Sydney, the net increase from births/deaths in non-outer areas was effectively cancelled out by people migrating away domestically (many likely to the outer suburbs of the same city), with the net population growth then mostly accounted for by net overseas immigration.

The only urban area where the existing non-outer area didn’t see net outbound domestic migration was South East Queensland.

For further analysis on the components of population growth, see Visualising the components of population change in Australia

Some non-Australian readers might be confused by the term “overseas”. We use it interchangeably with “international” because Australia has no land borders with other countries.

Appendix – Maps showing outer areas of cities

For Melbourne refer to the top of this post.

Sydney

sydney-cropped

I’ve used the full Greater Capital City area, which includes the Central Coast (Gosford / Wyong). This is arguably part of a conurbation with Newcastle but I’ve kept to the Greater Sydney boundary.  The large orange and yellow non-outer area to the west is mostly parkland or industrial, while the orange area to the south is mostly the Holsworth Military area which was defined as urban from 2011.

South East Queensland

seq-cropped

I’ve included all of Greater Brisbane, as well as the Gold Coast (as far as the border with NSW) and the Sunshine Coast. The conurbation population includes the established areas of the Gold Coast and Sunshine Coast as non-outer areas. The orange areas on the Sunshine Coast mostly contain National Parks and the airport, although it also includes the relatively new suburb of Peregian Springs, so not a perfect definition.

Perth

perth-cropped

The non-outer area is fairly well-defined as almost entirely urban in 2001. The entire of the City of Joondalup (on the northern coast, mostly surrounded by Wanneroo) counts as urban in 2001, although the suburb of Iluka in the north-western corner has developed more recently, so the calculation won’t be perfect.

Adelaide

adelaide-cropped

The two large orange areas in the non-outer area are non-residential, so there will be little fringe growth outside the blue area.