Who is cycling to work? Where do they live? Where do they work? How old are they? What work do they do? Do men commute by bicycle more than women? How far are cyclists commuting? What other modes are cyclists using?
The census provides some answer to these questions for the entire Australian working population, albeit for one winter’s day every five years.
This post builds on material I presented at the Bike Futures 2013 conference, using census data from across Australian with a little more detail on capital cities and my home city Melbourne.
It’s not a short post, so settle in for 13 charts and 17 maps of data analysis.
How has cycling mode share changed over time?
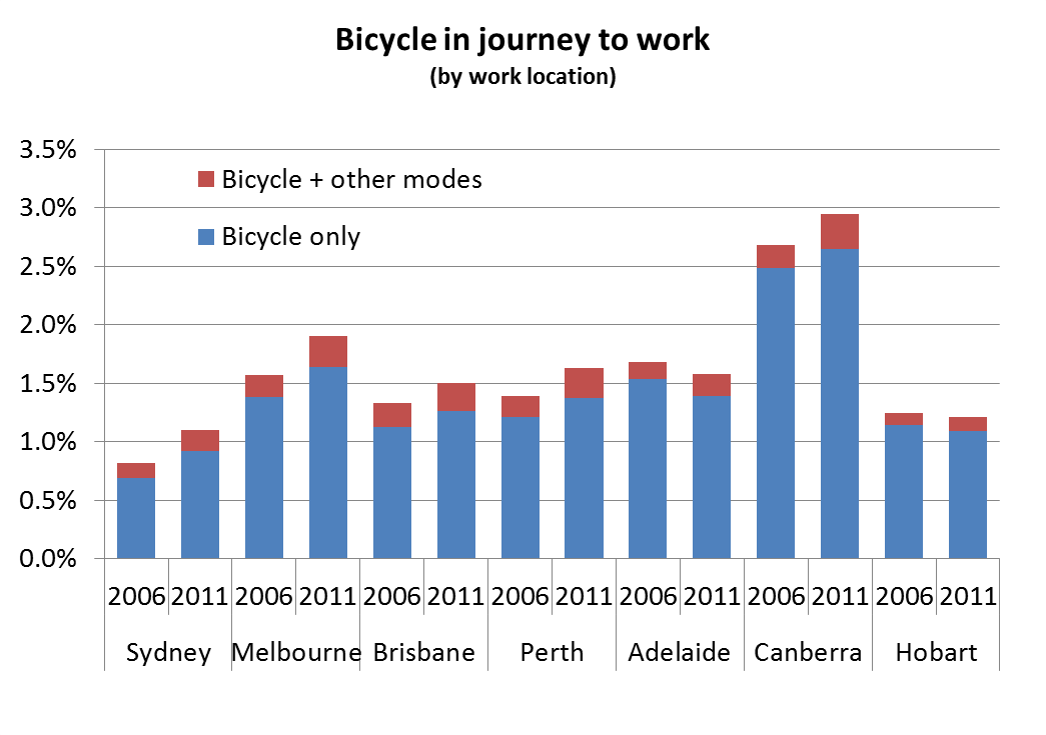
The first chart shows the proportion of journeys to work by bicycle (only) in Australia’s capital cities.
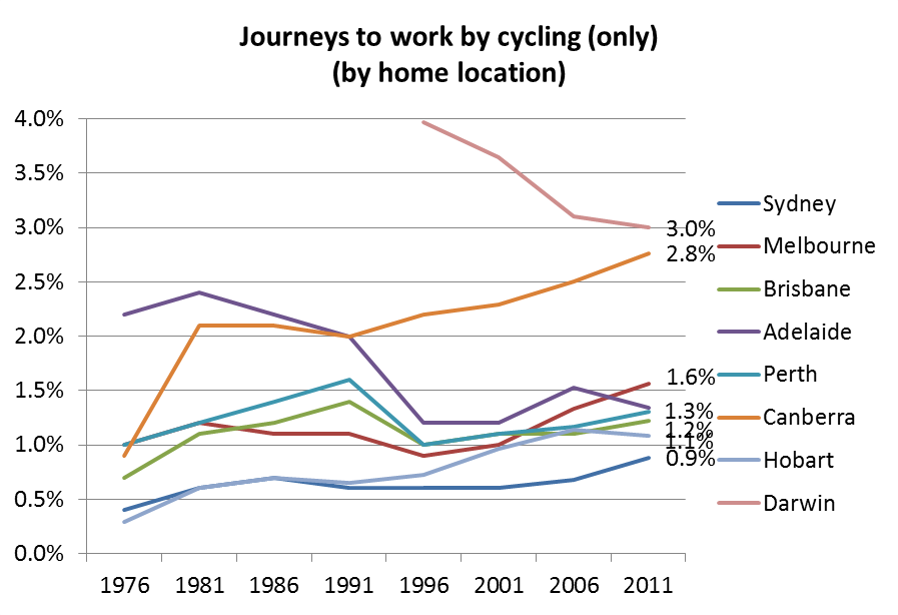
Darwin appears to the capital of cycling to work, although it is quickly losing ground to Canberra (unfortunately I don’t have figures for Darwin pre-1996). The census is conducted in Darwin’s dry season, but other data suggests there is little difference in bicycle activity between the wet and dry seasons.
Melbourne has shown very strong growth since 2001 and Sydney showed strong growth between 2006 and 2011. Cycling mode share has grown in all cities since 1996.
Mode shares collapsed in Adelaide, Sydney, Brisbane, and Melbourne between 1991 and 1996, which many people have attributed to the introduction of mandatory helmet laws (Alan Davies has a good discussion about this issue on his blog).
But as I pointed out at the start, census data is only good for one winter’s day every five years. Does the weather on these days impact the results?
Here is a chart roughly summarising the weather in (most of) the capital cities for 2001, 2006 and 2011 in terms of minimum temperature, maximum temperature and rainfall. It doesn’t cover wind, nor what time of day it rained (although perhaps some fair-weather cyclists might avoid riding on any forecast rain). It also fails to show the sub-zero minimums in Canberra (involves asking too much from Excel).

You can see that 2011 was wetter in Adelaide and Hobart than previous years, and this coincides with lower cycling mode shares in these cities in 2011. So census data is quite problematic from a weather point of view. That said, most cities had very little or no rain on the last three census days.
Where were the commuter cyclists living and working?
Other posts on this blog have also covered some of these maps, but not for all cities.
Some of the following maps are animated to show both 2006 and 2011 results, and note that the colour scales are not the same for all maps. I’ve sometimes zoomed into inner city areas when these are the only places with significant cycling mode share. White sections on maps represent areas with low density, or where the number of overall commuters was very small (sorry I haven’t gone to the effort of making every map 100% consistent, but rest assured the areas in white are less interesting). Click on the maps to see more detail.
Canberra
Firstly home locations:

The cycling commuters mostly appear to be coming from the inner northern suburbs. I don’t know Canberra intimately, but Google maps doesn’t show a higher concentration of cycling infrastructure in this area compared to the rest of Canberra.
Secondly, bicycle mode share by work destination (at the larger SA2 geography):

The highest mode share was 12% in the SA2 of Acton, which is dominated by the Australian National University. Perhaps a lot of the university staff live in the inner northern suburbs of Canberra?
Melbourne
By home location:
Cycling mode share is highest for origins in the inner northern suburbs and has grown strongly since 2006. There’s also been some growth in the Maribyrnong and Port Phillip council areas off a lower base.
By work location (note: this data is at the smaller destination zone geography):

Cycling to work boomed in inner Melbourne between 2006 and 2011, particularly to workplaces in the inner north. Princess Hill had the highest bike share of 14% in 2011 (possibly dominated by Princess Hill Secondary College employees), followed by a pocket of south-west Carlton that jumped from around 5% to 13%. Apart from the inner north, there were notable increases in Richmond, Balaclava, Yarraville and Southbank. Cycling rates within the CBD are relatively low, perhaps reflecting limited cycling infrastructure on CBD most streets in 2006 and 2011.
Adelaide
Firstly, by home:
Adelaide appears to lack any major concentrations of cycling, although slightly higher levels are found just outside the parkland surrounding the CBD.
Secondly, bicycle mode share by work destination at the (larger) SA2 geography:

The numbers are all small, with 3% in the (large) Adelaide CBD. I imagine a map based on destination zones might show some pockets with higher mode share, but that data isn’t freely available unfortunately.
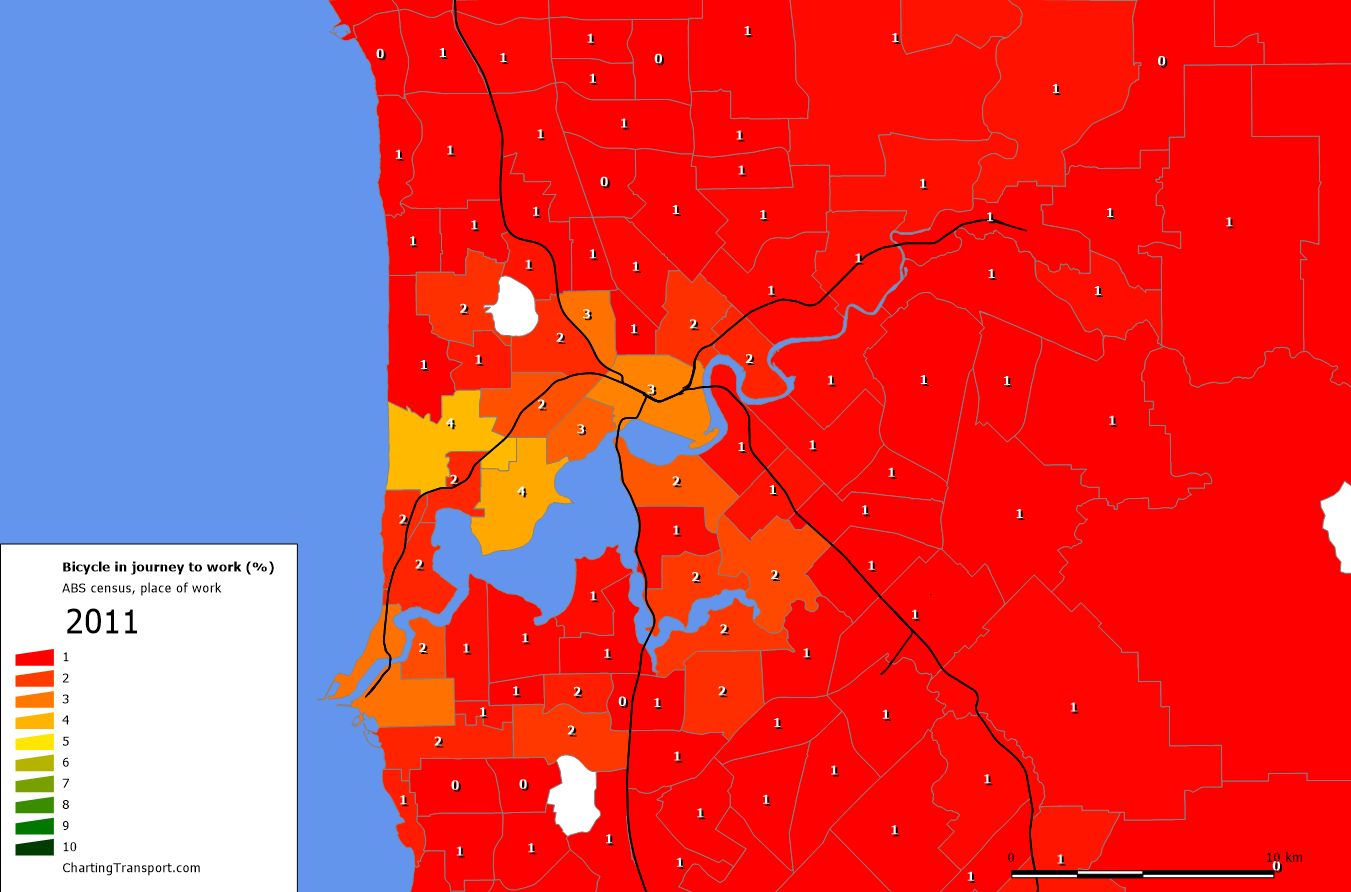
Perth
By home location:
The inner northern and western suburbs, and south of Fremantle seem to be the main areas of cycling growth.
For workplaces at the larger SA2 geography:
The highest mode share was in ‘Swanbourne – Mount Claremont’, only slightly ahead of ‘Nedlands – Dalkeith – Crawley’ – which contains the University of Western Australia. The Fremantle SA2 (with 3% bicycle mode share by destination) includes of Rottnest Island where around 20% of the 73 resident commuters cycled to work, but the result will be easily dominated by the mainland Fremantle section.
Again, I suspect some smaller pockets would have had higher mode shares if I had access to destination zone data.
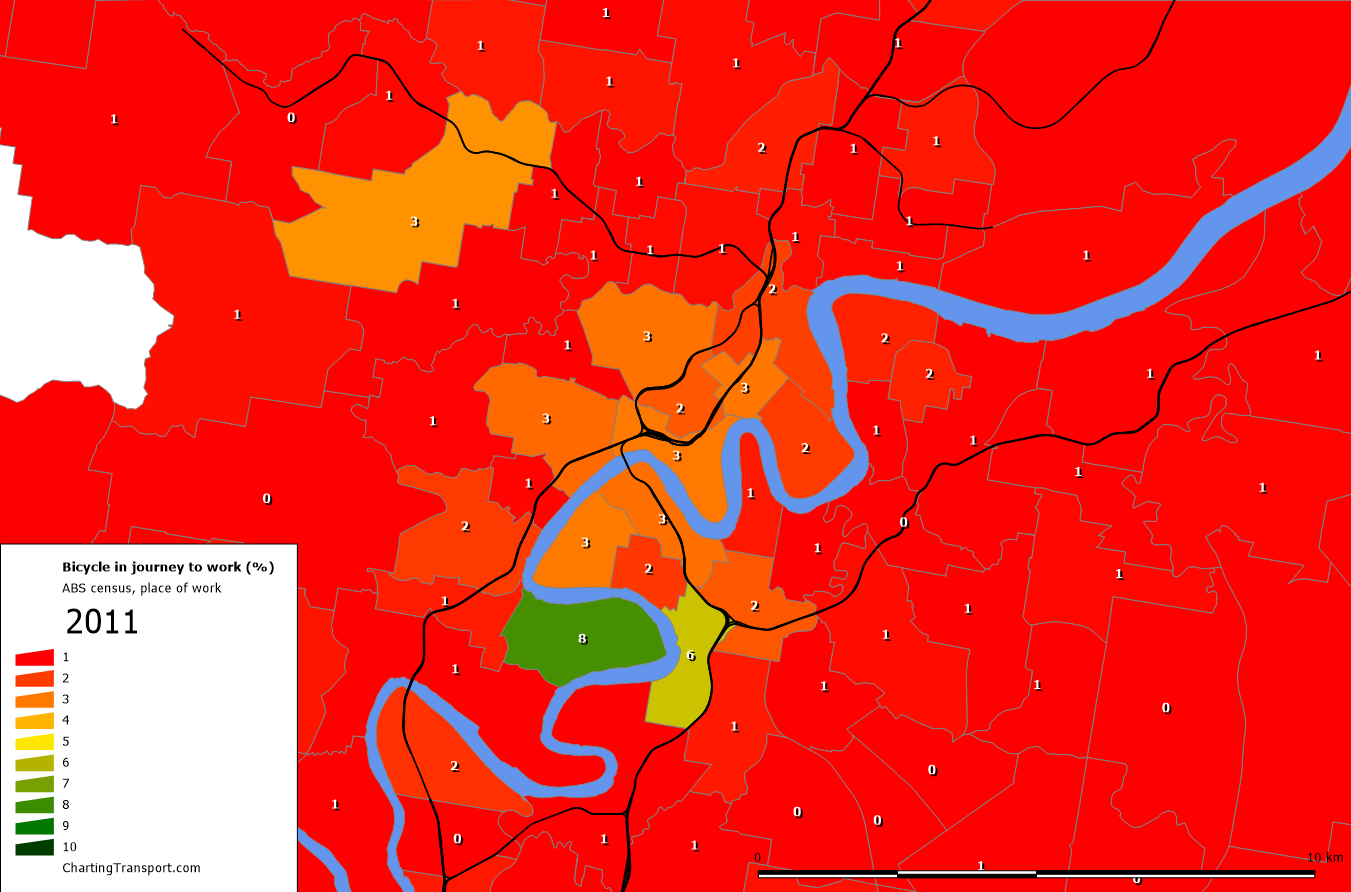
Brisbane
By home location:
There was significant growth in cycling from the West End, and around the University of Queensland/St Lucia – which may be related to the opening of the Eleanor Schonell Bridge (after the 2006 census) which only carries pedestrians, cyclists and buses.
By work location (at larger SA2 geography):
The highest share was in St Lucia – which is probably dominated by the University of Queensland. Neighbouring Fairfield – Dutton Park came in second. These two areas are directly joined by the Eleanor Schonell Bridge which provides cycling a major advantage over private transport. It seems to have been quite successful at promoting cycling in these areas.
Sydney
First by home location:
There were quite noticeable shifts to cycling in the inner south and around Manly.
By work location (by smaller destination zone geography):
There was strong growth, again in the inner southern suburbs. In 2011 bicycle mode share was highest in Everleigh (11.5%) following by the University of NSW (Paddington) at 7.9% (excluding travel zones with less than 200 employees who travelled).
Rural Australia
Here’s a map showing bicycle share by SA2 workplace location for all of Australia, which gives a sense of bicycle mode shares in rural areas.

Higher regional/rural bicycle mode shares are evident in southern Northern Territory (Petermann – Simpson), Katherine (NT), the Exmouth region, the Otway SA2 on the Great Ocean Road in western Victoria, and Longford – Loch Sport in eastern Victoria. I’ll let other people explain those.
The SA2s in Australia with the highest cycling mode shares in 2011 (by home location) were:
- Lord Howe Island, NSW: 21%
- Acton, ACT (covering Australian National University): 12%
- Port Douglas, Queensland: 10%
- Parkville, Victoria (covering the University of Melbourne main campus): 8%
- East Side, Northern Territory (Alice Springs): 8%
- St Lucia, Queensland (covering the University of Queensland): 8%
How far did people cycle to work? (in Melbourne)
It is difficult to get precise distances for journeys to work, but approximations are possible. I’ve calculated the approximate distance for each journey to work by measuring the straight line distance between the centroid of the home and work SA2s and then rounded to the nearest whole km. To give a feel for how this looks, here is a map showing inner Melbourne SA2s and the approximate distances between selected SA2s:
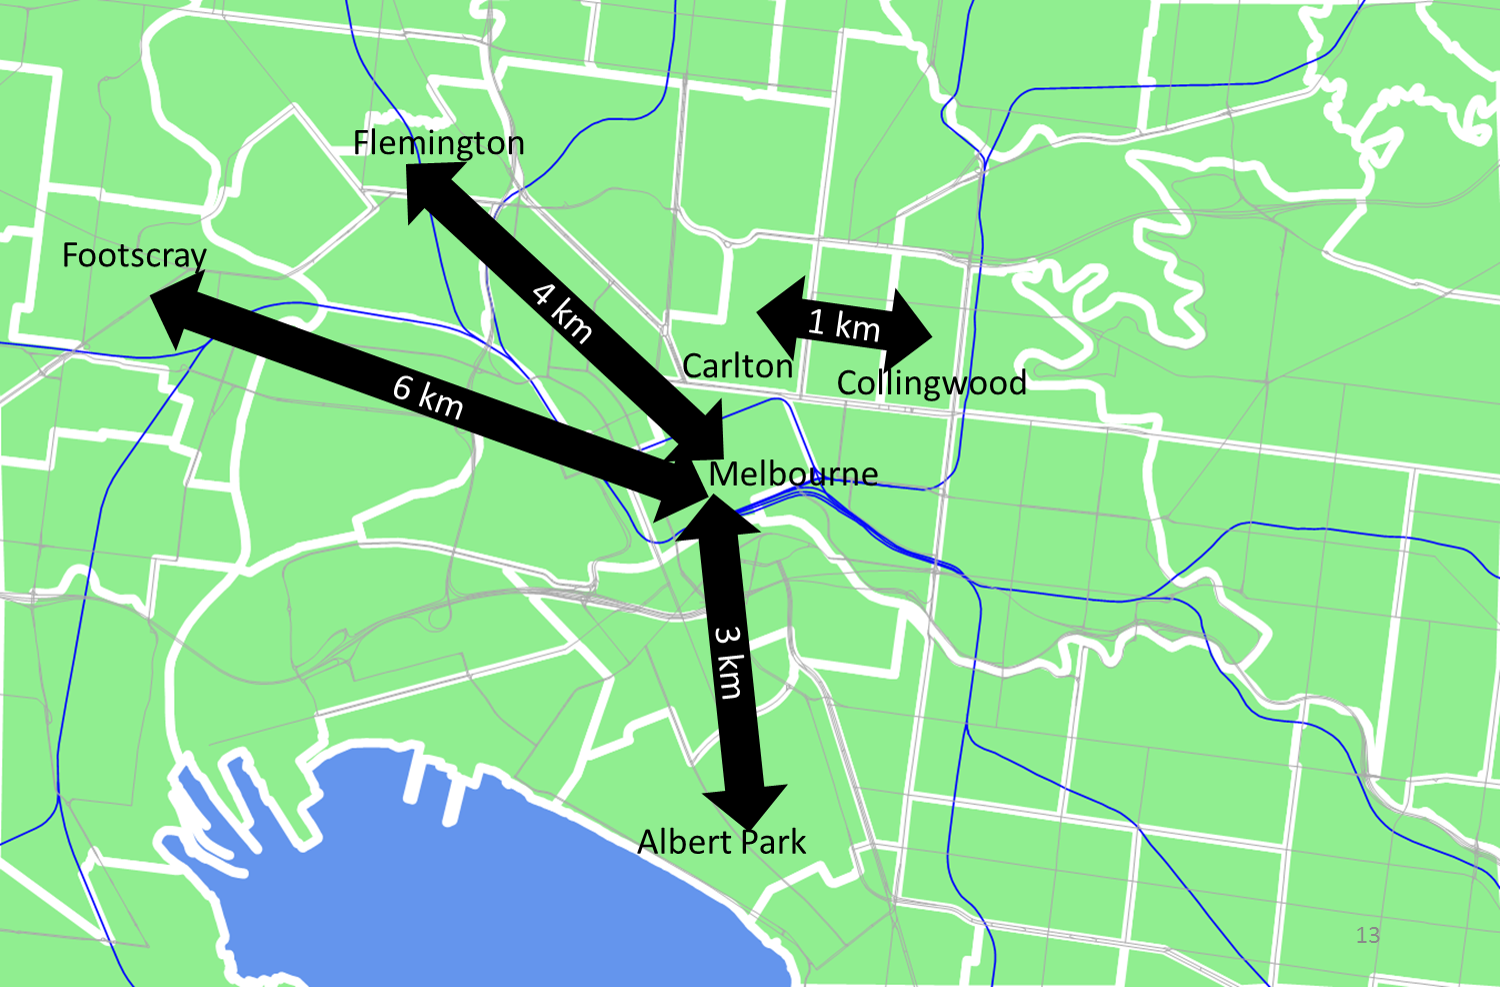
This distance measure generally works well in inner city areas. However in the outer suburbs SA2s are often much larger in size, and sometimes only partially urbanised. However as we’ve seen above the volumes of cycling journeys to work are very low in these places, so that hopefully won’t skew the results signficantly.
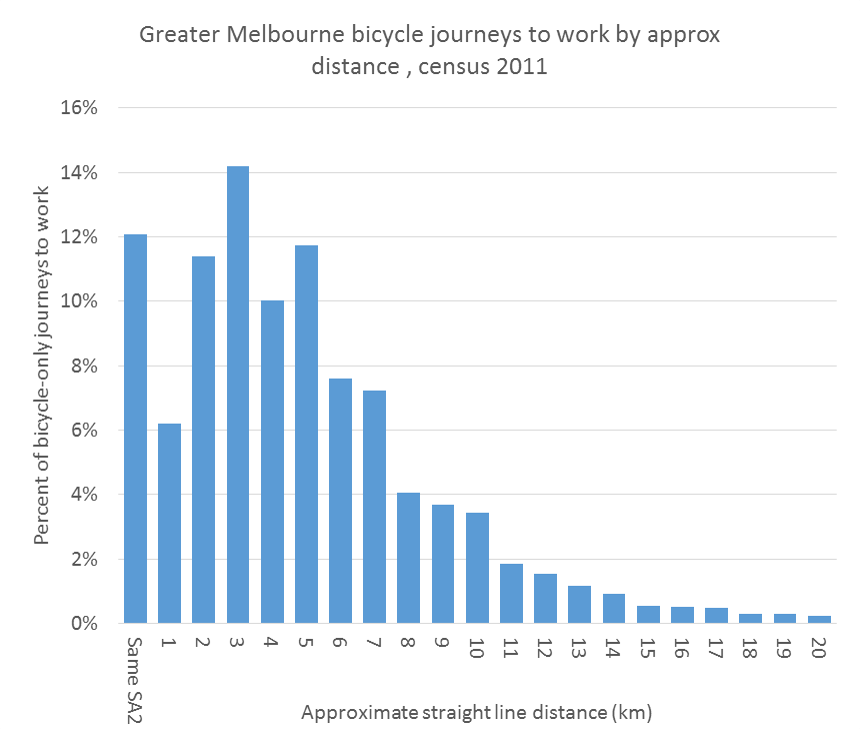
Two-thirds of cycling journeys to work in Melbourne were approximately 5km or less, with 80% less than 7 km, and 30% were 2 km or less.
The longest commute recorded within Greater Melbourne was approximately 44km.
Was cycling combined with other modes?
The following chart shows that bicycles were seldom combined with other modes:
Around 16-17% of cycling commuters in the four largest cities in 2011 involved another mode. Use of other modes with cycling grew in all cities between 2006 and 2011
The next chart shows what these other modes were:
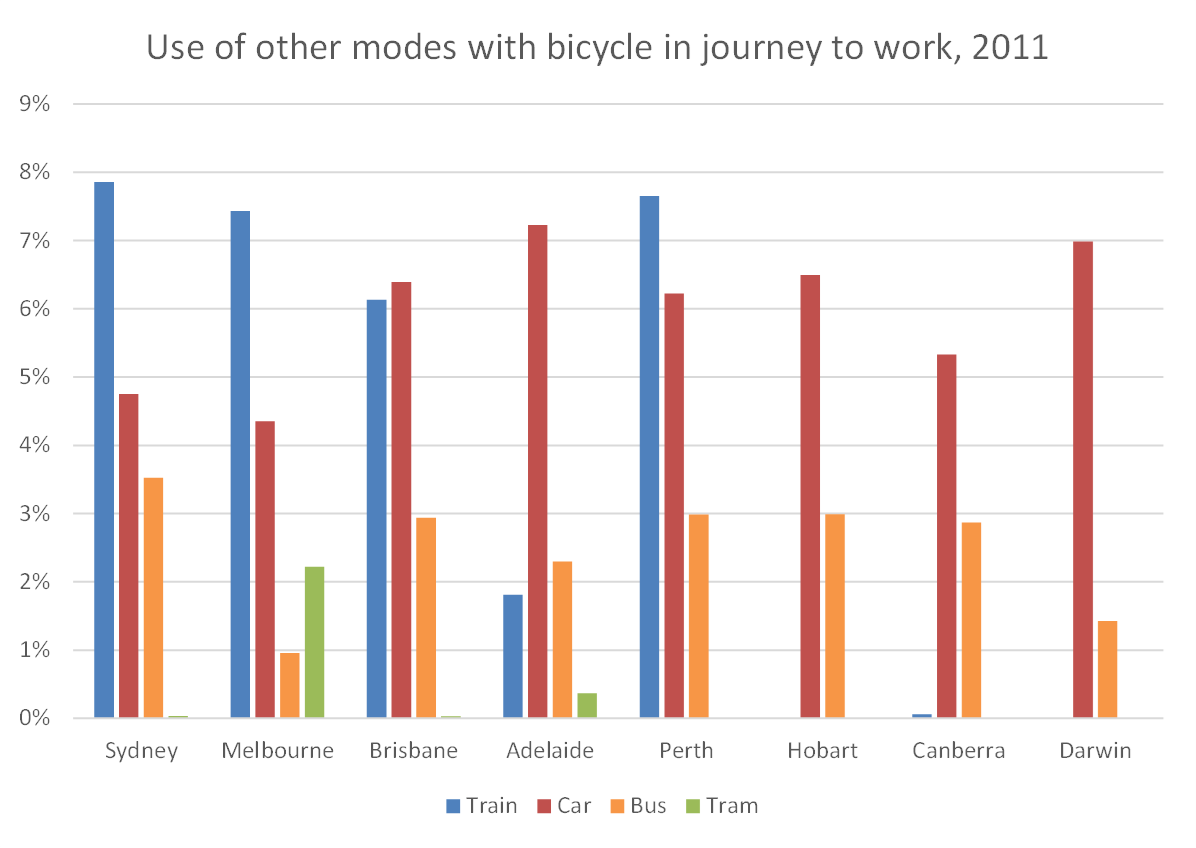
Sydney, Melbourne, Brisbane and Perth had high rates of bicycle use with trains, while combining car and bicycle was more common in the smaller cities.
The next chart shows the number of trips involving bicycle and trains in 2006 and 2011:
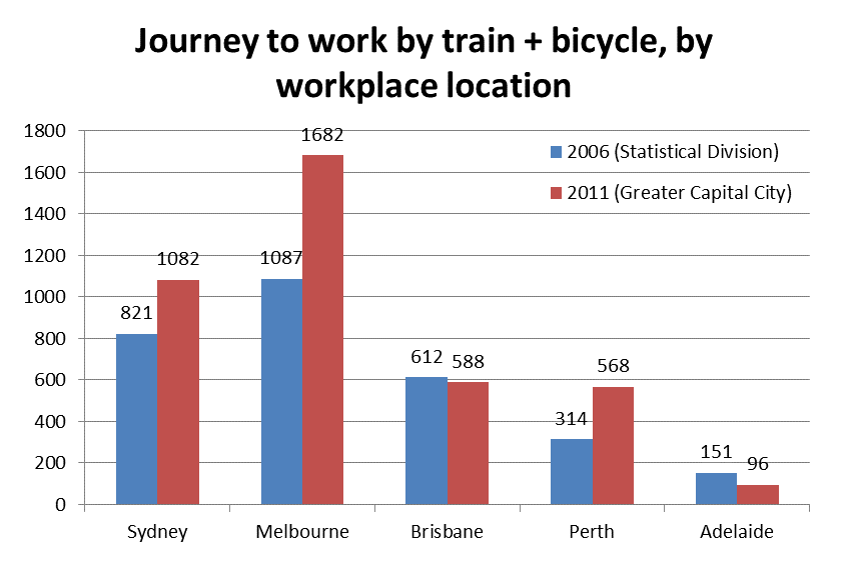
The chart shows the relative success of Melbourne Parkiteer program of introducing high quality bicycle cages at train stations, which has helped boost the number of people access the train network by bicycle by around 600 between 2006 and 2011. I understand a similar project has been undertaken in Perth which saw growth of around 250.
In Melbourne, the home locations for people using bicycle and train are extremely scattered – the following map shows a seemingly random smattering:
How does commuter cycling vary by age and sex?

This chart shows remarkably clear patterns. Males were much more likely to cycle to work. Teenage boys (particularly those under driving age) had the highest cycling mode shares (with teenage girls much less likely to cycle). The next peak for men was around the mid thirties, and women’s mode share peaked around ages 28-32.
Where are women more likely to cycle to work?
Women are sometimes talked about as the “indicator species” for cycling – ie if you have large numbers of women cycling compared to men then maybe you have good cycling infrastructure that attracts a broader range of people.
The census data can shed some light on this. For each SA2 in Melbourne, I have calculated the male and female cycling mode shares both as a home origin, and as a work destination (this analysis looks at people who only used bicycle (and walking) in their journey to work). I’ve then calculated the ratio of male mode share to female mode for each area (SA2).
I’ve used the ratio of mode shares in preference to the straight gender split of cycling commuters – as female workforce participation is generally lower and there can be spatial variations in the gender split of the workforce. 46% of all journeys within Greater Melbourne in the 2011 census were by females, but only 28% of cycling journeys to work were by females.
The following map shows the ratio of male to female cycling mode shares by home location for SA2s (with more than 50 commuter cyclists, and where the bicycle mode share is above 1%):
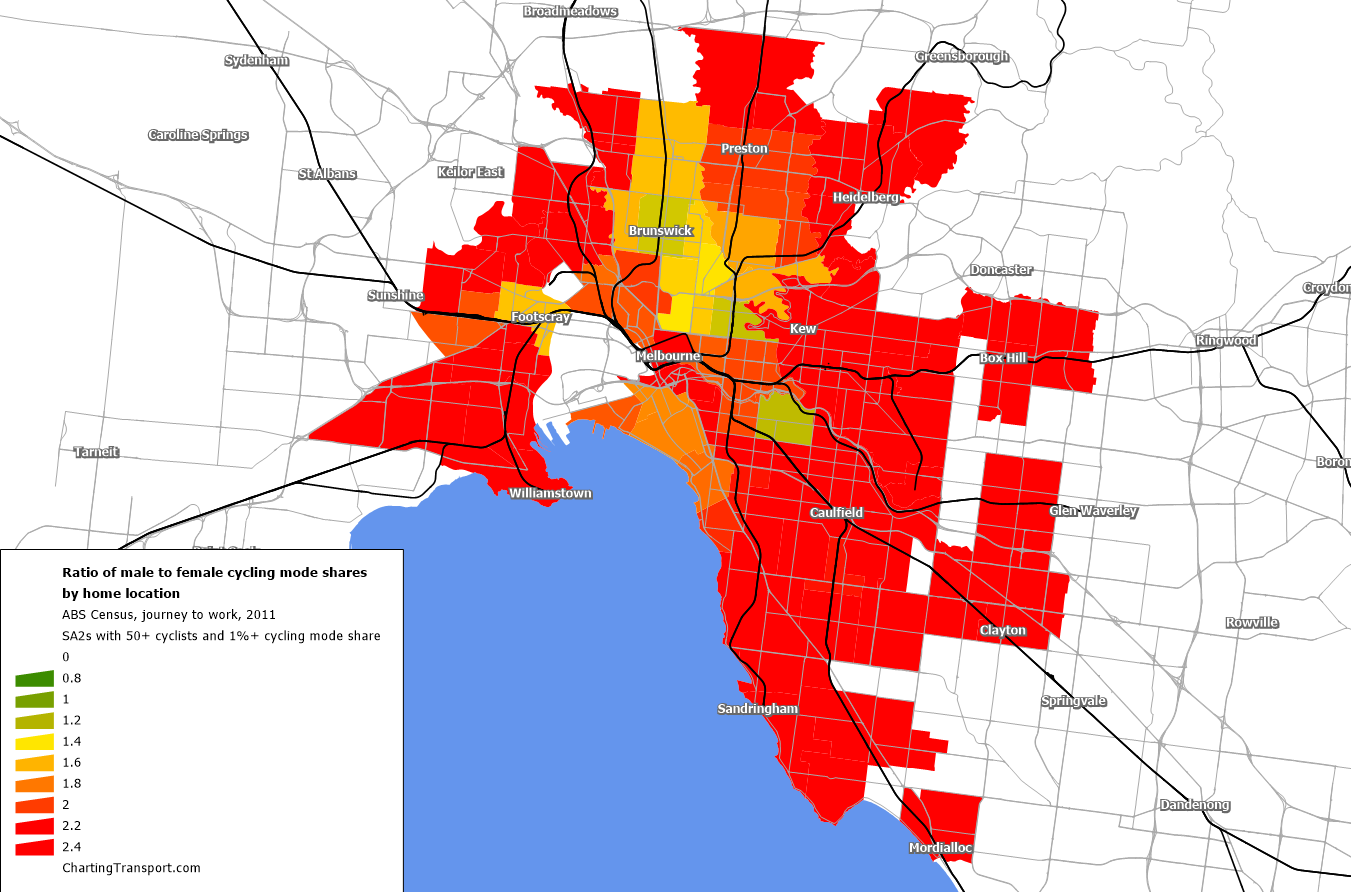
Areas attracting comparable female and male bicycle shares include the inner northern suburbs and – curiously – Toorak (probably many using the off-road Gardiners Creek and Yarra Trails to access the city centre).
Here’s a similar map, but by workplace areas:
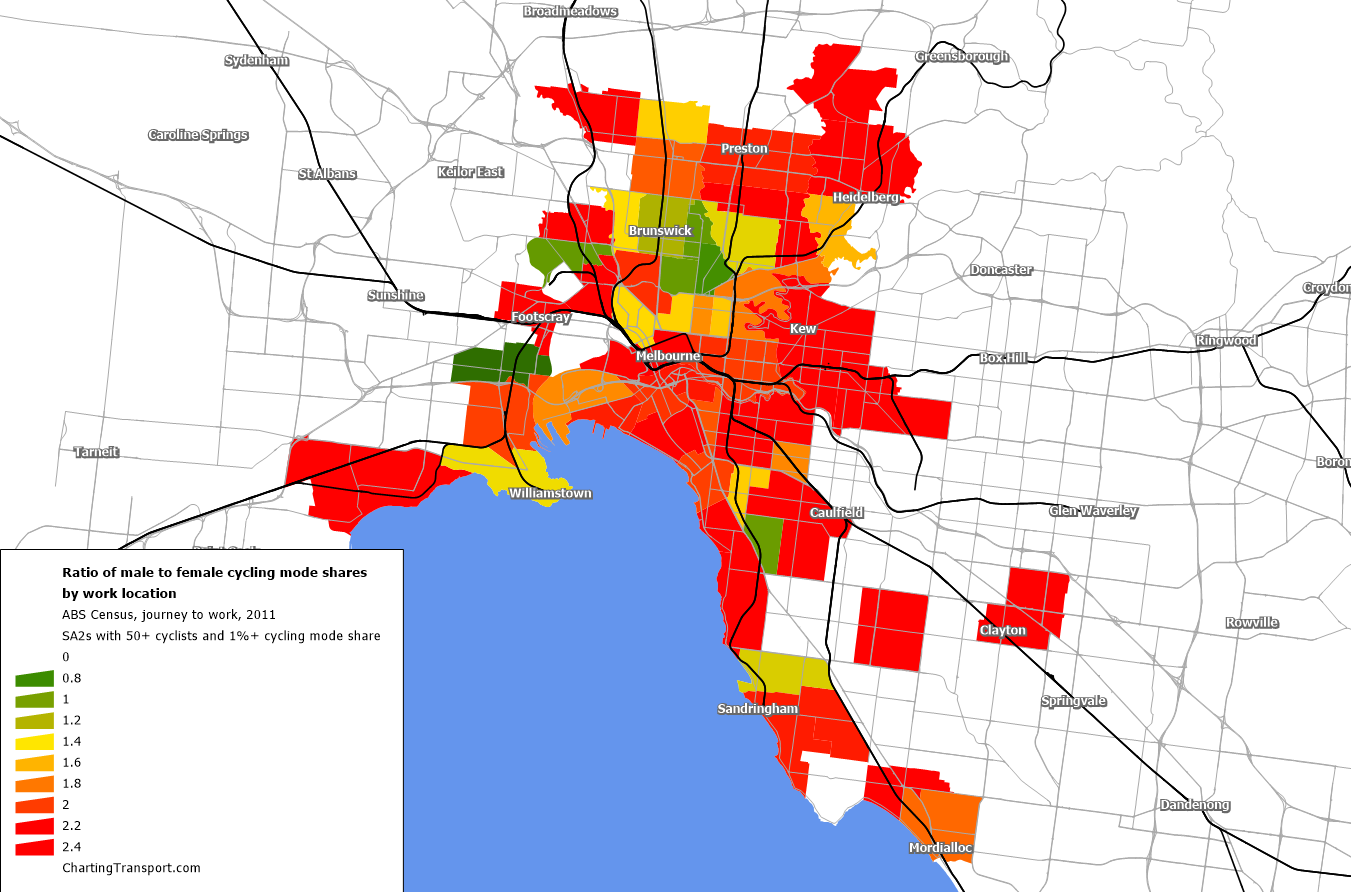
The patterns are much more pronounced. Six SA2s had higher female mode shares than male: Yarraville, Fitzroy North, Brunswick East, Ascot Vale, Carlton North – Princes Hill, and Elsternwick.
The areas with near-1 ratios of male to female mode shares were similar to the areas with higher total cycling mode shares. The following chart confirms this relationship (note areas with cycling mode shares below 1% not shown):

What this also shows is that home-area mode shares reach much higher values than workplace-area mode shares. Perhaps the secret is in the home-area cycling infrastructure? Or perhaps it’s more to do with the residential demographics?
See the Bicycle Network Victoria website for more data about female cycling rates in Melbourne.
Do women cycle the same distances as men?
Again using the approximate straight line commuting distances (as explained above) the following chart shows that women’s cycling commutes are a little shorter than men’s, but not by much:

The median female cycling commute was approximately 1.8 km shorter than for males.
What types of workers are more likely to cycle to work?
Firstly, I’ve looked at the differences between public and private sector employees.
Before I dive into the data, it’s important to recognise that different types of workers are not evenly spread across Australia. Some types of jobs concentrate in city centres while others might be more likely to be found in the suburbs or the country. Therefore many of the following charts show results for Australia as a whole, but also for people working in central Melbourne (the SA2s of Melbourne, Carlton, Docklands, East Melbourne, North Melbourne and Southbank), which has a relatively high rate of cycling to work.
The data suggests public servants were much more likely to cycle to work:

The local government result has prompted me to calculate the cycling mode shares for local government workers across Australia (assuming workers work within the council for which they work). Here are bicycle mode shares for the top 20 councils for employee cycling mode share in the census:
| Council | State | Bicycle mode share |
| Tumby Bay (DC) | SA | 23.5% |
| Kent (S) | WA | 18.8% |
| Carnamah (S) | WA | 16.0% |
| Central Highlands (M) | Qld | 14.3% |
| Uralla (A) | NSW | 13.8% |
| Wakefield (DC) | SA | 13.5% |
| Nannup (S) | WA | 12.5% |
| Broome (S) | WA | 12.1% |
| Alice Springs (T) | NT | 11.8% |
| Narembeen (S) | WA | 11.5% |
| Blackall Tambo (R) | Qld | 11.3% |
| Kowanyama (S) | Qld | 11.2% |
| Exmouth (S) | WA | 11.1% |
| Yarra (C) | Vic | 10.4% |
| Glamorgan/Spring Bay (M) | Tas | 8.7% |
| Torres (S) | Tas | 8.6% |
| Yarriambiack (S) | Qld | 8.3% |
| Mallala (DC) | Vic | 8.0% |
| Richmond Valley (A) | NSW | 7.2% |
| McKinlay (S) | Qld | 6.7% |
Most of the top 20 are non-metropolitan councils. Melbourne’s City of Yarra is the top metropolitan city council (within Greater Melbourne the next highest councils are Moreland 6.1%, Port Phillip 5.6%, Melbourne 5.6% and then Stonnington 4.9%).
National government employees had the highest bicycle mode share of all of Australia. I suspect this relates to university staff, as many of the earlier maps showed university campuses often had relatively high rates of employees cycling (85% of “higher education” employees count as “national government” employees).
The census data can also be disaggregated by income:

Cycling mode shares were highest for people on high incomes. Initially I thought this might reflect the fact that high income jobs are often in city centres were cycling is relatively competitive with private and public transport. However, even within central Melbourne workers, cycling rates are higher for those on high incomes (curiously with a second peak for those on incomes between $300 and $399 per week).
Does cycling to work make you healthier and therefore more likely to get promoted and earn a higher income? Or are employers offering workplace cycling facilities to attract highly paid staff? I haven’t got data that answer those questions.
Consistent with higher rates of cycling for higher income earners, those in more highly skilled occupations were more likely to cycle to work:

I suspect this might reflect the presence/absence of workplace cycling facilities (perhaps office workplaces are more likely to provide cycling facilities than retailers for example) and/or the ability to afford to live close to work (which makes cycling easier).
Are recent immigrants more likely to ride to work?
This one really surprised me and I only investigated it because it was possible to do. The census asks what year people migrated to Australia (if not born here), and it turns out that recent immigrants were much more likely to cycle to work:
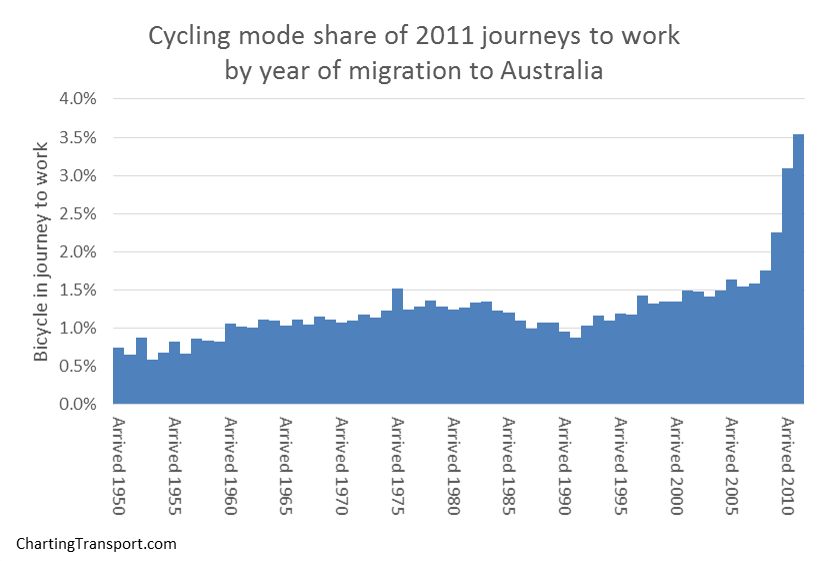
This might be explained by the demographics of recent immigrants (eg car ownership, home location, income levels, occupation and age).
I’d welcome comments on any other trends people might spot in the data.


Hi Chris,
You wonder about the propensity for there to be a larger cohort amongst certain workplaces/salary levels.
There is no doubt that people are influenced by colleagues and information (diffusion of innovation). To shift from one mode of transport to another is no mean feat, and it does become cumulative as more people ride, so more will feel comfortable changing behaviour and riding themselves.
People will shift to the bike when:
a) they see others riding to work, get shown the bike facilities, ride with a buddy for the first time etc = overcome concerns, want to be part of the team. These are sometimes influential people, but not always; it is about changing workplace culture and norms.
b) there is some change to their circumstance ie change of job, major need to save money, health warning, traffic congestion, etc. Namely ‘cognitive dissonance’ – too difficult to continue with old pattern and preferable to change.
This is why activities like Ride2Work and Ride2School are essential as they provide an impetus and support a shared experience within a distinct community be it a school or a workplace or precinct.
Certainly bike infrastructure is essential as it provides a potential rider with greater assurance that they will travel safely.
All the best and keep up the research,
Helen Millicer
Bicycle Network Board Member
LikeLike
Hello Chris
Thanks for your work on this.
Open Street Map data contains very accurate and up to date mapping of Melbourne’s cycling infrastructure as seen here:
http://www.bigyak.net.au/trails/biketrails.html
The extracted cycling infrastructure data can be found here:
http://www.bigyak.net.au/trails/plc/all/kml/bikeinfrastructureOZ_NL.kml
Once this infrastructure data is overlaid on the census heat map of Melbourne’s bike riders by “By home location”, it shows:
1) that where the infrastructure is plentiful, so are the number of cyclists.
2) direct and quality off road paths have more bike riders near them. This is not so readily apparent for on road infrastructure.
3) the Ashburton, Solway and East Malvern areas are extremely well served by off and on road paths converging in the vicinity of the East Malvern station. While some distance from the CBD, there is an associated pocket of cyclists located here.
4) the natural barrier of the Yarra River in Kew, Balwyn and Heidelberg would appear to hinder good access to the CBD from those areas
The Boroondara Bicycle Group (BBUG) is campaigning for a “direct” off road route that would extend the Yarra Trail from Chandler Hwy, along the north side of the freeway, over the Yarra River and through to Dights Falls and subsequently Hoddle St and beyond – that is the “Dights Falls Trail” (DFT). More info here:
http://boroondarabug.org/wiki/M3
We would like to see this built as part of the M3 East West Road Tunnels or as part of the Doncaster Rail Line or whatever else may be built along the Eastern Freeway. The “Integrated Transport Act” requires all transport options to be considered when projects are formulated. The DFT is a worthwhile and inexpensive adjunct to any other project that may eventuate in this location.
The DFT would certainly encourage more people to ride a bike into the CBD, from the geographically constrained northern end of Boroondara, where the census heat maps indicate, encouragement is desperately needed.
John Parker – BBUG member
LikeLike
Chris – I was fascinated to read this article. Thanks for your excellent work. Have you considered Tableau Public for your analysis. I reckon it would be worth checking out. http://www.tableausoftware.com/public/community
LikeLike